
Andrew Skurka's Blog, page 47
July 27, 2017
Preview || Sierra Designs 2018 tents: High Side, Studio, Sweet Suite & Meteor
My coverage of Outdoor Retailer starts at the Sierra Designs booth (naturally, since they’re paying for me to be here). For 2018 SD has largely revamped its shelter line-up. Only three current models are being carried forward — the Summer Moon, Clip Flashlight, and my High Route. The remainder will be discontinued and closed out.
Driving philosophy
The new models are less innovative and radical than the old line-up, but ultimately we believe they offer a more compelling package. They have double-wall construction and vestibules, more familiar architectures, and more intuitive setups. To help differentiate them in the marketplace, Sierra Designs emphasized livable space and has priced them more competitively.
With its new models, SD was not striving to break records. Instead, it’s offering a quality and functional product at a good price. For decades this was a winning formula for SD, and under the leadership of Stephen Barnes the brand is trying to get back to that.
High Side
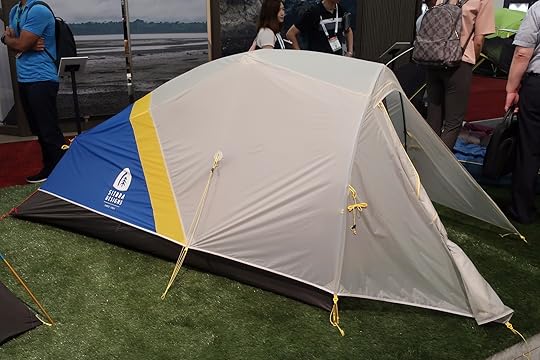
Of the four new models, the High Side is the most interesting to med. It’s a double-wall non-freestanding hoop tent with side entry. The pole set is not symmetrically horseshoe-shaped, but rather skewed to be more vertical on the door-side.

The High Side will appeal to those who prioritize weight and packability over livable space.
At 1 lb 14 oz, it will appeal to weight-conscious backpackers (or bikepackers) who don’t use trekking poles or who appreciate the convenience of a dedicated pole set. It’s also more packable than the average tent, since SD used 12.5-inch pole segments instead of the more traditional 14- or 16-inch lengths.
Of course, the low weight has a cost, in this case less liveable space: the peak height is just 32 inches and the interior floor is space is 18.5 square feet. Thankfully, the side awning can be porched for additional room and ventilation, above the beyond the 8.8-square foot vestibule.
The fly, floor, and mesh fabrics are 20d, 30d, and 15d mesh, respectively, which provides a good blend of weight, durability, and cost. The Studio and Sweet Suite share this same fabric combination.
MSRP is $279.

The High Side’s pole set is not symetrically horseshoe-shaped, but skewed to be more vertical on the doorway side.
Studio 2 and Studio 3
The story about SD’s balancing of weight, space, and price is better told by by the Studio and Sweet Suite models, both of which are available in 2- and 3-person sizes. The semi-freestanding Studio 2 and Studio 3 have one door and one vestibule. They are lighter and less expensive than the Sweet Suites.

The 1-door, 1-vestibule Studio 2. A 3-person version will also be available. To improve liveable space, SD added two horizontal cathedral poles at head and foot, rather than use the more common “fin” architecture.
The Studio 2 will retail for $369 and has a minimum weight of 2 lbs 11 oz. The Studio 3 will retail for $429 and has a minimum weight of 3 lbs 8 oz.
Sierra Designs worked the architecture to maximize liveable space relative other lightweight/ultralight 2- and 3-person tents. Rather than a fin-style roofline, SD added horizontal cathedral poles at head and foot to increase real estate for head and shoulders. The doorway and footbox are also aggressively angled, nearly vertical.

Notice the aggressive, nearly vertical doorway pole, which helps to increase interior volume.
Sweet Suite 2 and Sweet Suite 3
These two promising models will be available September 1 — rather than spring 2018 — through four exclusively retailers: Backcountry.com, Backcountry Edge, Campsaver, and Moosejaw, as well as SierraDesigns.com.
The semi-freestanding Sweet Suites have two doors and two vestibules. Fabrics are the same as the High Side and Studio models (20d, 30d, and 15d mesh). Weights and prices are understandably higher than for the Studios. The 2-person will retail for $399 and specs at 3 lbs 1 oz; the 3-person will retail for $469 and specs at 3 lbs 11 oz.

The inner (without fly) of the Sweet Suite 2. Again, notice the verticality of the interior, due to the cathedral pole and to the aggressively angled head and foot panels.
Meteor 2 and 3
These “standard build” models will appeal to those on tighter budgets and with lower standards for weight and performance. Like the Sweet Suites, they will be available on September 1 from the aforementioned online dealers.
The post Preview || Sierra Designs 2018 tents: High Side, Studio, Sweet Suite & Meteor appeared first on Andrew Skurka.


July 25, 2017
Gear List: Pfiffner Traverse || Colorado Rockies in July


Sierra Designs 35-deg mummy and Thermarest NeoAir, inside of the SD High Route Tent 1FL (fly only). Bear can and other gear scattered around.
It’s been years since I posted a complete backpacking gear list for a trip. Instead, I’ve been doing in-depth dives on specific categories (e.g. shelter systems, stove systems, first aid kits) that I believe are more instructive and universally relevant than lengthy gear lists that are specific to a single location, season, and group size.
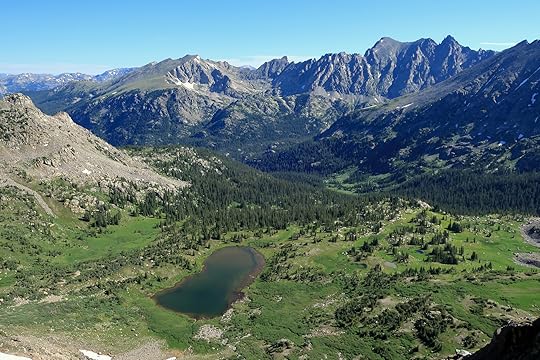
Nonetheless, in this post you’ll find my gear list for my recent yo-yo of the Pfiffner Traverse, a 77-mile high route between Milner and Berthoud Passes in Colorado’s Front Range that passes through Rocky Mountain National Park, Indian Peaks Wilderness, and James Peak Wilderness. Overall, my kit was spot-on, and it’d serve as a helpful template for a similar trip.
Objective & conditions
There is a “right way” to backpack. Specifically, you should have the gear, supplies, and skills that are appropriate for your trip objective and the conditions.
The focus of this post is the gear. (Supplies and skills are beyond its scope.) But before going there, I will quickly discuss my trip objectives and the conditions.
The Pfiffner Traverse is an extremely ambitious route. It’s 40 percent off-trail, and it climbs or descends a whopping 760 vertical feet per mile, almost exclusively between 10,000 and 12,000 feet above sea level. I was trying to move fast, because I had limited time and because, well, I like to move fast. On this trip, every ounce mattered, and I did my best to pare extraneous items without being “stupid light.”
Below I’ve summarized the conditions. For visuals of the route, refer to these photos.
Temperatures were in the 60’s and 70’s during the day, and 40’s at night.
Precipitation was short-lived and limited to the afternoons, as part of the normal summer monsoon cycle.
Daylight was in abundance, with sunrise around 6 AM and sunset around 8:15 PM.
Footing was varied: established trails (dirt, gravel, and cobble rocks), firm and soft tundra, overgrown meadows, light bushwhacking with blowdowns, ample scree and talus, and lingering snowfields.
Vegetation was highly dependent on altitude, slope aspect, and drainage. Most of the route is in alpine or spruce/fir forest, the latter of which is punctuated by frequent water-logged meadows.
Navigational aids made for easy navigation. The topography is very distinct, and the hiking trails are well established.
Sun exposure was intense, with bluebird days, high altitudes, and highly reflective lingering snowfields.
Water was widely available in the valleys, but scarce when walking on or just below the Continental Divide.
Problematic wildlife was non-existent. I avoided high-use campsites and the associated populations of mini-bears (e.g. mice, squirrels, marmots), and the Front Range has very few black bears.
Biting insects were relatively scarce, even though July is the peak hatch, and were easily managed with pants and some insect repellent — or by limited stops to bug-free areas (e.g. windy ridges).
Remoteness is usually not a quality associated with the Front Range, but the Pfiffner Traverse is different in this respect. When off-trail, I saw no other hikers.
Natural hazards included lightning and, more importantly, steep lingering snowfields below high passes that hardened overnight. Runoff was not an issue: the Pfiffner Traverse stays high in watershed; plus, peak melt was in June.
Summary
A line-by-line gear list is further down this page. Here’s a big-picture look:
List versus reality
The 17.6-lb base weight sounds accurate, given that I was carrying a bear canister, ice axe, full-sided shelter, and a framed backpack. When I left the trailhead, my pack weighed 33 lbs, with food and stove fuel, but no water. That would leave about 15.5 lbs for 9 days of food, or 29 oz per day.
The MSRP calculation is wildly off. First, for very few items would I ever have to pay full retail. For example, I bought my $130 shoes for $60 and my $45 fleece for $22; and my $300 shelter is available for $225-240 several times each year when Sierra Designs offers a 20-25 percent site-wide sale. Second, I own some expensive gear that isn’t critical. For example, I could get by with a $170 altimeter watch rather than a $300 GPS sport watch, $30 Cascade Mountain Tech trekking poles rather than BD’s $170 Alpine Carbon Corks, and my smartphone rather than a $400 compact camera.

Breakfast on Day 1 atop Mt. Flora, a 13’er
Gear List: Pfiffner Traverse, Colorado Rockies in July
To make this list more viewing-friendly, open it in new window.
If you like the look and organization of my gear list, consider using my 3-season gear list template.
Questions about my selections? Leave a comment.
The post Gear List: Pfiffner Traverse || Colorado Rockies in July appeared first on Andrew Skurka.
Review: REI Quarter-Zip Fleece Pullover || Benchmark standard for $22


Wearing a 200-weight fleece atop 13,250-foot Mt Bancroft, where the wind was howling at 30 mph and temperatures were only in the 50’s.
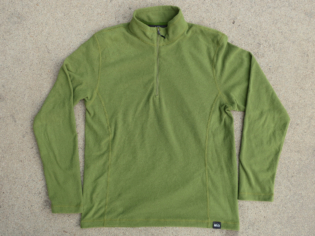
On three-season backpacking trips in the Mountain West, and on cooler trips elsewhere, I consider a fleece top like the REI Co-op Quarter-Zip Fleece Pullover ($45, 8 oz) to be an essential item. It serves two functions:
As a second layer in brisk conditions (e.g. chilly mornings, windy ridges and peaks), when my hiking shirt isn’t sufficiently warm on its own; and,
As a mid-layer in cool-and-wet or cold-and-wet conditions, worn between my hiking shirt and rain shell, to insulate me and to buffer any precipitation or perspiration that seeps through or is trapped by my rain gear.
A fleece is complementary to, not a replacement for, a high-loft jacket with down or synthetic insulation, such as the Patagonia Ultralight Down Hoody. That piece is useful for trapping body heat during inactivity, like during a rest stop or in camp.
For backpacking, the most desirable fleece is also perhaps the simplest. It should be made of 100- or 200-weight polar fleece (or similar), have a chest zip, and be sized to fit over a hiking shirt. That’s it. No full-length zips, pockets, water- or abrasion-resistant panels, wind-resistant membranes, or other extraneous features.
Review: REI Co-op Quarter-Zip Fleece Pullover
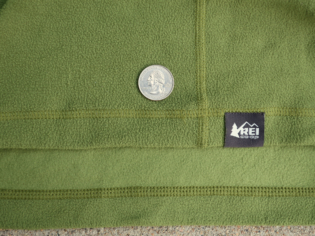
This $45 top — which is on sale now for just $22 — may be the benchmark for backpacking fleeces. It’s an exact match to my earlier description: 160-ish weight polar fleece, quarter-zip, and feature-less. My size Medium weighs 7.1 oz.
I purchased the Pullover for a yo-yo of the Pfiffner Traverse, a high route through Colorado’s Front Range that hovers between 10,000 and 12,000 feet in elevation, and used it daily. It was lovely for the mornings — when I would start hiking at 6 AM, temperatures had not warmed up yet, and the sun was often blocked by high ridges. It was also useful during a few afternoon thunderstorms, during which temperatures seemed to plummet.
Quite simply, there’s nothing more I want in a fleece top for backpacking. If I was willing to spend two- or three-times more, I could find a more high-performance fleece (e.g. hooded, more breathable fabric, or thumb loops), but it would not be two- or three-times better, or more applicable for 3-season conditions.
My only reservation in a full-throated endorsement of the REI Pullover is that I’m uncertain of its durability. After 1.5 weeks of hard use, it’s as good as new. But what about after 1.5 years? REI used a run-of-the-mill polar fleece fabric, which based on previous experience will result in reasonable durability. With extensive use the fabric will start to pill and thin, and eventually need replacement.
Own the REI Quarter-Zip Fleece Pullover? What’s been your experience with it?
Disclosure. This website is supported mostly through affiliate marketing, whereby for referral traffic I receive a small commission from select vendors, at no cost to the reader. This post contains affiliate links. Thanks for your support.
The post Review: REI Quarter-Zip Fleece Pullover || Benchmark standard for $22 appeared first on Andrew Skurka.
July 23, 2017
In 12 photos || Trip Report: Pfiffner Traverse Yo-Yo
Thanks to a delayed arrival of winter, in late-October of last year I finished piecing together the Pfiffner Traverse, a 77-mile high route through Colorado’s Front Range between Milner and Berthoud Passes. But I felt it important to get on the route again this year as a thru-hiker and as soon as conditions permitted, to gain a more holistic perspective, to determine how runoff and lingering snow affects the route, and to give the Pfiffner Traverse Guide a final edit.
For several reasons I recommend thru-hiking the Pfiffner Traverse southbound, from Milner to Berthoud. My yo-yo started at Berthoud, which gave me a chance to check conditions and scout several alternates before hitting the turnaround and giving the second leg an honest go. I started with 9 days of food (minus a dinner) and finished in 8.5, for an average of 20 miles and 7,000 vertical feet of climbing per day.
From nearly 1,000 images, I’ve selected twelve and organized them geographically from north to south:
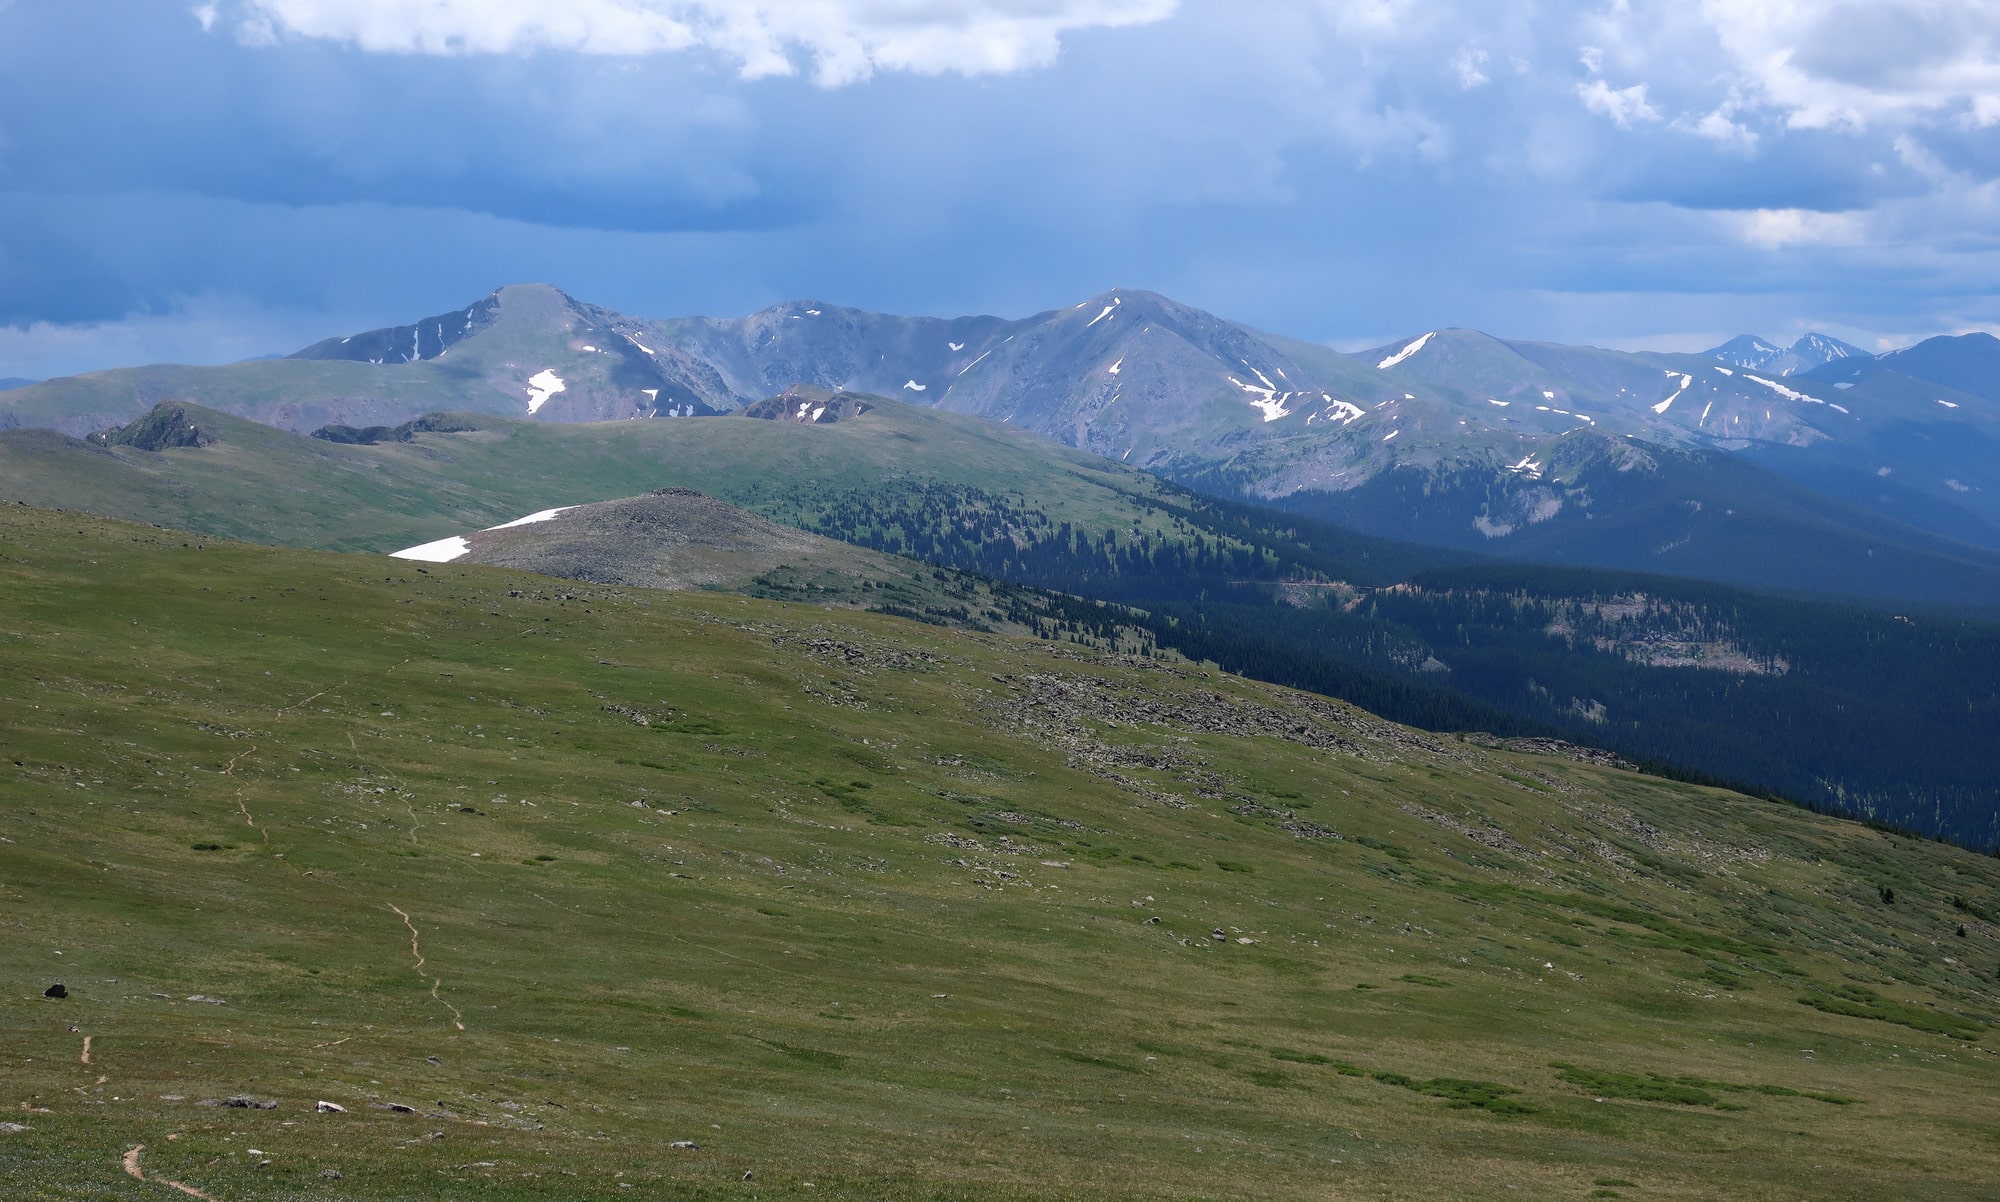
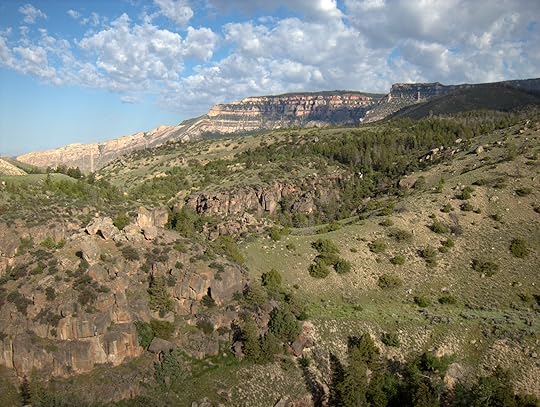
From Milner Pass, where Trail Ridge Road crosses the Continental Divide in Rocky Mountain National Park, the Pfiffner Traverse climbs five miles to the summit of Mt. Ida (elev 12,865). The trail is mellow, but it thrusts you immediately into Sound of Music-worthy terrain.

The Mt. Ida Trail, looking north towards Milner Pass, Specimen Ridge, and the Mummy Range.
Assuming a normal winter, July is my favorite month for high country travel in Colorado. Seasonal vegetation has greened up and wildflowers are blooming, but lingering snow still laces the high peaks and leeward slopes. The bug pressure is relatively light and easily managed.

A lush wildflower-filled meadow in upper East Inlet.
If I see as many elk and deer in November as I did on this trip, I will most certainly fill my chest freezer. I saw big herds (up to 40 head) at Sprague Pass, on the south side of Ptarmigan Peak, in Paradise Creek, and at a honey hole on USFS lands that I won’t mention.

A trophy bull near Hallet Creek in Rocky Mountain National Park. So long as he stays within park boundaries, he’s got a good life.
One perk of off-trail exploration is the “discovery” of unknown features and places, such as this 30-foot waterfall that gushes with spring runoff. To break through the cliff band that wraps the valley, an elk trail must be followed.

An unnamed waterfall on an undisclosed creek known only by elk and Pfiffner Traverse hikers.
The Pfiffner Traverse consists of a recommended Primary Route as well as easier and harder alternates that can be followed in the event of inclement weather or extra energy.

Thunderbolt Creek, as seen from the Ooh La La Extra Credit route, north of Buchanan Creek.
An unnamed alpine lake in upper Thunderbolt Creek, which can be appropriately referred to as Paiute Lake since it sits immediately below Paiute Peak (elev 13,088).

Paiute Lake in upper Thunderbolt Creek
The most technical and hazardous section of the Pfiffner Traverse is the Northeast Gully, which is the least difficult route out of Lone Eagle Cirque and into upper Arapaho Creek. When it melts out, usually by August, it’s supposedly Class 2 scree and talus. If 40-degree snow slopes aren’t your thing, there’s an all-trail route around. The route never exceeds Class 2+/3- in difficulty.

In mid-July after a very wet spring, the Northeast Gully was still loaded with snow. An ice axe was mandatory, and crampons are highly recommended.
My favorite part of the route is its middle, from North Inlet to Columbine Lake. Arapaho Creek is near the southern end of this segment, and has perhaps the biggest scenery of all.

Upper Arapaho Creek, looking north over Caribou Lake towards the Achonee-Hopi ridge, Tribal Lakes basin, Mt. George, and Apache Peak.
Of the eight nights, I cowboy camped (i.e. slept under the stars) for five. For more exposed camps and inclement weather, I was happy to have the Sierra Designs High Route 1FL, which weighs just 22 oz for the fly.

The Sierra Designs High Route 1FL, pitched near Heart Lake on the last night, with James Peak looming 2,000 vertical feet above.
As I ate through my food bag and as the end drew closer, I took on longer and harder days. My daily mileage varied between 13 and 25 miles, but the amount of climbing was more consistent: between 6,000 and 8,000 vertical feet per day.

On average, the Pfiffner Traverse climbs or descends 800 vertical feet per mile. One day, I climbed 6,000 vertical feet in just 13 miles, an average of 925 vertical feet per mile.
Forward progress on Colorado summer afternoons is often curtailed by monsoonal thunderstorms. The more reliable strategy is to get up early, be diligent all morning, lay low in the afternoon, and squeeze in some extra miles in the evening if conditions permit.
Ominous clouds hang over James Peak and four other 13’ers (Parry, Bancroft, Eva, and Flora) that stand between Rollins Pass and Berthoud Pass. Grays and Torreys, two 14’ers, are visible on the far-right skyline.
During my first summer in Colorado in 2003, I spent nearly every single weekend in the Front Range. But thereafter I lost the connection, obsessing about more faraway places like Alaska or the High Sierra. The Pfiffner Traverse is completely worthy as a backcountry experience, but it’s also been a personally gratifying project to reconnect with my backyard.

My sole selfie in 9 days, looking north from Mt. Bancroft towards Rollins Pass and the southern Indian Peaks.
The post In 12 photos || Trip Report: Pfiffner Traverse Yo-Yo appeared first on Andrew Skurka.
July 11, 2017
Camping Regulations for Iceland’s Laugavegur Trail
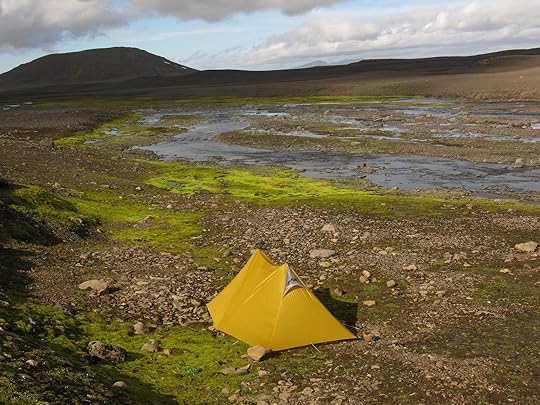
I am a hut warden in one of the huts on Laugavegur. It has come to my attention that many of my guests have read your post when preparing for the Laugavegur hike. Not surprisingly, as it is both a very informative post and one of the top results when you google “Laugavegur camping.”
The post Camping Regulations for Iceland’s Laugavegur Trail appeared first on Andrew Skurka.
July 10, 2017
Reader question || Backpacking umbrellas: Pros, cons & recommendations


With warm temps, steady rain, high humidity, and light winds at this pre-dawn start, Buzz was very happy with his umbrella, especially since we would spend the next four hours climbing. Meanwhile, Peter and I both had conventional WPB rain gear, and we were over-heated within 30 minutes of leaving the trailhead.
Recently I received a question from reader Eric W about umbrellas, which I’ve mentioned previously (e.g. Core 13 Clothing, The Ultimate Hiker’s Gear Guide) but never addressed in great detail:
Do you advocate the use of umbrellas for backpacking in the rain and/or under intense sun? If so, what brands and models would you recommend that can withstand the abuse but that are sufficiently lightweight?
Under at least some circumstances, all modern raingear options for backpacking are flawed. For example, most rain jackets and pants — which are the most common selection — are made of waterproof-breathable fabric, the performance of which does not live up to its hype. Plus, premium WPB fabrics are absurdly expensive.
Another option is the classic poncho. It’s cheap, lightweight, and well ventilated. But it leaves the arms and lower legs exposed, and it’s clumsy in the wind, on poorly maintained trail, and when off-trail.
Umbrella as backpacking rain gear
An umbrella like the My Trail Company Chrome Umbrella is similarly imperfect as backpacking rain gear — it works well in some circumstances, and fails in others.
Umbrellas excel in:
Warm or hot temperatures,
High humidity,
Low winds, and,
Well maintained trail systems.
What do these conditions look like? Imagine hiking forested sections of the Appalachian Trail — or another well established trail in the eastern woodlands like the Superior Hiking Trail or Ouachita Trail — during the warmer months.
In these conditions, a rain jacket and pants is completely unrealistic. If you’re warm and perspiring in just a t-shirt and shorts, a jacket and pants will quickly become unbearable. A poncho would be an improvement, but nothing rivals the ventilation of an umbrella.

Umbrellas excel in environments like this one: warm temperatures, high humidity, wind-resistant tree cover, and open trails.
But when the weather is cooler, drier, and windier, and when the hiking corridor is less manicured, I think other rain solutions become more compelling. For example, I’d much rather have a jacket/pants or poncho/pants combination when an afternoon thunderstorm catches me near treeline on the Colorado Trail or in the High Sierra. The warmth and wind-resistance of these systems would be much preferred over the airiness of a umbrella, and I wouldn’t have to worry about damage to my rain defense caused by high winds.
Umbrella as shade
In extremely sunny environments, umbrellas have an additional use: portable shade. By blocking the sun’s rays, you can stay noticeably cooler. The ambient temperature will still be hot, but at least you will no longer be additionally cooked by the radiation.
The radiant heat will be deflected by any umbrella, but models with radiation-blocking fabric (e.g. mylar) will perform best.
Product recommendations
Backpacking umbrellas are a niche market and options are relatively limited.
The Chrome Umbrella ($40, 8 oz) from My Trail Company has been around for nearly 20 years — it was one of the first GoLite products launched in 1999, as the Chrome Dome. It’s proven and reliable, as evidenced by the exact same model being sold by Gossamer Gear, Six Moon Designs, and ZPacks.

The 8-oz My Trail Company Chrome Umbrella, a time-tested classic
If you want to explore other options, Montbell offers a half-dozen models that are generally lighter and smaller, but more expensive.
Finally, you can gamble with a completely different option on Amazon, like the Repel Windproof Travel Umbrella. But YMMV — the reliability in a backpacking application is difficult to determine based on the product specs and reviews.
What’s been your experience with a backpacking umbrella? When do they excel, and fail? If you’ve never used one, why not?
Disclosure. This website is supported mostly through affiliate marketing, whereby for referral traffic I receive a small commission from select vendors, at no cost to the reader. This post contains affiliate links. Thanks for your support.
The post Reader question || Backpacking umbrellas: Pros, cons & recommendations appeared first on Andrew Skurka.
July 9, 2017
Experimental rain gloves: Handwear for cold-and-wet conditions
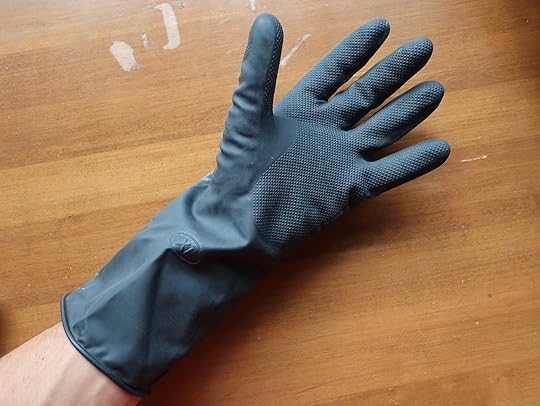

Will these keep my hands warm & dry when it’s cold and wet? Medium-duty latex gloves, 3 oz and $5, layered over my liner gloves.
On Thursday I start a yo-yo of the Pfiffner Traverse, a 77-mile high route in Colorado’s Front Range between Milner and Berthoud Passes, and I firmly expect at least one monsoonal drenching during the course of it, if not multiple.
The backpacking conditions for which I still have the fewest answers is when it’s cold and wet. And, unfortunately, this is the exact scenario that can be brought on by Colorado’s afternoon storms: rain falls in buckets, winds pick up, and temperatures plummet.
My hands are always the first to go in these conditions. First they get wet, then cold, and finally numb, which makes for at least a suffer-fest if not a show-stopper.
Oddly, the outdoor industry has few solutions for keeping hands warm and dry when it’s cold and wet. Let’s discuss the current options, and then my experiment.
State of the market
The industry’s conventional answer to cold-and-wet conditions is a waterproof/breathable shell worn over layers of clothing. For example: hiking shirt, fleece top, WP/B jacket.
Whereas rain jackets and pants are widely available, I know of only one mass-production shell: the Outdoor Research Revel Mitts, which weigh 3.5 oz and retail for $60. REI still shows their Minimalist Waterproof Mittens on their website, but they haven’t been in stock in 6 or 12 months.
More options are available from the cottage industry:
Borah Gear eVent Rain Mitts
LUL WPB Over-Mitts
LUL Cuben Over-Mitts
Mountain Laurel Designs eVent Rain Mitts
ZPacks Vertice Rain Mitts
I believe that these products are all flawed. I’m generally skeptical of the performance of WPB fabrics already. But handwear is a particularly bad application for it: the performance of WPB fabrics is adversely affected by abrasion and body oils (due to degradation of the DWR finish), and mitts are subjected extensively to both.
Cuben Fiber does not rely on DWR, but it still has an issue with abrasion: this is its weakest performance trait. I’m also not thrilled by the associated $80 price tag.
My experiment
On this trip I’m bringing with me Grease Monkey Neoprene Long Cuff Gloves, which I found at the local Home Depot for $5. They weigh 3.0 oz in size Extra Large, which I can layer over my wool DeFeet Duragloves (size M) or my Glacier Glove Ascension Bay Sun Gloves (size L). The size Large fit well, but don’t leave me room for layering.
Gloves are not as warm as mitts, but in this case I think the root issue is that my hands are getting wet (and then cold). The ambient temperatures are not the problem. So if I keep my hands dry, keeping them warm may not be as difficult.
I’m unconcerned about fabric breathability, or lack thereof. If my hands get too hot (a reason to rejoice), I can quickly remove the gloves to vent.
They are thicker (and therefore more durable) than typical dishwashing gloves. But for long-term constant use, I’d look elsewhere.

3-oz latex gloves from Home Depot for $5
Other options
I purchased two other pairs of gloves before finding these.
Nitrile-dipped gloves from Stanley, very similar to this Firm Grip model, also available from HD (online at least) for $5. They are the lightest option (2.0 oz), but they are only waterproof to the cuff, which seemed inadequate to me.

These nitrile-dipped polyester gloves seemed inadequately waterproof.
True Blues Ultimate Household Gloves are the most durable of the bunch, but also the heaviest (5.7 oz) and most expensive ($11) for the size Large. They seemed excessively heavy-duty.

These are the more durable, heaviest, and most expensive option. They seemed overkill.
I’ll report back after the trip. If you’ve experimented along these lines before, what was your experience?
Disclosure. This website is supported mostly through affiliate marketing, whereby for referral traffic I receive a small commission from select vendors, at no cost to the reader. This post contains affiliate links. Thanks for your support.
The post Experimental rain gloves: Handwear for cold-and-wet conditions appeared first on Andrew Skurka.
June 28, 2017
Pace Chart Tutorial || Step 3: Split gathering & goal time correlation
This is part of a multi-post tutorial on creating a pace chart for an ultra marathon. Start with the Introduction, or skip to a specific section:
Introduction
Step 1: Course data
Step 2: Goal-setting
Step 3: Split data
Before I jump into the third and final step in creating a pace chart for an ultra marathon, I thought it would be helpful to review the process so far.
Step 1: In a spreadsheet we created a list of key landmarks on the course, and added pertinent information like distances between these landmarks and where drop bags can be sent.
Step 2: We established a goal time for the race, using training data, past race performances, or the ITRA index.
In this final installment, I will explain how to:
Find splits between course landmarks, and then
Correlate these splits to your goal time.
Let’s get started.
Finding splits for ultra marathons
The ideal
Several ultra marathons have frequent timing stations (e.g. at every aid station), with race officials or automated timing systems recording the cumulative time and placement for each runner. A subset of these races will share the data, probably on their websites.
One example is Western States 100, which publishes splits from about twenty landmarks along the course. The page has a disclaimer (“unofficial times [that] may not be completely accurate”) but in this particular case I’d assume that the splits are generally trustworthy.
Data mining on Strava
If official/unofficial split times are unavailable, the backup option is to use Strava. More likely than not, this is what you will have to do. A few comments:
You need to find runners on Strava who ran the race previously (including yourself) and who uploaded their race data. Many ultra runners are on this platform and normally you can find a few for any moderately popular race that’s been around for a few years.
If you have your pick of the litter, select runners who executed smart races (i.e. conservative start, steady effort, relatively strong finish), regardless of whether they finished near your goal time or not — we can account for that later.
If Strava’s search tool were better, this process would be easier. For example, I’d like to search for “Bighorn 100” or “Andrew Miller Bighorn” and get relevant results. Instead, only names can be searched, which is a challenge for common names like “Nate Jones.” In those cases, try finding their Strava profile through their blog, or contact them directly for a link.
In longer races like 100-milers, GPS watches are vulnerable to dying unless measures are taken to extend the battery life of the watch, like changing the GPS interval to 5 seconds instead of 1 second. If you must, you can use data from a runner whose watch died 12 hours into a 20-hour race, but it’s best to find complete data profiles.
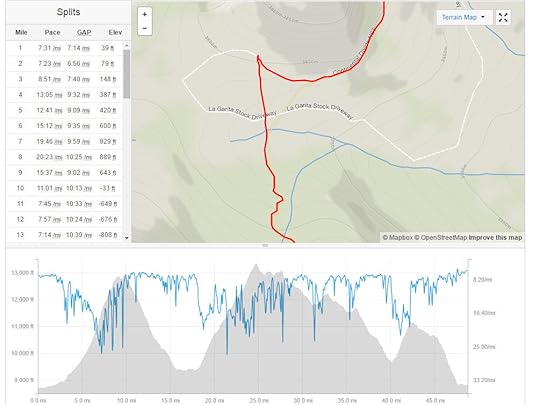
Using the topographic map and the time plot on the Strava activity page, manually record the splits for your selected runners. I select the first split available that is after my chosen landmark, e.g. aid station. The data available on Strava is insufficient to get an in/out time at aid stations.
Tip: As you scroll across the time chart, you can freeze your location with a left-click. This allows you to mouse over to another window/program without losing your place.
If you don’t know the location of the landmarks, you will have to find maps with their locations (or written descriptions). To start, check the race website. If the official maps are unsatisfactory, use CalTopo, which is a kick-ass mapping platform.
In some cases, there are telltale signs of the location of an aid station. For example, you might notice that the runner’s heart rate dropped significantly for a minute or two, or you might see some random directions in their GPS track (when they might have been searching for their drop bag or when they jumped into a portable toilet).

The San Juan Solstice has an aid station around Mi 32. Between the map and heart rate chart, it’s easy to see exactly where it is. On the map, the course makes an unnatural sharp turn, instead of cutting the corner. And on the HR chart, you can see a dip in my HR at around Mi 32.
Take the average of multiple runners
After recording the splits for your chosen runners, average their splits. This helps to negate individual experiences or strengths/weaknesses that you are unlikely to share. For example, a runner:
Stops for 5 minutes to empty their GI in a portable toilet;
Hauls on the downhills, but is a relatively weak climber; or,
Slows down while enduring a violent hour-long thunderstorm.
Correlating splits to a goal time
After averaging the splits of three runners, suppose that their averaging finishing time is 19:17. But your goal time is about an hour slower, in 20:15. How do you reconcile the difference?
The final step in creating a pace chart is to adjust the splits to reflect your goal time. I’ve had good success in doing it on a proportional basis. In the example above, a 20:15 finishing time is 5.0 percent slower than 19:17.
To create splits that will lead me to a 20:15 finish, I simply add 5.0 percent to the average splits of my chosen runners. For example, if on average they reached the first aid station in 40 minutes, I should plan to get there in 42 minutes (because 40 * 1.05 = 42.0).
Quick example
Last year I ran the San Juan Solstice, a fantastic 50-miler in southwest Colorado.
Here’s my list of landmarks, from Step 1:

List of aid stations with pertinent details on the SJC50 course.
I established a goal time of 9:15, based on a past result (from 2008) and on comparative results with Jason Schlarb — we both had competed in Run Rabbit Run the previous year.
Next, I found Strava data for Schlarb, Brendan Trimboli, Michael Barlow, and Ryan Smith. Of these four, Schlarb and Trimboli ran the smartest races, so I took an average of their splits. Barlow and Smith had solid finishing times but faded badly throughout the race. I didn’t use their data because I don’t like to race that way.

Actual splits for four different runners, extracted from Strava. I averaged the splits for Jason Schlarb and Trimboli because they ran smart races, and I didn’t use the other data.
When I took the average of Schlarb and Trimboli, the finishing time was 8:28. My goal time of 9:15 was 9.2 percent slower. So I added 9.2 percent to all of their splits, to create my own pace chart for a 9:15 finish. Here it is:

My complete pace chart for SJC50, which had me finishing in 9:15, 9.2 percent slower than the average finishing time of Schlarb and Trimboli.
Thanks for reading. I hope it didn’t make your head explode. If you have any questions about this tutorial, please leave a comment.
The post Pace Chart Tutorial || Step 3: Split gathering & goal time correlation appeared first on Andrew Skurka.
June 27, 2017
Bighorn 100 Race Report || 1st place in 4-way tie, 21:30:08


In 2017 the Bighorn 100 was more like a 100-mile Tough Mudder.
Quick links
Official results
Strava data
Special thanks to Aleksandr Khomyakov and Judy Garber for some of the photos, and Judy and David Garber for hosting me at their picturesque ranch in Big Horn.
When I pulled into Elk Camp at Mi 43.5 of the Bighorn 100, I was much less happy than I should have been. The station volunteers were enthusiastic and helpful; I was leading the race and had a 29-minute gap on my goal pace, which meant that I was on course record pace; and I felt relaxed, comfortable, and in control.
But it had started to rain about five miles earlier, and for the past half-hour had been heavy enough to warrant my shell jacket. Rain was in the forecast, so I was prepared, and I was expecting that management of the cold-and-wet conditions would cost time.
However, by Elk Camp an even bigger time-killer had been revealed: greasy, slick-as-snot mud that the rain was creating.
The resulting loss of traction forced me to hike grades that I had been running pre-rain, and to run next to the trail where practical (not on it) because plowing through grasses and slalom-ing through sage was faster than the open footpath. Race organizers had warned us about pockets of “shoe-sucking mud” where the ground was still saturated with snowmelt, but I was never told that the course would become an ultra-distance slip-and-slide with enough rainfall.
As one volunteer filled my bottles, another with pretty eyes asked how I was doing. “Frustrated. This course just got very slow,” I remarked. At the time, I didn’t know how prophetic this comment was, or how the conditions would completely undermine my effort to that point.
Race expectations
When I constructed my 2017 racing schedule, I knew that the turnaround between the Boston Marathon on April 17 and the Bighorn 100 on June 16 would be tight. After accounting for a two-week recovery, two-week taper, and a one-week “normal person vacation” to Scotland, I would have only a few weeks in which to re-adapt to mountain ultra trail running.
Nonetheless, I felt confident as race day approached. Most tellingly, I’d been lopping significant time off long-standing PR’s throughout Boulder’s foothill trails. For example, I lowered my Green Mountain Loop split by 4 minutes, from 63 minutes to 59. When extrapolated to a 20-hour ultra, that improvement amounts to 80 minutes!
Based on a comparative analysis of past Bighorn results, I was hoping to finish in 19:30, with quiet hopes for better. Coach David was more confident, saying that a 19:30 was a shoe-in and that a course record was within reach. David loves to flatter his athletes about how great they are, but I’ve found that his performance goals are reality-based. Even so, I was skeptical.
A 19:30 is normally in the mix for a win, but I would have been happy with a non-win if Bob Shebest, Michael Owen, Paul Terranova, or some fresher face dragged me to a faster time.

Starting clothing & gear. The pee-colored bottle is honey water (2.5 oz honey, 17 oz water).
The start
One perk of the incoming weather was that conditions were relatively comfortable at the 10 AM start: it was mild and mostly cloudy, although humid by Westerner standards. On a more typical June day — when the sun would have been heating up the Tongue River canyon for almost five hours already — I imagine the race couldn’t begin soon enough.
At the start I positioned myself about 20 feet back, expecting a foolhardy Run Rabbit Run-style off-the-line charge. But the field was more controlled than usual, so my plan backfired: if I’d started at the front, I still could have kept my effort in check without having to weave through any traffic before the course jumped onto singletrack.
The pace at the front seemed a bit too relaxed, so I took the lead before we reached the trailhead. Eric Lipuma, who I know from Boulder and who would eventually become one of the other three winners, came with me.
I soon regretted that decision. With the talent in this field, I could have relaxed in the Top 5 or 10 for the first 90 minutes without losing meaningful time off my intended pace. Instead, now I was using mental energy to pace-set, and I was getting anxious about what the field was doing behind me.
From Lower Sheep (Mi 3.5) I settled into a steady hike to keep my heart rate low on the first of three major climbs. I was tempted to jog a few rollers but opted not to. My average HR for the first 8.5 miles — during which we climbed 3,600 feet — was a purring 143 bpm. Paul Terranova stayed on my heels for most of it, and the effort allowed for easy conversation.
My only regret through this section was not drinking more water. It’s an exposed climb, and temperatures don’t cool off until near the top. I burned through both of my 17-oz bottles, plus a refill from a piped spring at 7,000 feet. That still wasn’t enough — it would take hours of deliberate drinking to overcome the hydration deficit from this early climb.
By Dry Fork Ridge (Mi 13.4) Bob Shebest and I had put a few minutes on the rest of the field. I pulled into the aid with a small lead, but lost it while in the potty. The lead would change again 9 miles later for this same reason — a 10 AM start would seem to provide ample time to squeeze everything out, but apparently not.
Before the rain
Bob and I made great time to Sally’s Footbridge (Mi 30.0), never running together but usually within sight. He seemed to be running downhills faster, but I would catch up on flats and climbs. When I left Dry Fork, I was exactly on pace. Seventeen miles later, I was 17 minutes ahead.
After an initial 3.5-mile downhill from the aid station, the course rolls for 8 miles along a bench high above the Dry Fork of the Bighorn River. There are countless dips, but overall the elevation stays constant. Bob and I ran all the flats and downs, and the easy ups. I’m sure that we both could have run everything, but Bob is also a conservative and experienced racer. On the return leg, we knew we wouldn’t be running steep or even moderate pitches — So why would we run them now and burn ourselves out?
I passed through Footbridge as quickly as Cow Camp (Mi 19.5) and Bear Camp (Mi 26.5). Refill a bottle, grab some calories, and go. But I should have grabbed the fleece shirt in my drop bag. I stashed it there because I figured I’d need it — not only would temperatures drop during the upcoming 4,000-foot climb to Jaws Trailhead, but the forecast called for increasing chance of precip in the afternoon and a higher chance of precip at higher elevations.
In hindsight, I gambled and lost. At the expense of 30 seconds and an extra 7 oz of weight, I could have been much more comfortable when the rain finally arrived, instead of trying to keep warm with just a singlet, rain shell, 6-inch shorts, liner gloves and a Buff.
Bob remained in the lead out of Footbridge, but relinquished it around Mi 40, saying he wasn’t feeling well and theorizing that the altitude was playing a role. I pushed on towards Spring Marsh, where I finally had to put on my rain jacket, and Elk Camp, where this story started.
Turnaround
Jaws Trailhead (Mi 48.0) is the turnaround for the out-and-back course and serves as the psychological halfway point. I wasn’t thrilled about leaving Elk Camp and climbing another 1,000 vertical feet to it, where it would be wetter, colder, and windier. But I couldn’t linger: the conditions were not improving and I was not getting warmer. The sooner I got to Jaws, the sooner I could begin descending again.
The five miles to Jaws were the wettest thus far. There were a few sections of shoe-sucking mud — notably through an aspen grove — but more often the ground was simply waterlogged. The trail was slick but not terrible — being the first through helped, as did the rockier topsoil and spruce/fir mulch.
As I closed in on Jaws, I became increasingly concerned about my core body temperature. From head to toe, I was either damp or soaked, due the steady rain, ground water splashing, and trapped perspiration in my rain shell. I knew that a delayed departure from Jaws was probably in my future — I would need to warm up before I could safely leave.
My split to Jaws was 8:24, an amazing 39 minutes ahead of goal pace. If I could stay on that trendline, I was looking at low- to mid-18 hours. The course record is held by Andrew Miller, in 18:29.
But that’s not what happened.
Instead, I spent the next 25 minutes inside a wall tent, changing into dry clothes, guzzling cups of hot broth, and enhancing my environmental defenses with the help of volunteers Steve and Marta. Steve graciously exchanged his rain jacket for mine, which had wet through; and Marta wrapped a space blanket around my waist, covered me in a disposable poncho, and inserted HotHands into my gloves. Without this assistance, my race may have ended at Jaws — I’m not sure I would have risked running back to Elk Camp in the condition in which I arrived.
Bob arrived 11 minutes after me, in 8:35. He was in equally rough shape: soaked through, shivering, and desperate for heat. He would linger for 25 minutes as well. (Interestingly, runners who arrived 30-60 minutes after us took much less time than we did, as if the conditions were less bad for them.)

After changing into dry clothes and drinking several cups of hot broth at Jaws, I created a more rain-resistant outfit using a space blanket and disposable poncho.
It’s not happening
As I vacated the comforts of Jaws in 8:49 elapsed (still 11 minutes ahead of goal pace), I thanked all the volunteers for their help and gave Marta a big hug. They deserved the praise, but needed it, too — if these conditions persisted, they would be nursing runners back to health all night.
My legs had tightened up during the break, but otherwise I felt like a new man. My outfit was impervious to the rain and sealed off from the cold. In fact, I was so comfortable that I began donating my layers to pitiful-looking runners who were on their way up. Where they were going, they would appreciate it.
The precip seemed to be letting up, now more of a drizzle than a rain. But the damage to the course was done. The additional foot traffic had churned the dirt and precip, creating a linear oil slick. On steep pitches, I would shoe-ski down the slope. On moderate grades, it was more of a stride-and-slide pattern. The flats were runnable, but stabilizing muscles were being worked hard.
As bad as I had it, I felt worse for runners in the middle and back of the pack. For me, the miles between Spring Marsh and Jaws were slow on the way up, and horrible on the way down. For them, it was all horrible — and climbing on mud is much worse than descending on it. Some wise hikers had trekking poles. I’m unsure how the others managed without them.
Just before I reached Spring Marsh (Mi 56), I took my first fall, when I looked up while on a steeper pitch. The subtle weight transfer was enough for my feet to slip from underneath me, and I crashed onto my back, thankfully with my running vest softening the blow. Not all runners were as fortunate — Andrew Jones-Wilkins was concussed when he knocked his head on a rock.
My enthusiasm for the race increasingly waned throughout the descent. First, I figured that the inbound 50 miles were at least 1-2 minutes slower per mile than under normal conditions, putting out of reach a course record (for me at least) and a fast finish more generally. Second, an all-out effort seemed dangerous under these conditions, with a high risk of a hard fall or soft tissue strain. And, third, it now felt like more of a sufferfest than a race — the only reward for soldiering on was so that you could say you didn’t quit.
Not surprisingly, Bob caught and passed my sorry-ass between Spring Marsh and Cathedral Rock (Mi 62.5), while I was stopped to get my headlamp from my pack. I no longer cared, and resumed my safety-first descent to Footbridge.
Despite everything, I had given up only a few minutes versus my intended pace. Recall, I left Jaws 11 minutes up. At Elk Camp, I was still 11 minutes up; Spring Marsh, 13 minutes up; Cathedral Rock, 8 minutes up; and at Footbridge (Mi 66), still 4 minutes up.
The wall
The third significant climb is between Footbridge and Bear Camp (Mi 69.5) — 2,300 vertical feet in about 3.5 miles. It’s always a hard section, hence its nickname, “The Wall,” but it was much worse with a coating of mud. Step up and pressure the foothold, slide back a little, step up with the other foot and pressure it, slide back again. Overhanging brush soaked with cold rain did not improve matters. In short, it was deflating.
But perhaps the more concerning development was that I suddenly felt exhausted — sleepy tired, not physically. As I stumbled up the climb, sometimes with my eyes shut, I pondered the causes: emotionally, I had checked out and was no longer as engaged; my blood sugar might be low from inadequate fueling on the descent; and it was now 11 PM, about an hour past my normal bedtime. I wondered, too, if the mild hypothermia from earlier was catching up with me.
“What can we get for you?” asked the volunteers at Bear Camp (Mi 69.5) when I finally arrived.
I’d been thinking about this for the past half-hour: “A chair by the fire, please. And wake me up in 15 minutes.”
Through the night
I awoke with the arrival of Eric and his pacer Casey, who had flown out from New Jersey. The fire felt lovely, but I knew this was my best opportunity to get moving again.
My head started coming back around, with increasing alertness and less drowsiness. I think that nap had actually helped. Our pace was deliberate but comfortable — we were running flats and downs, and hiking the ups, always cautiously. The additional company made it much more fun.
Just before we departed from Cow Camp (Mi 76.5) I asked about Bob, who I had written off 20 miles earlier.
“He’s sick as a dog,” commented one volunteer. “We couldn’t get any food into him, and the only reason he left was because he saw your lights on the ridge.”
That was not the response I had expected, since Bob had looked so strong earlier. But ultras are unpredictable, usually in a negative way, and I always knew it was a possibility.
Eric said he needed a few more minutes at the aid, and encouraged me to chase down Bob on my own. That proved easy to do: when I caught up to him about a mile out, he was moving very slowly and seemed to be shutting down. I offered what was in my pack, but he was beyond help.
The jeep track between Cow Camp and Dry Fork Ridge was heinously slick. All of it should have been runnable, but none of it was. Adding to the joy: resuming of steady rainfall. Over these six miles we lost 24 minutes to my wished-for pace, despite an earnest effort.
Bringing it home
My Negative Nelly-ism had infected Eric, and he signed on to my proposal for a comfortable, cautious, and injury-free effort to the finish, where we would cross together.
While we took our sweet time, at least two other racers gained on us. Alex Ho caught us just before Upper Sheep Creek (Mi 87.5), and joined our party. And Brian Oestrike (with his pacer) caught our trio at the Tongue River Trailhead, from where it’s five miles of gravel to the finish. After a few minutes of uncertainty, Brian joined our truce.
For the first time in over fifty miles, the gravel road offered consistent traction. But we jokingly wished that it was the Bighorn 95 — we would have gladly done without this section.
For those watching the race online, via the confusing ITS Your Race platform, the final results were difficult to decipher. It looked as if four runners had sprinted to the line, finishing within a second of each other after 100 miles. In fact, we all finished together, holding hands, in a four-way tie for first. Indeed, misery is more fun with company.

The four first-place finishers, very glad to be done.
The post Bighorn 100 Race Report || 1st place in 4-way tie, 21:30:08 appeared first on Andrew Skurka.
June 15, 2017
Bighorn 100 Trail Run: Track me live as I race 100 miles on Friday
The Bighorn 100 Trail Run begins at 10 AM Mountain Time on Friday, June 16. If you’re interested, there will be live tracking from the three major checkpoints: Dry Fork, Footbridge, and Jaws.
Use these links:
Quick results: Last check-in
Detailed results: All splits
The links should take you directly to the 2017 race and the 100M distance, but you might have to filter the results again if you start wandering around.
I’m hoping to finish in the 19-hour range; my pace chart is for 19:30. I tend to race conservatively, with relatively slow starts and strong finishes. It can be exciting to watch if the body cooperates.
My estimated ETA at each checkpoint:
Outbound
Dry Fork: 12:24:22 PM
Footbridge: 3:04:42 PM
Jaws: 7:02:52 PM
Inbound:
Footbridge: 10:37:19 PM
Dry Fork: 2:27:41 AM
Finish: 5:30:00 AM

The post Bighorn 100 Trail Run: Track me live as I race 100 miles on Friday appeared first on Andrew Skurka.


