
Nate Silver's Blog, page 55
December 23, 2019


December 16, 2019
Politics Podcast: Do Voters’ Second Choices Matter In The Democratic Primary?
More: Apple Podcasts |
ESPN App |
RSS
| Embed
Embed Code
As candidates in the Democratic primary drop out or fail to earn in caucuses, voters’ second choices will come into play and potentially shape the dynamics of the race. In this installment of the FiveThirtyEight Politics podcast, the crew discusses how voters are settling on their second choices and what impact they could have. The team also previews what is to come in this week’s likely impeachment vote in the House.
You can listen to the episode by clicking the “play” button in the audio player above or by downloading it in iTunes , the ESPN App or your favorite podcast platform. If you are new to podcasts, learn how to listen .
The FiveThirtyEight Politics podcast publishes Monday evenings, with additional episodes throughout the week. Help new listeners discover the show by leaving us a rating and review on iTunes . Have a comment, question or suggestion for “good polling vs. bad polling”? Get in touch by email, on Twitter or in the comments.
December 13, 2019
Our 2020 Democratic Primary Polling Averages
UPDATED DEC. 13, 2019 AT 11:50 AM
Latest PollsUpdated throughout the day.
POLL TYPE
All pollsPresidential approvalGeneric ballotPresident: general electionU.S. SenatePresident: Democratic primaryU.S. HouseGovernorPresident: Republican primary
STATE
All National Alabama Alaska Arizona Arkansas California Colorado Connecticut Delaware District of Columbia Florida Georgia Hawaii Idaho Illinois Indiana Iowa Kansas Kentucky Louisiana Maine Maryland Massachusetts Michigan Minnesota Mississippi Missouri Montana Nebraska Nevada New Hampshire New Jersey New Mexico New York North Carolina North Dakota Ohio Oklahoma Oregon Pennsylvania Rhode Island South Carolina South Dakota Tennessee Texas Utah Vermont Virginia Washington West Virginia Wisconsin Wyoming
DISTRICT
All Who’s ahead in the national polls?
Updating average for each Democratic candidate in 2020 primary polls, accounting for each poll’s quality, sample size and recency
APRIL 2019MAYJUNEJULYAUG.SEPT.OCT.NOV.DEC.01020304050%DEC. 13 LEADERDEC. 13 LEADERBidenBiden26.2%BidenWarrenSandersButtigieg
Average as of Dec. 13
ACTIVE CANDIDATES
Biden26.2%
Sanders17.0%
Warren14.9%
Buttigieg9.6%
Bloomberg4.7%
Yang3.4%
Klobuchar2.2%
Booker1.7%
Steyer1.4%
Gabbard1.4%
Castro1.0%
Patrick0.6%
Bennet0.6%
Delaney0.5%
Williamson0.5%
DROPOUTS
Bullock—
de Blasio—
Gillibrand—
Gravel—
Harris—
Hickenlooper—
Inslee—
Moulton—
O’Rourke—
Ryan—
Sestak—
Swalwell—
Our average includes all candidates that FiveThirtyEight considers “major.” Candidates with insufficient polling data are not displayed in the averages. State polling averages are adjusted based on national trends, which means candidates’ averages can shift even in the absence of fresh state polls. Read more about the methodology.
FILTER BY POLLSTER GRADE
A+BCDAdded Dec. 11, 2019
DATES
POLLSTER
SAMPLE
RESULT
NET RESULT
President: Democratic primary
DEC 7-10, 2019
B-YouGov
497
LV
Biden
26%
More
Biden
+5
President: Democratic primary
NOV 25-DEC 1, 2019
David Binder Research
1,200
LV
Biden
29%
More
Biden
+14
KEY
A = ADULTS
RV = REGISTERED VOTERS
V = VOTERS
LV = LIKELY VOTERS
Dec. 10, 2019
President: Democratic primary
DEC 4-9, 2019
B+Quinnipiac University
665
RV
Biden
29%
More
Biden
+12
President: Democratic primary
DEC 4-8, 2019
A+Monmouth University
384
RV
Biden
26%
More
Biden
+5
Dec. 9, 2019
President: Democratic primary
DEC 2-8, 2019
B/CMorning Consult
15,442
LV
Biden
30%
More
Biden
+8
President: Democratic primary
NOV 27-29, 2019
C+Harris Poll
756
RV
H. Clinton
21%
More
H. Clinton
+1
President: Democratic primary
NOV 15-21, 2019
B/CRealClear Opinion Research
987
LV
Biden
30%
More
Biden
+7
Dec. 6, 2019
President: Democratic primary
NOV 27-29, 2019
C+Harris Poll
756
RV
Biden
29%
More
Biden
+13
Dec. 5, 2019
President: Democratic primary
DEC 4-5, 2019
B-Ipsos
719
A
Biden
19%
More
Biden
+5
Show more polls
Polls conducted after June 28, 2018, the date this page was published, are listed by the date that FiveThirtyEight collected them; polls conducted before then are listed under the last date that the poll was in the field. Polls from firms that are banned by FiveThirtyEight are not shown. Pollsters that did not release any horse-race polls within three weeks of an election since 1998 do not have a grade and are treated as a C+ by the grade filter.
* Polls marked with an asterisk are partisan polls. Partisanship is determined by who sponsors the poll, rather than who conducts it. Polls are considered partisan if they’re conducted on behalf of a candidate, party, campaign committee, or PAC, super PAC, 501(c)(4), 501(c)(5) or 501(c)(6) organization that conducts a large majority of its political activity on behalf of one political party.
Notice any bugs or missing polls? Send us an email.
Download this data: presidential primary polls, presidential general election polls, Senate polls, House polls, gubernatorial polls, presidential approval polls, generic congressional ballot polls
Design and development by Aaron Bycoffe, Ritchie King, Ella Koeze, Dhrumil Mehta, Jasmine Mithani and Julia Wolfe. Andrea Jones-Rooy, Dhrumil Mehta, Nathaniel Rakich, Derek Shan and Julia Wolfe contributed research.
MORE POLITICS
How Popular Is Donald Trump?
How Often Do Members Of Congress Vote With Trump?
Who Is Winning The Race For Congress?
The 2020 Endorsement Primary
Pollster Ratings
RELATED STORIES
What Makes Our New 2020 Democratic Primary Polling Averages Different The Democratic Presidential Candidates Are Becoming Less Popular Seven Candidates Have Qualified For The December Democratic Debate Which Senators Are Likely To Vote For Trump’s Removal? Why It’s Tougher To Qualify For The December Democratic Debate
COMMENTS
Get more FiveThirtyEight
Newsletter
Videos
Podcasts
Data
RSS
Contact
Jobs
Masthead
About Nielsen Measurement
Terms of Use
Privacy Policy
Your California Privacy Rights
Children’s Online Privacy Policy
Interest-Based Ads
© 2018 ABC News Internet Ventures. All rights reserved.
What Makes Our New 2020 Democratic Primary Polling Averages Different
Does the world really need another polling average?
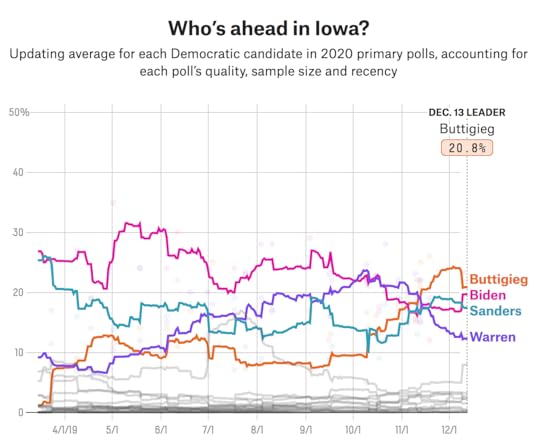
Well, sure. Actually, we think having a variety of polling averages matters a lot in the presidential primaries — and the one you look at can change how you view the race. So we’ve just launched our national polling average for the 2020 Democratic primary, as well as one for every state where there’s an adequate amount of polling. Here’s Iowa, for instance:
Here’s South Carolina:
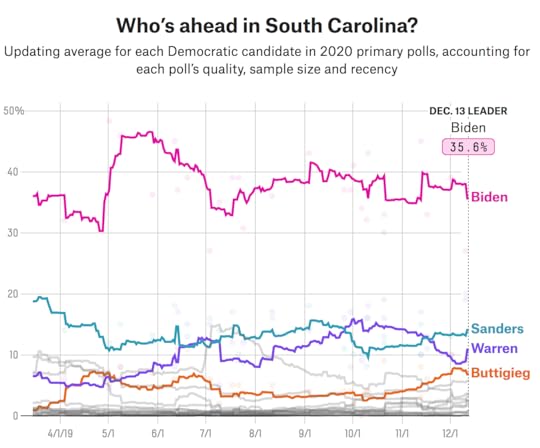
Here’s Nevada. Here’s California. We’d encourage you to click around a bit and then come back here once you’ve gotten a sense for how the numbers look.
Constructing a polling average is never quite so straightforward as it seems, but that’s doubly true in a primary campaign. Since turnout is relatively low compared to a general election, polls can differ a lot from one another given their assumptions about who’s going to vote. Public opinion can change quickly during the primaries; unlike in the general election, where the large majority of voters can reliably be expected to vote for one party or the other, primary voters are usually considering multiple candidates, so the overall process is a lot more fluid. Having a polling average that moves too slowly can be a big problem, as can having one that overreacts to every new poll. The pace of polling can be irregular — sometimes you’ll get several high-quality polls in a day, and sometimes you’ll go a couple of weeks without any. All of these factors make the methodological choices behind a polling average more important.

So here’s a description of our version of a polling average: a relatively brief overview of the features that make FiveThirtyEight’s primary polling averages different (and, we hope, slightly more accurate) than the alternatives. I’m keeping this relatively brief for two reasons: First, none of this differs that much from the polling averages we’ve constructed in the past for general elections, and second, these polling averages will soon be followed by our full-fledged primary forecast, which uses these averages as an “ingredient” but also considers a host of other factors. We’ll save the discussion of the forecast for later, though. For now, listed in rough order of how much they can affect our averages, here are the five key things that make our polling averages a little different:
Differentiator 1: We adjust state polls based on trends in national polls
A hallmark of our general election forecasts, dating all the way back to our first versions in 2008, is what we call a “trend line adjustment.” Basically, in states that haven’t been polled recently, we make inferences about what’s going on there using national polls or polls from other states that have been surveyed recently. If President Trump gained 3 percentage points in national polls, for instance, but North Carolina hadn’t been polled recently, you could probably infer that he’d also gained 3 points, or thereabouts, in North Carolina.
We apply this adjustment for a good reason: Trend-line-adjusted averages have been quite a bit more accurate, historically. That is, once someone does get around to polling North Carolina, it usually turns out that Trump did gain about 3 points. Trend-line-adjusted averages have also been insightful so far this cycle — they anticipated, for instance, that Sen. Elizabeth Warren’s numbers would decline in state polls in November and early December once she began to slump in national polls.
So we’re now applying a slightly simplified version1 of the trend line adjustment to the primaries. (Note that all polling averages you see on our state polling pages reflect this trend line adjustment.) Say that Sen. Cory Booker has surged by 5 points in national polls, for instance, but we haven’t seen a recent poll in Nevada. Our average would assume that he’d also improved his standing by 5 points in Nevada, other things held equal.
There are a few complications: For instance, the adjustment is nonlinear, which can have meaningful effects if a candidate is polling in the low single digits. But in short, the trend line adjustment can have fairly large effects if a state hasn’t been polled much recently. It doesn’t affect our numbers much, conversely, if there are a lot of recent, high-quality polls from that state.
Differentiator 2: We adjust for house effects
“House effects” are when certain pollsters consistently show better results for certain candidates. Emerson College, for instance, has usually shown optimistic results for Sen. Bernie Sanders in polls it has published so far in the primary campaign, while Morning Consult’s polls tend to have pretty good numbers for former Vice President Joe Biden.
All of FiveThirtyEight’s general election polling averages adjust for house effects, and we’re now doing the same for our primary averages. In fact, we found that the house effects adjustments we’ve used in the past were slightly too consevative for the primaries, so they’ll be a bit more aggressive this year.2
House effects are calculated for each candidate separately. So, for instance, Morning Consult has a Biden house effect adjustment, a Pete Buttigieg adjustment, a Tom Steyer adjustment, and so on. National polls can influence the house effects adjustment in the states and vice versa, and polling in one state can influence the house effects adjustment in other states.
Differentiator 3: Our average adjusts more quickly after major events
We’ve long recommended that you should consider news events when determining whether a polling shift is signal or noise. If Trump literally did shoot someone on Fifth Avenue, or the Martians invaded Washington and he valiantly fought them off, it wouldn’t be surprising if there were a sharp shift in his approval rating. Conversely, if we were in the midst of a boring news cycle where nothing much was happening, a poll showing a big swing in his numbers would be more likely to be an outlier.
We’re now applying this sort of logic to our primary polling average, though in a much more formal and rigorous way. While we aren’t expecting a Martian invasion, there are certain types of events in the primaries that predictably can have large effects on the polls (i.e. they have historically). Specifically, these include, in order of importance:
The outcomes of primaries and caucuses (e.g. a candidate can get a bounce after Iowa or Super Tuesday)
Major candidates entering or exiting the race
Debates
Following these three types of events, our polling average will be more aggressive about deeming swings in the polling average to be signal rather than noise. As a corollary, it will be less aggressive when there are apparent polling shifts that aren’t precipitated by one of these events. We’ll revisit this in future articles, but note that the importance the model assigns to events works on a sliding scale. No offense to our Guamanian readers, for instance, but, historically, Iowa or Super Tuesday tends to move the polls a lot more than the Guam caucus — and our averages reflect this.
Differentiator 4: We’ve carefully set our average so it doesn’t move too fast or too slow
Over the years, we’ve found that there’s no particular default set of assumptions that will give you a good polling average in every circumstance. Applying the aggressive settings from our presidential approval rating average to our generic ballot tracker makes the generic ballot much too “bouncy,” for instance. (We learned that one the hard way.) Conversely, applying the conservative settings from our generic ballot tracker would make our presidential approval rating average too sluggish to pick up on real swings in Trump’s numbers.
So we think the only good way to determine the “right” settings for a polling average is to do it empirically. There are a couple of ways that you could do this:
You can tune the settings so that they optimally predict future polls. That is, if our approval rating average has Trump at 42 percent, that means 42 percent is our best guess for what a new Trump approval rating poll would say.
Highly related to the above, you can tune the settings to minimize autocorrelation. That is to say, the current polling average should reflect all information about the current state of the polls and your average shouldn’t predictably move upward or downward from that point in time. For example, if Sanders improves from 15 percent to 17 percent in your polling average, he should be equally likely to continue gaining ground (improve beyond 17 percent) or to revert to where he was before (decline from 17 percent) in future editions of your polling average.
For polling sequences that culminate in an election, like the New Hampshire primary poll average, you can test how accurately the polling average predicts the eventual election result.
The settings we chose for our primary polling averages are designed to optimize these qualities based on our historical database of primary polls since 1972. In general, it’s appropriate to apply relatively aggressive settings in the primaries as compared to the general election, as the former tend to be much more dynamic than the latter due to the lack of partisan guardrails.
I’ll refrain (for now) from going into more detail on exactly what these parameters are and how we’ve set them. (There are actually quite a few parameters, ranging from how you trade off recency versus having a larger sample of polls to which kernel density function to apply.) As a matter of practice, though, the FiveThirtyEight polling average represents something of a compromise between the RealClearPolitics approach of averaging recent polls and The Economist’s technique of drawing a trend line.
Differentiator 5: We use objective criteria to decide which polls to include
For many reasons, we prefer to avoid having to make any ad hoc decisions about which polls to include in our average. So our approach has always been to include almost all polls but to weight them based on our pollster ratings (which in turn reflect a combination of how accurate the pollster has been historically and the methodology it uses) and the polls’ sample size. We’re applying this long-standing process to our primary polling averages as well.
Note that I said “almost all polls” rather than “all polls” because there are some rare exceptions. We don’t include polls from firms that are banned by FiveThirtyEight because we suspect them of having faked data. And for the primaries, we won’t be including internal polls that are released to the public by one of the campaigns,3 or surveys that test super hypothetical matchups, such as a head-to-head poll conducted when more than two candidates are still running.
And that’s about it. Again, we’ll have much more detail on some of this when we launch our forecast. But in the meantime, please go click around and see how the race looks nationally and in the various states. Is Buttigieg losing steam in surveys of Iowa? Has Warren arrested her decline in national polls? Now you can decide for yourself.
December 9, 2019
Politics Podcast: The Democratic Primary, According To The Early States
More: Apple Podcasts |
ESPN App |
RSS
| Embed
Embed Code
In this installment of the FiveThirtyEight Politics podcast, the crew previews the official FiveThirtyEight polling averages for the 2020 Democratic primary, including how the race looks nationally and in the early states. Vice President Joe Biden and Sen. Bernie Sanders have both been incredibly steady in the polls, while Sen. Elizabeth Warren and Mayor Pete Buttigieg have moved in opposite directions. The team also looks back at the “14 Versions Of Trump’s Presidency, From #MAGA To Impeachment” in order to gauge how President Trump’s tenure is going.
You can listen to the episode by clicking the “play” button in the audio player above or by downloading it in iTunes , the ESPN App or your favorite podcast platform. If you are new to podcasts, learn how to listen .
The FiveThirtyEight Politics podcast publishes Monday evenings, with additional episodes throughout the week. Help new listeners discover the show by leaving us a rating and review on iTunes . Have a comment, question or suggestion for “good polling vs. bad polling”? Get in touch by email, on Twitter or in the comments.
December 3, 2019
Politics Podcast: Why Harris Dropped Out
By Galen Druke, Clare Malone, Nate Silver and Micah Cohen, Galen Druke, Clare Malone, Nate Silver and Micah Cohen, Galen Druke, Clare Malone, Nate Silver and Micah Cohen and Galen Druke, Clare Malone, Nate Silver and Micah Cohen
More: Apple Podcasts |
ESPN App |
RSS
| Embed
Embed Code
After an initially promising bid, California Sen. Kamala Harris dropped out of the Democratic presidential primary race Tuesday. In this installment of the FiveThirtyEight Politics podcast, the crew assesses why she stumbled in the polls and dropped out relatively early.
You can listen to the episode by clicking the “play” button in the audio player above or by downloading it in iTunes , the ESPN App or your favorite podcast platform. If you are new to podcasts, learn how to listen .
The FiveThirtyEight Politics podcast publishes Monday evenings, with additional episodes throughout the week. Help new listeners discover the show by leaving us a rating and review on iTunes . Have a comment, question or suggestion for “good polling vs. bad polling”? Get in touch by email, on Twitter or in the comments.
December 2, 2019
Politics Podcast: Is The Party Deciding?
More: Apple Podcasts |
ESPN App |
RSS
| Embed
Embed Code
With Thanksgiving behind us, it’s time to dive back into the two big political stories of the fall: the House impeachment inquiry and the race for the Democratic presidential nomination. In this installment of the FiveThirtyEight Politics podcast, the team gives an update on where public opinion stands on impeachment and what to expect from the inquiry in the coming days.
Also, the crew checks in on the race for endorsements in the Democratic primary, where former Vice President Joe Biden has recently picked up some steam.
Finally, the team looks at what happened to Sen. Kamala Harris’s campaign.
You can listen to the episode by clicking the “play” button in the audio player above or by downloading it in iTunes , the ESPN App or your favorite podcast platform. If you are new to podcasts, learn how to listen .
The FiveThirtyEight Politics podcast publishes Monday evenings, with additional episodes throughout the week. Help new listeners discover the show by leaving us a rating and review on iTunes . Have a comment, question or suggestion for “good polling vs. bad polling”? Get in touch by email, on Twitter or in the comments.
Nate Silver's Blog

- Nate Silver's profile
- 730 followers

