
Nate Silver's Blog, page 53
February 3, 2020
Politics Podcast: What To Expect From The Iowa Caucuses
More: Apple Podcasts |
ESPN App |
RSS
| Embed
Embed Code
It’s finally time for the Iowa caucuses! In this installment of the FiveThirtyEight Politics podcast’s “Model Talk,” Nate Silver discusses the latest data and what unknowns could still lead to a surprise result.
You can listen to the episode by clicking the “play” button in the audio player above or by downloading it in iTunes , the ESPN App or your favorite podcast platform. If you are new to podcasts, learn how to listen .
The FiveThirtyEight Politics podcast publishes Mondays and Thursdays. Help new listeners discover the show by leaving us a rating and review on iTunes . Have a comment, question or suggestion for “good polling vs. bad polling”? Get in touch by email, on Twitter or in the comments.


How Iowa’s Three Different Votes Could Affect Who ‘Wins’
If you’re an electoral politics junkie, you may have already read something about how Iowa could actually produce three different winners (!) on Monday night. What the heck does that actually mean? Let me explain — while also giving you some insight into how our forecast model handles these different versions of the vote count, and which candidates might benefit in one count versus another.
[Our Latest Forecast: Who will win the Iowa caucuses?]
The Iowa caucuses work by voters entering a caucus site such as a high school gymnasium at 7 p.m. and physically forming preference groups — all the Elizabeth Warren supporters stand in one corner of the room, and all the Joe Biden supporters in another, for instance. Voters may also join an uncommitted group.1
This is called the first alignment of voter preferences — and for the first time this year, Iowa Democrats will count and record how voters are aligned at this stage of the process. Thus, the first alignment is the first of the three ways that the caucus vote will be reported. It’s the most straightforward metric of candidate support, and it’s the closest that the Iowa caucuses come to the voting as it will take place in most other states, where voters get just one choice and there are none of the complicated rules that I’ll describe in a moment.2
Iowa’s process doesn’t stop there, however. Voters in candidate groups that fail to meet a viability threshold in the first alignment — typically 15 percent of the vote, but it can be higher in smaller precincts — have one of three choices:
They can join a viable group.
They can try to combine with voters in other nonviable groups to achieve viability. For example, if the Warren group initially has 14 percent of the vote, it’s not necessarily dead in the water. Rather, it could recruit a few Tom Steyer voters, or a Michael Bennet supporter, etc., to get to 15 percent. It can’t recruit voters from groups that already achieved viability, however. Once a group is viable, it can continue to add new voters and grow larger, but it can’t lose them.
Or they could just go home. Nothing forces them to participate in further rounds of caucusing.
The vote count after this stage goes by several names, but I’ll call it the final alignment. It’s the second of the three ways that Iowa will report its vote. And it has a lot of things going for it. Since only candidates who get at least 15 percent of the vote are eligible for delegates to the Democratic National Convention, it makes sense to give voters who initially choose a candidate who can’t get 15 percent a chance to express a preference for a candidate who does. And the realignment process is a highly traditional and distinctive part of the caucuses that the candidates plan around.
Are The Iowa Caucuses A Two-Way Race?
Incidentally, the final alignment is the version of the vote count that our model simulates. When we say that Bernie Sanders’s projected share of the vote runs between 13 and 43 percent, that’s a projection of his final alignment vote.
But the model does make a few simplifications. For instance, because the process of simulating realignment is somewhat computationally intensive, we calculate it for 80 hypothetical caucus sites of various sizes — 20 in each congressional district — rather than the full contingent of roughly 1,700 precincts that will caucus on Monday. And to estimate how widely initial preferences might vary from precinct to precinct, we used the precinct-by-precinct vote from the Republican caucuses in 2016 as our guide.3 Incidentally, you should expect there to be quite a bit of variation in the vote from precinct to precinct, especially given that most precincts are fairly small. If Warren is at 15 percent of the vote districtwide, she’ll have some precincts where she’s at 25 percent of the vote or more and others where she has very few votes. There is not necessarily a bright line at 15 percent exactly.
In simulating the process, we assume that voters make decisions in order of the smallest nonviable group to the largest. (Essentially, this is the equivalent of tabulating votes under ranked choice voting.) If Bennet has 1 percent of the vote for example and is the smallest group in a particular precinct, his voters will be assigned to other candidates first. The process continues until all groups either become viable or have their voters reassigned.4
I’ve skipped over a rather important detail, however. How does the model decide which voters realign to which groups? This is based on a combination of three factors:
Larger groups are assumed to be more capable of attracting new supporters, other things being equal.
Whether the group was initially viable matters. If a group was not viable at first, it may be at risk of losing members to other groups at the same time it is trying to recruit its own new members. So the model hedges its bets. In some simulations, supporters of nonviable candidates may be willing to join with other nonviable candidates in an effort to achieve viability. Other times, they’ll resist this.
Finally, we use a proximity rating, which estimates how far apart the candidates are from one another along ideological and other dimensions. For instance, Sanders supporters are assumed to be somewhat more likely to go to Warren than the other major candidates and vice versa. And Biden voters are assumed to be fairly close to Amy Klobuchar voters and to be more likely to prefer one another as a second choice.
None of this is ideal — there’s a lot of guesswork involved. Second choices for unconventional candidates such as Andrew Yang aren’t easy to capture under this method, for instance. (All of the data that Iowa publishes this year should hopefully make things easier in 2024.) Nonetheless, our method does a pretty good job of replicating polls that show voters’ second choices. Note that our assumptions aren’t terribly aggressive, either. For instance, if a group of Warren voters is trying to decide between Sanders and Biden, the model would have them going about 3:2 to Sanders, but not in a more lopsided ratio than that.
As you can probably infer from the above, this yields some fairly complicated patterns as far as second choices go:
Sanders isn’t a natural second choice for any of the moderates (Biden, Klobuchar or Pete Buttigieg). But he is a good second choice for Warren voters, and Warren may be under 15 percent in many precincts.
Biden’s case is somewhat parallel to Sanders’s, except with Klobuchar serving in the role of Warren. If Klobuchar stays under 15 percent in most precincts, Biden is an obvious second choice for her voters. But a Klobuchar surge could hurt him.
Buttigieg tends to pick up a lot of second-choice support both in polls and in our model, and to draw it from a fairly wide-ranging group of candidates. This is because he’s sort of in the middle of the spectrum: more progressive than Biden and arguably Klobuchar, but less so than Warren and Sanders.
Warren often polls well as a second choice. However, much of her second-choice support comes from Sanders supporters, and Sanders figures to be above 15 percent in most precincts. So while there’s an upside case for Warren if Sanders underperforms his polls, his recent surge has hurt her. Still, she is also a somewhat logical landing spot for Klobuchar and Buttigieg supporters as all three candidates overperform among college-educated voters.
Klobuchar, like Buttigieg, could theoretically be a logical second choice for supporters of several other candidates. However, she’ll need to beat her polls to do so, as her current position in our Iowa polling average (10 percent) will have her under the viability threshold in many precincts.
Acknowledging that our model has to make a lot of educated guesses about voter behavior, let’s look at some of its predictions. First, here’s a comparison between the first alignment and the final alignment for each candidate, averaged across 10,000 simulations from a model run late Sunday night:
How Iowa’s votes could change from one stage to the next
Average FiveThirtyEight model Iowa caucus first alignment and final alignment projections, as of Feb. 2, 2020
Candidate
First Alignment
Final Alignment
Change
Sanders
23.6%
28.1%
4.5
Biden
22.5
26.4
3.9
Buttigieg
16.5
17.9
1.4
Warren
15.7
15.9
0.2
Klobuchar
10.8
8.8
-2.0
Yang
4.0
1.4
-2.6
Steyer
3.8
1.3
-2.5
Bloomberg
1.3
0.1
-1.2
Gabbard
1.2
0.0
-1.2
Bennet
0.5
0.0
-0.5
Patrick
0.2
0.0
-0.2
As you can see, the topline effects of realignment are fairly simple. Candidates comfortably above 15 percent tend to gain votes and see their leads grow — for instance, Sanders’s share of the vote grows from 23.6 percent (first alignment) to 28.1 percent (final alignment) in our projections. Candidates near 15 percent tend to tread water. And candidates well under 15 percent can lose the large majority of their vote, perhaps almost all of it, to other candidates.
With that said, these topline effects conceal a range of possible outcomes. For a taste of this, here is a chart showing how Buttigieg’s final alignment is projected to turn out given various levels of first alignment vote:
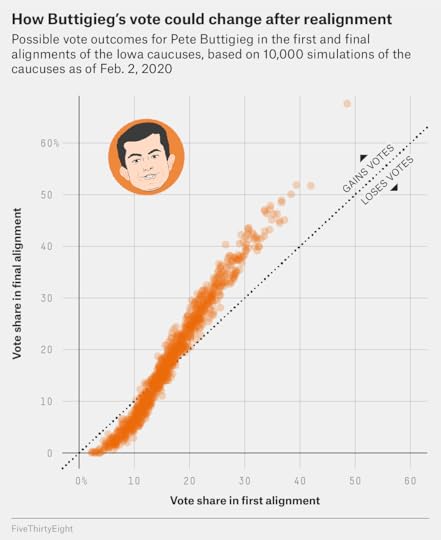
If Buttgiieg’s first alignment vote is in the single digits or the low teens, then realignment will hurt him. But if he gets around 20 percent of the vote in the first alignment, he’s projected to wind up with an average of somewhere around 24 or 25 percent of the vote in the final alignment. That’s actually a fairly big gain. It’s slightly better than Sanders, for instance, who would be projected to get closer to 23 percent of the final alignment vote with 20 percent of the first alignment vote:
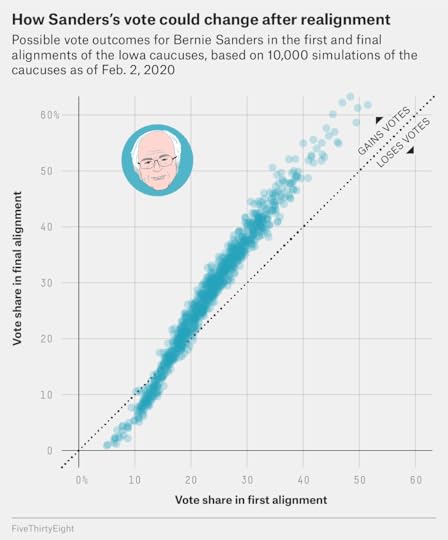
Granted, these are not exactly huge differences — 23 percent as compared with 24 or 25 percent. But an extra percentage point or two added or lost as the result of the realignment process could make the difference in a race where the top four candidates remain fairly closely bunched together. Moreover, our model’s assumptions about who might be helped or hurt by realignment may be too conservative. Having well-trained precinct captains can help a candidate in the realignment process a lot, and there’s also the possibility of strategic alliances between the candidates. Klobuchar and Buttigieg, for example, could agree to try to send their caucusgoers toward one another in precincts where they hadn’t achieved viability. The one thing you probably don’t want to do is enter into an alliance with one of the front-runners.
This isn’t the final stage, though. Instead, the final alignment is translated into something called state delegate equivalents, which is the third way that Iowa counts its vote. Until this year, in fact, this was the only way that Iowa counted its vote. It comes from a now archaic process where the caucuses technically served to elect delegates to county conventions, which in turn elected delegates to district conventions and the state convention, which in turn elected delegates to the Democratic National Convention.
This process is no longer used — delegates to the DNC will be elected based on caucus night results. However, state delegate equivalents are still used to determine essentially how much weight each precinct gets in determining DNC delegates.
The catch is that these weights are based on the number of votes that Hillary Clinton got in the general election in 2016 and that Democratic gubernatorial candidate Fred Hubbell got in the 2018 general election. And this can create some distortions. General election turnout is much higher than caucus turnout; 630,000 Iowans voted for Hubbell in 2018 and 650,000 did for Clinton in the general election in 2016. By comparison, 172,000 Democrats participated in the 2016 caucuses. Additionally, a higher share of caucus turnout tends to come from more liberal, upscale, urban and suburban counties and/or counties with colleges and universities, and proportionately less of it from rural counties.
Essentially, then, rural votes are likely to give candidates more bang for the buck in terms of state delegate equivalents. Candidates whose voters are mostly concentrated in liberal, highly populous counties are liable to underperform, conversely. There are various estimates out there as to who this is liable to help or hurt. But my read on the evidence is that Warren and to a lesser extent Sanders are likely to be hurt by it. Warren’s vote is mostly concentrated in upscale suburbs, and Sanders is hoping for big turnout surges in counties with a lot of young voters. Conversely, Klobuchar and Buttigieg have put a lot of emphasis on covering Iowa’s entire map and could benefit from this process. So could Biden, whose voters should be older, more working-class and more rural. To repeat, none of this is reflected in our model, which stops at the final alignment stage.5
But despite being somewhat convoluted — and do Democrats really want to give more weight to rural areas given the party’s complaints about the non-representativeness of the U.S. Senate and the Electoral College? — state delegate equivalents are likely to get a fair amount of attention on election night. It’s the metric that the various networks and news agencies are used to using to declare winners. And it is technically the measure that is used to determine delegates to the Democratic National Convention, although the importance of Iowa comes from the momentum it produces rather than the number of delegates it has.
As you can probably infer, we personally don’t buy that state delegate equivalents is necessarily a superior measure to the other two. So we intend to refer to all three metrics fairly often in our coverage of the caucuses on Monday night.
We can’t control what the rest of the media does, though, and the media will probably still lean into state delegate equivalents fairly heavily. Knowing how the media covers the race is important to being able to project the bounce that Iowa may be expected to produce for candidates who perform well there.
So in predicting the bounce that each candidate will receive, our model will essentially make a compromise. Bounces are projected based both on the share of the vote each candidate gets, and a binary variable indicating whether he or she won the state. For the vote share part of the calculation in Iowa, the model will use state delegate equivalents. But the winner bonus will be split, if necessary, between the three different measures, reflecting the fact that different candidates may have reasonable competing claims to victory.
[Our Latest Forecast: Who Will Win The 2020 Democratic Primary?]
In any event, a disputed or ambiguous outcome in Iowa is likely to dampen the bounces that candidates get out of Iowa, especially given that the media’s attention span may be limited by the State of the Union on Tuesday and the conclusion to President Trump’s impeachment trial later this week. So every candidate’s goal in Iowa should be not just to win, but to win clearly enough that they sweep all three metrics.
January 30, 2020
The Iowa Caucuses Are In 4 Days. Almost Anything Could Still Happen.
As much as we try to remind you all about how uncertain elections can be — pleas that sometimes fall on deaf ears — it’s important to keep in mind in advance of the Iowa caucuses. To begin with, primaries are much harder to poll than general elections, and caucuses are even harder to poll than primaries, as they introduce a number of complications. Caucuses require a long time commitment, which can make turnout harder to predict. They aren’t a secret ballot, so voters can literally try to persuade their neighbors to change sides. And Iowa Democrats employ a viability check — we’ll talk about that more before the caucuses on Monday — that asks voters to switch candidates if their first choice doesn’t clear a certain threshold, usually 15 percent of the vote at that caucus site. That makes second choices important, and even opens up the possibility of strategic alliances between the candidates.
Could Sanders Sweep Iowa And New Hampshire?
So even though Bernie Sanders and Joe Biden are doing a bit better than other Democrats in Iowa polls, everyone would need a bit of luck to win the caucuses. Per our model, as of 8 p.m. Wednesday, Sanders had a 37 percent chance of winning the most votes1 — which is the best in the field. But it also means there’s a 63 percent chance he won’t win. Our model forecasts Biden to win 35 percent of the time, meanwhile, followed by Pete Buttigieg at 16 percent, Elizabeth Warren at 9 percent and Amy Klobuchar at 3 percent. Even Klobuchar isn’t that much of a long shot. Her chances are about the same as — let’s go with a football analogy since the Super Bowl is this weekend — Brett Favre’s chance of throwing an interception on any given pass attempt.
[Our Latest Forecast: Who Will Win The 2020 Democratic Primary?]
Moreover, the plausible range of vote shares for the candidates varies widely. For Sanders, for instance, the 80th percentile range — meaning that in 80 percent of simulations, his numbers wind up somewhere in this range — runs from 11 percent to 44 percent of the vote. That also implies there’s a 10 percent chance he finishes with less than 11 percent of the vote and a 10 percent chance he finishes with more than 44 percent.
These ranges will narrow slightly by the time we actually get to caucus day on Monday. And our model will be more confident once we get to states that hold primaries, because those are easier to poll.
But the reason for these wide ranges is not to cover our asses. Instead, it’s strictly empirical. Take a look at what polls said a few days before previous Iowa caucuses and you’ll find they were sometimes much less correlated with the results than you might assume. Instead, there was often late movement, election night surprises, or both.
More precisely, I ran retroactive versions of our polling averages for all Iowa caucuses dating back to 1988, excluding the 1992 Democratic nomination, where the other candidates essentially ceded the caucuses to Iowa U.S. Senator Tom Harkin. (Before 1988, polling of the caucuses was fairly sparse, so we can’t really calculate a polling average in the same way that we do today — although there were a number of upsets, like George H.W. Bush coming from way behind to beat Ronald Reagan there in 1980.) I’ll compare what the polls looked like after allocating undecided voters2 as of 12:01 a.m. four days before the caucuses — so as of just after midnight on Thursday in years where the caucuses were held on a Monday, for example — against the actual caucus results.3
You can find all of this data in a table at the end of this article. But just to show how frequent surprises are — really, it’s a surprise when there isn’t a surprise or two! — let me briefly run through each race in reverse chronological order.
Polls at this point in the 2016 Republican race had Donald Trump at 31 percent, Ted Cruz at 26 percent and Marco Rubio at 14 percent. The actual results were Cruz 28, Trump 24, Rubio 23 — so while the polls nailed Cruz, they were 7 percentage points too high on Trump and almost 10 points too low on Rubio.
Polls in the 2016 Democratic caucuses did much better. Hillary Clinton led Sanders 49-46 at polls at this point, and she wound up winning the caucuses 49.9 percent to 49.6 percent, although it was close enough that you could essentially call it a tie.
The 2012 Republican caucuses brought another surprise, however. Rick Santorum was at just 11 percent in polls at this point — in fifth place — but he wound up winning the caucuses (after a vote-counting dispute) with 25 percent of the vote, narrowly ahead of Mitt Romney.
Polls in the 2008 GOP race were quite accurate, predicting Mike Huckabee’s victory there and Romney’s second-place showing.
But the 2008 Democratic race saw a late surge for Barack Obama. He was trailing Clinton 31-27 in the polls four days before the caucuses, but the final Des Moines Register poll showed Obama moving ahead. That proved prescient, as he won the caucuses with 38 percent of the vote to 30 percent each for Clinton and John Edwards.
The 2004 Democratic caucuses saw even bigger last-minute swings. At this point, the polls showed the race as: Howard Dean 28 percent, Richard Gephart 25, John Kerry 20, Edwards 15. The actual finish bore almost no relation to the polls; it was Kerry 37 percent, Edwards 33, Dean 17 and Gephardt 11.
In the 2000 Republican race, polls showed George W. Bush leading Steve Forbes 50-23. The actual result was much closer: Bush 41 percent, Forbes 31 percent.
Polls in the 2000 Democric race were spot on, showing Al Gore leading Bill Bradley 62-38; he actually won 63-35.
In the 1996 Republican race, our average four days before the race would have shown Bob Dole ahead with 39 percent, followed by Forbes at 24 percent and Phil Gramm at 11 percent. Although Dole did win, he did so with only 26 percent of the vote. The second- and third-place candidates were surprises, meanwhile: not Forbes and Gramm, but Pat Buchanan (23 percent) and Lamar Alexander (18 percent), who had each been polling at just 9 percent at this point.
In 1988, GOP polls again correctly predicted Dole to win. But Pat Robertson, who was in third place at 13 percent (trailing vice president George H.W. Bush in second with 30 percent), wound up beating Bush 25-19 for second instead, behind Dole’s 37 percent.
On the Democratic side in 1988, Gephardt was correctly identified as the winner, receiving 31 percent of the actual vote as compared to 29 percent in polls. But Paul Simon, at 18 percent and in third place in the polls, finished in a surprising second place with 27 percent, ahead of Michael Dukakis at 22 percent.
So out of 11 races, we have only three cases (the 2016 and 2000 Democratic caucuses and the 2008 Republican caucuses) where the polls at this point were more or less spot on. And two of those three cases were in races where there were essentially just two candidates, which are sometimes easier to predict. Every other race featured some kind of late polling movement or election night surprise involving the top three candidates.
The trick is that … there doesn’t seem to be much of a pattern in which candidates surge and which ones don’t. In 2004, the establishment candidate, Kerry, overtook the insurgent liberal in Dean. But in several other races (say, Bush in 1988), the more establishment-type candidates underperformed. Sometimes, the late movement accelerated an existing trend, and sometimes it reversed one. Trump had been gaining ground in polls right up until a few days before the 2016 caucuses, for instance, before the last round of polls showed his lead slipping — and he further underperformed on caucus night. You can find several examples of Midwestern candidates overperforming on caucus night — but one of the biggest underachievers, Gephardt in 2004, was from Missouri, a neighboring state.
[Our Latest Forecast: Who will win the Iowa caucuses?]
So you should be prepared for surprises on caucus night — and they may be genuine surprises, not necessarily the surprises that you’re hoping for or the ones that are easiest to conceive of right at this moment.
Iowa often produces last-minute surprises
Polling averages four days before the caucuses and actual results in competitive Iowa caucuses since 1988
Race
Candidate
Poll average before Iowa
Actual result
Actual vs. Polls
2016 (R)
Donald Trump
31.2%
24.3%
-6.9
2016 (R)
Ted Cruz
26.5
27.6
1.1
2016 (R)
Marco Rubio
13.6
23.1
9.5
2016 (R)
Benjamin S. Carson
9.0
9.3
0.3
2016 (R)
Jeb Bush
4.6
2.8
-1.8
2016 (R)
Rand Paul
3.7
4.5
0.8
2016 (R)
Chris Christie
3.3
1.8
-1.5
2016 (R)
Mike Huckabee
2.6
1.8
-0.8
2016 (R)
John Richard Kasich
2.4
1.9
-0.5
2016 (R)
Carly Fiorina
1.7
1.9
0.2
2016 (R)
Rick Santorum
1.1
1.0
-0.1
2016 (R)
James S. Gilmore III
0.3
0.0
-0.3
2016 (D)
Hillary Rodham Clinton
49.4
49.9
0.5
2016 (D)
Bernard Sanders
45.8
49.6
3.8
2016 (D)
Martin O’Malley
4.8
0.6
-4.2
2012 (R)
Mitt Romney
23.8
24.5
0.7
2012 (R)
Ron Paul
23.0
21.4
-1.6
2012 (R)
Newt Gingrich
15.8
13.3
-2.5
2012 (R)
Rick Perry
12.3
10.3
-2.0
2012 (R)
Rick Santorum
11.2
24.6
13.4
2012 (R)
Michele Bachmann
9.1
5.0
-4.1
2012 (R)
Jon M. Huntsman, Jr.
3.5
0.6
-2.9
2012 (R)
Buddy Roemer
1.2
0.0
-1.2
2008 (R)
Mike Huckabee
31.3
34.4
3.1
2008 (R)
Mitt Romney
28.1
25.2
-2.9
2008 (R)
John McCain
12.5
13.1
0.6
2008 (R)
Fred Thompson
9.5
13.3
3.8
2008 (R)
Rudolph W. Giuliani
9.4
3.5
-5.9
2008 (R)
Ron Paul
6.6
10.0
3.4
2008 (R)
Alan Keyes
1.4
0.0
-1.4
2008 (R)
Duncan Hunter
1.3
0.4
-0.9
2008 (D)
Hillary Rodham Clinton
31.4
29.5
-1.9
2008 (D)
Barack Obama
27.3
37.6
10.3
2008 (D)
John Edwards
24.6
29.8
5.2
2008 (D)
Bill Richardson
8.0
2.1
-5.9
2008 (D)
Joseph R. Biden Jr.
5.9
0.9
-5.0
2008 (D)
Dennis J. Kucinich
1.4
0.0
-1.4
2008 (D)
Christopher J. Dodd
1.4
0.0
-1.4
2008 (D)
Mike Gravel
0.0
0.0
0.0
2004 (D)
Howard Dean
27.7
17.4
-10.3
2004 (D)
Richard A. Gephardt
25.3
11.2
-14.1
2004 (D)
John Kerry
20.4
37.1
16.7
2004 (D)
John Edwards
15.4
32.6
17.2
2004 (D)
Wesley Clark
3.8
0.0
-3.8
2004 (D)
Dennis J. Kucinich
3.1
1.0
-2.1
2004 (D)
Joseph I. Lieberman
2.4
0.0
-2.4
2004 (D)
Carol Moseley-Braun
1.2
0.0
-1.2
2004 (D)
Al Sharpton Jr.
0.7
0.0
-0.7
2000 (R)
George W. Bush
50.1
41.0
-9.1
2000 (R)
Steve Forbes
23.3
30.5
7.2
2000 (R)
John McCain
9.5
4.7
-4.8
2000 (R)
Alan Keyes
8.7
14.3
5.6
2000 (R)
Gary L. Bauer
6.8
8.5
1.7
2000 (R)
Orrin G. Hatch
1.4
1.0
-0.4
2000 (D)
Al Gore
62.4
63.4
1.0
2000 (D)
Bill Bradley
37.6
34.9
-2.7
1996 (R)
Bob Dole
38.6
26.3
-12.3
1996 (R)
Steve Forbes
23.9
10.2
-13.7
1996 (R)
Phil Gramm
10.8
9.3
-1.5
1996 (R)
Lamar Alexander
9.0
17.6
8.6
1996 (R)
Patrick J. Buchanan
8.6
23.3
14.7
1996 (R)
Alan Keyes
4.3
7.4
3.1
1996 (R)
Richard G. Lugar
2.2
3.7
1.5
1996 (R)
Morry Taylor
1.9
1.4
-0.5
1996 (R)
Robert K. Dornan
0.9
0.1
-0.8
1988 (R)
Bob Dole
42.1
37.4
-4.7
1988 (R)
George H. W. Bush
29.7
18.6
-11.1
1988 (R)
Pat Robertson
12.6
24.6
12.0
1988 (R)
Jack F. Kemp
9.0
11.1
2.1
1988 (R)
Pete du Pont
6.0
7.3
1.3
1988 (R)
Alexander M. Haig Jr.
0.5
0.3
-0.2
1988 (D)
Richard A. Gephardt
28.8
31.3
2.5
1988 (D)
Michael S. Dukakis
20.7
22.2
1.5
1988 (D)
Paul M. Simon
18.3
26.7
8.4
1988 (D)
Gary Hart
11.8
0.3
-11.5
1988 (D)
Jesse Jackson
9.7
8.8
-0.9
1988 (D)
Bruce Babbitt
9.4
6.1
-3.3
1988 (D)
Al Gore
1.3
0.0
-1.3
January 27, 2020
Politics Podcast: Bernie Sanders Is Gaining Ground One Week Before Iowa
More: Apple Podcasts |
ESPN App |
RSS
| Embed
Embed Code
In this installment of the FiveThirtyEight Politics podcast, the crew assesses Sen. Bernie Sanders’s improvement in state and national polls just one week before the Iowa caucuses. They also debate whether reporting on former National Security Advisor John Bolton’s new book will pressure Republican senators to call witnesses in President Trump’s impeachment trial.
You can listen to the episode by clicking the “play” button in the audio player above or by downloading it in iTunes , the ESPN App or your favorite podcast platform. If you are new to podcasts, learn how to listen .
The FiveThirtyEight Politics podcast publishes Mondays and Thursdays. Help new listeners discover the show by leaving us a rating and review on iTunes . Have a comment, question or suggestion for “good polling vs. bad polling”? Get in touch by email, on Twitter or in the comments.
January 23, 2020
Election Update: What Are The Chances Of A Brokered Convention?
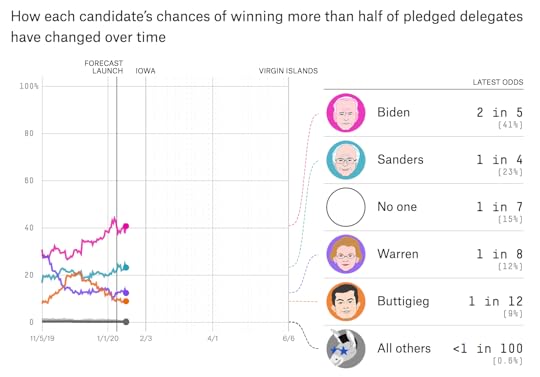
A brokered convention is not a likely occurrence, exactly. But it’s not unlikely, either. It’s roughly as likely as the Tennessee Titans beating the Baltimore Ravens earlier this month, or Donald Trump winning the Electoral College despite losing the popular vote. According to the FiveThirtyEight primary model, there’s a 15 percent chance that no Democrat wins a majority of pledged delegates:
So does that mean we’d be headed to a BrOkErEd CoNvEnTiOn — the first brokered convention of the modern primary era, which began in 1972?
Well, not necessarily. It’s time for a little bit of a detour into a brokered convention explainer. (As a bonus, there is a Venn diagram coming.)
What is a brokered convention, exactly? And is it the same as a contested convention?
First, consider the rather precise phrasing that our model uses. It forecasts the chance that a candidate wins “more than half of pledged delegates.” To be more exact, it forecasts the chance a candidate wins a majority of pledged delegates as of the end of the day on June 6, when the last state or territory (the Virgin Islands) votes.
Winning a majority of pledged delegates is not quite the same thing as winning the nomination. Nor does the failure of any candidate to win the majority of delegates by June 6 necessarily imply a contested or brokered convention.
This is because of a dirty little secret: Democratic delegates are pledged to certain candidates based on the results of primaries and caucuses. But they are not actually legally bound to vote for them, even on the first ballot.
In theory, this means Democratic delegates could subvert the will of the voters and deny a candidate who had won the majority of pledged delegates the nomination. But this is highly unlikely. (Barring, perhaps, a candidate dropping out between June 6 and the convention because of a scandal or health problem.) Among other things, candidates pick their own pledged delegates which increases the chance that delegates will be loyal.
It is reasonably likely, however, that a candidate who didn’t have a majority of pledged delegates on June 6 could nonetheless wind up with one before the convention in Milwaukee. Consider a case like this … after the Virgin Islands votes on June 6, the pledged delegate count is as follows:
Elizabeth Warren has 45 percent of pledged delegates;
Joe Biden has 25 percent;
Bernie Sanders has 20 percent;
the remaining 10 percent are scattered between other candidates.
Our model would treat this as a “no majority” outcome. Basically, the model doesn’t consider anything that happens beyond June 6, including the possibility that delegates vote for a candidate other than the one they are pledged to. So what might happen in a case like this is that — in recognition of Warren’s fairly emphatic plurality — Sanders would ask his delegates to vote for Warren on the first ballot. Or, heck, maybe Biden would too. The delegates, of course, wouldn’t be under any obligation to follow Sanders’s or Biden’s instructions. But if enough of them did, Warren could win a majority of delegates on the first ballot. Moreover, all of this might be decided well in advance of Milwaukee, and the convention itself would be anticlimactic.
I should pause here to note that the definitions of “contested convention” and “brokered convention” — and whether those terms mean slightly different things or are entirely synonymous! — are open to debate.
“Brokered convention” is sometimes regarded as an outmoded term because it implies the use of brokers — which isn’t a terribly good description of the convention process as it exists today. Rather, a contested convention could be a relatively open process with individual delegates — not party bosses wheeling and dealing behind closed doors — having most of the agency to determine the outcome.1 With that said, unless one is trying to be very precise, I don’t have any problem with using “brokered convention” as a near-synonym for “contested convention.”
As to the best definition of a contested convention, I have stronger feelings about that. I’d say a contested convention is a case where the nomination outcome is genuinely in doubt at the time the convention begins.
I realize that this introduces a little bit of subjectivity (what does “genuinely in doubt” mean?).2 The problem is that the most common alternative definition — that a contested convention is any convention that requires multiple ballots — doesn’t capture the spirit of a contested convention very well.
That’s because there could be situations where a convention nominally required multiple ballots to resolve, but the outcome wasn’t contentious. Say in the scenario above — where Warren had won a clear plurality of pledged delegates — everyone agreed that the best way to ensure party unity behind Warren would be to have Biden and Sanders delegates respect the original primary and caucus vote on the first ballot and vote for Biden and Sanders. Then everybody would get behind Warren as a show of force on the second ballot. Moreover, say all of this was scripted and widely disclosed to the press weeks ahead of the convention. It’s hard to think of this being a contested convention in any meaningful respect.
Conversely, it’s possible to imagine the outcome being genuinely in doubt — but the relevant negotiations to resolve the deadlock take place before the first ballot is cast. Say, for instance, that after the Virgin Islands, the delegate count was Sanders 32 percent, Biden 28 percent, Amy Klobuchar 25 percent, and Warren 15 percent. There’s a lot of doubt about the identity of the nominee when everyone gathers in Milwaukee. But Biden offers Klobuchar the vice presidency in exchange for Klobuchar instructing her delegates to vote for Biden on the first ballot. Klobuchar agrees and almost all of her delegates go along, so Biden is nominated with 53 percent of the vote on the first ballot. To me, that ought to count as a contested convention, even though it technically required only one ballot.
Got all that? Here’s a Venn Diagram to help:
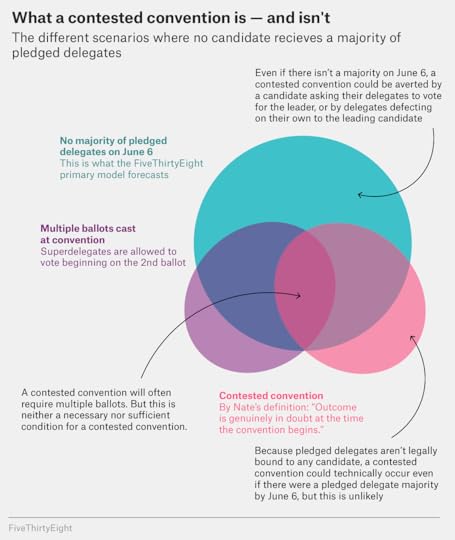
Again, the key thing to remember here is that the model’s no-pledged-delegate-majority scenario does not necessarily imply a contested or brokered convention. It’s probably fairly close to an upper bound on the likelihood of a contested convention, but a 15 percent chance of no majority of pledged delegates on June 6 might imply, I don’t know, only a 10 or 12 percent chance of an actual contested convention, as I’d define it.
The best time for Democrats to avoid a contested convention is before Super Tuesday
Whether it’s 10 percent, 12 percent or 15 percent, I suspect the probability our model spits out for a contested convention will strike some of you as high and others of you as low.
On the one hand, a contested convention has historically been a sucker’s bet. Pundits and reporters love to speculate about the possibility. But out of 18 competitive nomination processes since 1972, none has resulted in what’s uniformly regarded as a contested convention, although some arguably were. (I think the 1976 Republican race probably meets the definition of a nomination whose outcome was uncertain when the convention began. Even that was 44 years ago, however.)
On the other hand, a number of other nominations — including the 2008 Democratic race — have come fairly close to resulting in contested conventions. The 2016 Republican convention could also plausibly have been contested if Republicans had used Democrats’ rules. (Trump got a big boost from winner-take-all and winner-take-most states, which Democratic rules do not allow for).
Moreover, the 2020 Democratic primary is among the more open-ended nomination processes we’ve seen, with at least four — and possibly five (if you count Klobuchar) — plausible winners of Iowa. But it isn’t necessarily the most open-ended nomination; the 2008, 2012 and 2016 Republican nominations were all fairly similar, as were the 1988, 1992 and 2004 Democratic nominations, and none of those produced contested conventions. The once-very-large number of candidates doesn’t seem terribly relevant any more either; many candidates have already dropped out, and several of the ones that remain have little to no chance of accumulating delegates.
Still, it’s not hard to imagine cases where the primary is at a stalemate between three or more candidates. And that’s key: almost all no-majority scenarios require three or more Democrats to continue accumulating delegates on a sustained basis.
There are three main factors that work to prevent such a scenario from happening, however:
First, Democratic rules only award delegates to candidates who get at least 15 percent of the vote in particular states or districts. It’s not a perfectly bright line — if you’re at, say, 14 percent, you’ll still likely get delegates in some districts but not others. But it’s a fairly bright one. Maybe Andrew Yang or Tulsi Gabbard can command 5 to 6 percent of the vote with their own relatively distinct constituencies — but it won’t net them any delegates.
Second, the early states serve to winnow the field. Only Biden and to a lesser extent Sanders are comfortably above 15 percent in national polls, and even they’re not so far above as to necessarily be in a position to stay there following poor showings in the early states. Meanwhile, Warren and Buttigieg (who isn’t above 15 percent nationally) would almost certainly be in trouble in the absence of early state wins.
And third, our model assumes that candidates are reasonably likely to drop out if they don’t have a shot at the nomination, even if they could complicate life for other candidates. This is the most debatable assumption, so we’ll revisit it in a bit.
More precisely, the key to Democrats ensuring there’s not a contested convention is for a lot of this winnowing to take place before Super Tuesday — that is, either candidates fall below 15 percent because their supporters shift to other candidates or they drop out.
Remember: What happens in the early states doesn’t matter very much to the overall delegate math. Iowa, New Hampshire, Nevada and South Carolina collectively account for only about 4 percent of Democratic delegates. But Super Tuesday accounts for roughly one-third of all pledged delegates. So if three or more candidates are still winning delegates as of Super Tuesday, that doesn’t necessarily make a contested convention a likelihood, but it does make it a more distinct possibility.
Our model hopes to sort its way through all of these scenarios, so let’s look at the output from 10,000 simulations in our model run as of late Thursday morning. For each simulation, I tallied up which candidates the model forecasted as having at least 15 percent of the vote (after allocating undecided voters proportionally) as of Mar. 2 — the day before Super Tuesday. This is a good proxy for how many candidates might be expected to pick up a material number of delegates on Super Tuesday.
Here’s a table listing those scenarios, grouping the simulations by how many candidates had at least 15 percent of the vote in each one; as a shorthand, I’ll refer to these as viable candidates. (I acknowledge this table might be slightly on the confusing side, but let me show you the numbers and we’ll go from there.)
How the field might winnow before Super Tuesday
Viable candidates before Super Tuesday in 10,000 simulation runs, per FiveThirtyEight’s primary model as of Jan. 23
Viable Candidates
Chance of happening
Chance of delegate majority, conditional on this scenario
All 1-candidate scenarios
4%
>99%
Biden only
2
>99
Sanders only
1
>99
Warren only
>99
All other 1-candidate scenarios
96
Viable Candidates
Chance of happening
Chance of delegate majority, conditional on this scenario
All 2-candidate scenarios
51%
94%
Sanders/Biden
24
93
Warren/Biden
13
94
Sanders/Warren
4
95
Biden/Buttigieg
4
94
Sanders/Buttigieg
3
94
Warren/Buttigieg
2
95
All other 2-candidate scenarios
1
96
Viable Candidates
Chance of happening
Chance of delegate majority, conditional on this scenario
All 3-candidate scenarios
41%
76%
Sanders/Warren/Biden
19
74
Sanders/Biden/Buttigieg
9
75
Warren/Biden/Buttigieg
5
82
Sanders/Warren/Buttigieg
3
79
Sanders/Biden/Bloomberg
72
Sanders/Warren/Bloomberg
79
Warren/Biden/Bloomberg
81
All other 3-candidate scenarios
3
77
Viable Candidates
Chance of happening
Chance of delegate majority, conditional on this scenario
All 4 -candidate scenarios
4%
48%
Sanders/Warren/Biden/Buttigieg
3
48
Sanders/Warren/Biden/Bloomberg
41
All other 4 -candidate scenarios
1
52
Candidates with at least 15 percent of the national vote, excluding undecideds, in national polls as of Mar. 2
First of all, it’s unlikely that the first four states will completely winnow the field. As you can see in the first row in the table, only 4 percent of simulations resulted in their being only one viable candidate as of Mar. 2. That means even if someone — say, Biden — totally sweeps the early states, someone else will probably hang around. But if it were the case that we had just one viable candidate as of Mar. 2, that results in a delegate majority more than 99 percent of the time.
On the other hand, the early states narrowing the field to two candidates is a fairly likely occurrence. In 52 percent of simulations, that’s what we got: exactly two viable candidates heading into Super Tuesday. By far the most likely combinations are Sanders Biden (a 24 percent chance) or Warren Biden (13 percent).
Some of what you’re seeing here is related to the model accounting for “lanes.” In other words, it’s likely that either Sanders or Warren survive the early states — and it’s possible that they both do — but fairly unlikely that it’s only the two of them and not also Biden or one more of the moderates (Buttiigeg, Klobuchar or Michael Bloomberg).
But in these two-candidates scenarios, it should be fairly easy for Democrats to avoid a contested convention. In these simulations, in fact, someone got a majority of pledged delegates 94 percent of the time. It’s not completely out of the question that two candidates could divide up the map almost evenly, in which case a third or fourth candidate picking up a small handful of delegates could act as a spoiler. — but it’s unlikely.
However, three-viable-candidate scenarios still occurred 41 percent of the time. And the most likely one — Sanders Warren Biden — occurred in 19 percent of all simulations. Combinations involving Buttigieg and two of the other three leading candidates are also plausible if Buttigieg wins Iowa or New Hampshire. There are also see a few scenarios in the table involving Bloomberg if he gains ground before Super Tuesday.
And in these cases, a contested convention becomes quite thinkable — but it’s still less likely than you might assume. About 74 percent of Sanders Warren Biden scenarios result in someone winning a majority of pledged delegates, for example. That could be true for a variety of reasons. It could be because one candidate is way ahead of the other two. Or it could be because someone has a poor Super Tuesday and drops out after that. Or it could be because Democratic voters gravitate toward one candidate late in the process to avoid a contested convention — as Republican voters sort of did late in 2016 when they coalesced around Trump.
There’s also a slight fudge factor in the Democratic delegate math that could be at play here. If a candidate drops out between when a state’s primary occurred and when statewide delegates are actually assigned — which can occur weeks, or even months, after the primary pending on the state — those delegates are reassigned to other candidates still in the running. This doesn’t make a huge difference3 but it does help a bit at the margins for a candidate who is very close to the majority threshold. The probabilities listed as calculated by our model (and as described in this article) account for this reallocation process.
Finally, there are those unlikely scenarios when there are still four or more viable candidates before Super Tuesday; these occur only about 4 percent of the time. Why so unlikely?
First of all, it’s because it would entail the field getting more crowded than it is right now; currently, only 3 candidates (Biden, Sanders, Warren) have at least 15 percent of the vote nationally or are anywhere close to it. So this scenario where there are four viable candidates is pretty unlikely, because if someone else joins this group, it probably means that someone else struggled. Say Buttigieg were to win Iowa, for instance. That necessitates Warren not winning it — in which case she might need a lot of other things to go right to stay above 15 percent nationally.
Even still, these four-candidate scenarios produce someone winning a majority of pledged delegates just shy of the time. Keep in mind that part of this is because four candidates still in the running doesn’t necessarily mean they’re all on equal footing. If national polls before Super Tuesday are something like Sanders 42 percent, Biden 20 percent, Warren 15 percent, Buttigeg 15 percent, then — well, a lot of things could happen — but Sanders is going to wind up with a majority a lot of the time.
Why our model might be underestimating contested convention odds
Maybe you’ll find all of this impressive … or maybe you don’t. Maybe you’re worried about the chance of garbage in, garbage out.
The model is trying to take a lot of history and encode it into a statistical form, which is what most statistical models do. But the risk, of course, is if candidates don’t behave the way that they have in the past, our model could misestimate the likelihood of a variety of different scenarios. In particular, the model is somewhat sensitive to the logic of when candidates drop out. And small changes in our assumptions about this could make a reasonably large difference.
For instance, although as of Thursday morning, the model had a candidate failing to win a majority of pledged delegates in “only” 15 percent of all simulations, there were a lot of close calls. In another 11 percent of simulations, the winning candidate got more than 50 percent of pledged delegates but under 55 percent. And in a further 11 percent of simulations, the winner had more than 55 percent of pledged delegates but still under 60 percent.
One assumption that could be sensitive is the chance that candidates drop out while they’re still a threat to accumulate delegates. So I looked at how often our model predicted candidates to drop out when: (i) they were polling at least 15 percent nationally at the time they quit;4 and (ii) whether it was before Apr. 28, when New York, Pennsylvania, Maryland, Connecticut, Delaware and Rhode Island vote — the last truly major opportunity to accumulate delegates on the calendar:
Biden quit under these circumstances in 12 percent of simulations;
Sanders in 11 percent of simulations;
Warren in 7 percent of simulations;
Buttigieg in 2 percent of simulations.
And for other candidates, this rarely happened.5
In other words, the model has a candidate quitting when they still have a chance to accumulate more delegates — even though they might have little or no chance to actually win the nomination — about 30 percent of the time.
Should we be worried about that? Well, the model’s estimates of candidates’ likelihood of dropping out are derived from historic data — and historically, candidates don’t usually drop out when they have a real shot at winning. But they don’t necessarily hang on until the bitter end either. So far in 2020, that pattern has held, too. Candidates mostly have quit (think Cory Booker or Kamala Harris or Julián Castro) when their situations became dire but not necessarily totally, embarrassingly hopeless.
On the other hand, there are at least some reasons to think some candidates might hang around longer this time. Biden and the other moderates could stay in the race in an effort to stop Sanders, with the party establishment starting to fret (to put it mildly) about the possibility of Sanders winning. Meanwhile, Sanders hung around until the last states voted in 2016 and could do so again, perhaps out of the hopes of forging some alliance with Warren.
Then there’s Bloomberg, whose strategy is hard to figure out, but which mostly seems to hinge on accumulating a sizeable number of delegates on Super Tuesday and beyond. So far, he remains some ways away from the 15 percent he’d need in national polls and in Super Tuesday states. But at the rate he’s spending, it isn’t that crazy to imagine him continuing to grow in the polls and accumulating delegates in some states, even if he’s little threat to actually win the nomination. This sort of delegate accumulation or spoiler strategy doesn’t have a ton of recent precedent6 and isn’t necessarily something the model is equipped to handle terribly well. But in any event where Bloomberg increases in strength, a contested convention would be that much more likely.
Of course, all of this is getting a little bit ahead of ourselves. Okay, let’s be honest — way ahead of ourselves. But the delegate math, including the possibility of a contested convention, is something that affects every candidate’s strategy from the very start of the race. Our advice is not to assume there will be a contested convention just because things look a little chaotic at the moment — many primaries have looked chaotic at this stage of the race. But at the same time, you shouldn’t dismiss the possibility out of hand just because there hasn’t been one recently.
January 22, 2020
Election Update: It’s Cherry-Picking Season
As of our most recent Election Update this weekend, I noted that polls since last week’s debate had been — this is a scientific term — “pretty weird.”
Well, it’s time to revise that statement. There have been a whole bunch of new polls over the past couple of days. And they’ve been not just pretty weird … but really weird. As far as I’m concerned, that means it’s exactly the sort of time when it’s helpful to take an average instead of fixating on individual polls.
On balance, national polls have been pretty good for Bernie Sanders — but there’s a lot of variation from survey to survey. On Wednesday morning, for instance, a CNN poll came out showing him leading Joe Biden nationally and having gained 7 percentage points from the previous CNN poll in December. But a couple of hours later, YouGov’s weekly tracking poll came out showing Sanders in third place — or having lost ground since last week’s debate.
If you’ve come looking for confident assertions about which poll is “right” and which one is “wrong” — well, that’s just not how we do things around here. And any such claims would be a bit ridiculous given the inherently high margin of error on primary polls. Primary and caucus polling is always a struggle, so the hope is that by accounting for a wider range of pollsters and methods, an average will prove to be a bit less wrong than any individual poll might be. At a bare minimum, averaging or aggregating polls increases the sample size, which is a relevant factor since primary polls often use considerably smaller sample sizes than general election ones.
What you don’t want to do, of course, is to cherry-pick data. There’s actually been quite a bit of post-debate polling, and if Sanders had actually gained 7 points nationally, as the CNN poll shows, we would have seen more signs of it by now.
It would be an equally big mistake, however, to “throw out” or ignore the CNN poll. CNN has not shown especially strong results for Sanders before, and CNN’s pollster, SSRS, is reasonably highly rated. It’s a sign that a pollster is doing honest work when it’s willing to publish a poll that differs a bit from the consensus. So stick the CNN poll in the average instead … and you’ll see there’s still some good signs for Sanders.
National polls show Sanders and Bloomberg gaining, others flat
In fact, at 20.4 percent, Sanders is in his strongest position in our national polling average since April. State polls have been much more of a mixed bag, with Sanders having fallen slightly in our Iowa and New Hampshire polling averages since the debate — but we’ll cover those in the next section. A bit more about those national polls first.
In addition, to CNN and YouGov, Morning Consult and Monmouth University also released national polls on Wednesday morning. These join earlier post-debate national polls from SurveyUSA and Ipsos. Here’s a table showing those polls for the top six candidates:
Biden leads, Sanders second in post-debate national polls
Where the top six candidates stand in six national polls, after the last debate
Post-debate toplines
Pollster
Biden
Sanders
Warren
Buttigieg
Bloomberg
Klobuchar
CNN/SSRS
24
27
14
11
5
4
Ipsos
19
20
12
6
9
2
Monmouth
30
23
14
9
6
5
Morning Consult
29
24
15
8
10
3
SurveyUSA
32
21
14
9
9
2
YouGov
28
18
21
8
6
4
Simple avg.
27.0
22.2
15.0
8.5
7.5
3.3
FiveThirtyEight avg.
26.6
20.4
15.8
7.6
7.3
3.2
Current FiveThirtyEight national polling average and most recent polls, as of Jan. 22
And here’s a companion table showing the change from the previous pre-debate poll for each pollster. Note that the pre-debate poll wasn’t necessarily that recent; the last time that SurveyUSA had polled the race nationally was in November, for instance.
National polls show gains for Sanders, Bloomberg
How the top six candidates’ standing changed from each pollster’s previous pre-debate poll
Pollster
Biden
Sanders
Warren
Buttigieg
Bloomberg
Klobuchar
CNN/SSRS
-2.0
+7.0
-2.0
+3.0
+0.0
+1.0
Ipsos
-4.0
+0.0
-3.0
+1.0
+1.0
+1.0
Monmouth
+4.0
+2.0
-3.0
-2.0
+4.0
+1.0
Morning Consult
+0.0
+1.0
+1.0
+0.0
+2.0
+0.0
SurveyUSA
+2.0
+4.0
-1.0
-2.0
+6.0
+0.0
YouGov
+1.0
-2.0
+2.0
+1.0
+1.0
+1.0
Raw avg. change
+0.2
+2.0
-1.0
+0.2
+2.3
+0.7
FiveThirtyEight avg. change*
-0.1
+1.7
-0.3
+0.2
+1.5
+0.1
*Calculated change in FiveThirtyEight’s national polling average since Jan. 14
In the tables, you can see how a simple average of the six most recent polls compares to the much fancier FiveThirtyEight polling average: They’re really pretty darn similar. There are some differences, though. For instance, it’s worth noting that the SurveyUSA poll had about three times (1086) as many respondents as Monmouth (372) and more than twice as many as CNN (500); our averages account for that by giving SurveyUSA more weight. House effects are also something of a factor; for instance, SurveyUSA tends to show good numbers for Biden, Morning Consult tends to show good numbers for Sanders, YouGov tends to show good numbers for Elizabeth Warren; and Ipsos tends to show poor numbers for all candidates except Sanders. Those explain some of the differences between the polls, too.1
But none of this really matters that much. As you can see, the FiveThirtyEight average and a simple average of the six post-debate polls produce highly similar results. Likewise, the average change in the polls is pretty similar regardless of which method you use. Take a simple average of the change in Sanders’s numbers since the last time these six pollsters surveyed the field, and he’s gained 2.0 percentage points since the debate. Similarly, he’s gained 1.7 percentage points in the fancy version of the FiveThirtyEight average, calculated since Jan. 14, the day of the debate. Michael Bloomberg has also gained ground regardless of what method you choose and is close to catching Pete Buttigieg in our national average.
State polls haven’t been great for Sanders, though
There have also been quite a few state polls since the debate, however, and they don’t tell a terribly consistent story with the national polls. They’re actually on the weak side for Sanders. Iowa polls from Neighborhood Research and Media and David Binder Research, both conducted since the debate, have Sanders in 5th and 4th place, respectively in the Hawkeye state. But Sanders does have some decent excuses here; the David Binder poll has generally been one of his worst ones in Iowa, and the Neighborhood Research poll has a small sample size and is from a Republican pollster that hasn’t previously released data in Iowa (as such, it receives a relatively small weight in our model).
Nonetheless, based on recent Iowa polls — both before and after the debate — Iowa would appear to be Biden’s state to lose more than Sanders’s. Biden has been ahead or tied for the lead in 4 of the 5 Iowa polls since the new year, as compared with just two for Sanders. (Although one of the polls that had Sanders ahead was the highly-rated Selzer & Co. poll.) In fact, Sanders has basically slipped into a three-way tie for second place in Iowa with Warren and Buttigieg.
Iowa and N.H. trends have been medicore for Sanders
How the top five candidates’ polling averages in Iowa and New Hampshire changed, before and after the last debate
Iowa
New Hampshire
Candidate
Jan. 14*
Current
Change
Jan. 14
Current
Change
Biden
20.1
21.4
+1.3
21.8
17.9
-3.9
Sanders
19.9
17.8
-2.1
20.1
19.5
-0.6
Warren
14.9
16.4
+1.5
16.0
13.8
-2.2
Buttigieg
17.4
16.6
-0.8
13.1
13.9
+0.8
Klobuchar
6.7
8.4
+1.7
4.7
7.1
+2.4
* Polling average as of the day before the debate.
In New Hampshire, true to the theme, the polling has also been weird. Two new polls conducted wholly or partially since the debate, from Emerson College and Suffolk University, each show Sanders leading there — but having lost ground relative to the previous editions of the same polls. Instead, these polls show growth for candidates outside of the top three, such as Buttigieg and Amy Klobuchar. And in the case of the Suffolk poll, there are also a large number of undecided voters. (Sanders, despite being the leading candidate in the Suffolk poll, has only 16 percent of the vote in the poll.) Sanders leads in our New Hampshire polling average, but no candidate should feel particularly secure in the Granite State.
Wednesday also saw the release of polling in four delegate-rich Midwestern swing states from a consortium of universities there, Baldwin Wallace University, Oakland University and Ohio Northern University. Sanders led in Wisconsin, but Biden held leads in Ohio, Michigan and Pennsylvania.
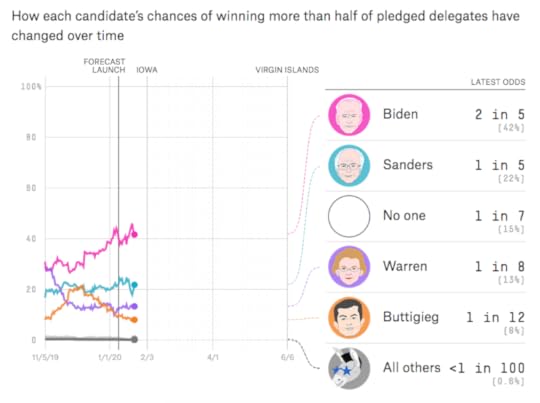
How much do national polls matter?
Overall, our forecast just hasn’t changed that much since we first released it two weeks ago. Biden has a 43 percent chance of a delegate majority, followed by Sanders at 20 percent, Warren at 14 percent and Buttigieg at 8 percent. The chance of no candidate winning a majority of delegates is 15 percent. Technically, Biden is up very slightly and Sanders is down very slightly since we first launched the forecast, but the differences are small and not worth spending a ton of time worrying about.
If you look carefully, though, you can see how the model tends to privilege state polls over national polls (or at least it does so right now, with Iowa set to vote in less than two weeks). For example, Sanders did gain ground in the model following the release of the Selzer poll of Iowa on Jan. 10, but — despite his standing in national polls improving — he’s given those gains back because of an underwhelming series of polls in Iowa and New Hampshire.
You might be wondering: How does the model even use national polls? There is no national primary, after all. But national polls have several uses in the model. To simplify, here are the three most important ones:
We use national polls to calculate a trendline adjustment, which can influence states that haven’t been polled recently. For instance, if there are no recent polls of Oregon, but Sanders has gained 3 points in national polls since the last time Oregon was polled, the model will assume he’s gained ground in Oregon, too.
National polls are used as a baseline to calibrate the bounce a candidate will potentially receive after winning or finishing strongly in a state. The twist is that the higher a candidate’s standing in national polls, the less her bounce after winning a state (and the more she might decline after losing a state). Empirically, the bounce that a candidate gets after winning a state depends strongly on expectations, and national polls are a good proxy for voter and media expectations. Less abstractly, the fact that Sanders is now seen as a national front-runner means that — as is also the case with Biden in Iowa — he might gain less ground following a win there, and lose more ground nationally if he finishes in anything other than first place or a strong second. Warren or Buttigieg, on the other hand, would probably be seen more as underdogs, and those sort of candidates have historically gotten bigger bounces after winning Iowa.
In various implicit and explicit ways, national polls help the model to predict the outcome of states where there isn’t much polling.
So basically, factors No. 1 and No. 3 tend to help a candidate in the model when their national polls are strong, but factor No. 2 (rising expectations) actually hurts them. To be clear, our experience with the model so far — keep in mind that this is the first time we’ve run a full-fledged primary forecast — is that No. 1 and No. 3 usually outweigh No. 2. In other words, a candidate would usually prefer to gain ground in national polls, as far as the model is concerned. Still, there is some ambiguity about the influence of national polls in the model, especially when there is a lot of recent state polling and so the timeline adjustment (No. 1) doesn’t have as much impact.
Essentially, this leaves us with three plausible interpretations of the post-debate polling:
National polls tell the true story of the race, and the slightly quirky set of recent Iowa and New Hampshire polls since the debate are misleading. If so, Sanders should expect to do better in the next set of Iowa and New Hampshire polls. This would be good news for Sanders.
All of this is noise, and none of the candidates’ positions have changed much since the debate. This would be neutral news for Sanders.
Whether or not Sanders is gaining in national polls, Iowa and New Hampshire have their own dynamics, and Sanders does not appear to be closing strongly there. This would be bad news for Sanders.
Polling since the debate just doesn’t provide a lot of clarity on which one of these stories is correct. So we’ll have to wait and see if the picture clears up by the weekend.
January 20, 2020
Politics Podcast: The Electoral Cases For — And Against — The Four Leading Democrats
More: Apple Podcasts |
ESPN App |
RSS
| Embed
Embed Code
In this recording of a live show, the FiveThirtyEight Politics podcast crew debates the electoral cases of the four leading candidates in the Democratic primary. The team also discusses the concept of electability and whether voters are biased against voting for a woman for president. Plus, Galen, Nate, Clare and Micah play a round of “Guess What Americans Think.”
You can listen to the episode by clicking the “play” button in the audio player above or by downloading it in iTunes , the ESPN App or your favorite podcast platform. If you are new to podcasts, learn how to listen .
The FiveThirtyEight Politics podcast publishes Mondays and Thursdays. Help new listeners discover the show by leaving us a rating and review on iTunes . Have a comment, question or suggestion for “good polling vs. bad polling”? Get in touch by email, on Twitter or in the comments.
January 18, 2020
Election Update: The First Post-Debate Polls Are In! And They’re … Pretty Weird.
The first handful of polling since Tuesday night’s debate is out. But it doesn’t tell a terribly consistent story. Pretty much whichever Democrat you’re rooting for, you can find some polls to be happy about and others that you’d rather ignore. Here’s a quick list of those polls:
SurveyUSA has a new national poll that shows Joe Biden leading with 32 percent of the vote, followed by Bernie Sanders at 21 percent, Elizabeth Warren at 14 percent and both Pete Buttigieg and Michael Bloomberg at 9 percent. As compared with their previous national poll in November, Biden is up 2 percentage points, Sanders is up 4, Warren is down 1, Buttigieg is down 2, and Bloomberg is up 6.
SurveyUSA also published a new California poll, which has Biden leading there at 30 percent, with Sanders and Warren tied for second at 20 percent and Buttgieg in fourth at 8 percent. Biden and Sanders are both up 2 percentage points since their November California poll, when California senator Kamala Harris was still in the running, while Warren has gained 7 points since polling at 13 percent in November.
While SurveyUSA has seemingly good news for Biden, an Ipsos national poll for Reuters does not. Instead, it has Sanders ahead nationally at 20 percent, followed by Biden at 19, Warren at 12, Bloomberg at 9, and Buttigieg at 6. As compared with the Ipsos/Reuters national poll conducted roughly a week before the debate, Sanders is unchanged, but Biden is down 4 percentage points and Warren is down 3 points.
I should also mention the Ipsos poll conducted with FiveThirtyEight, which surveyed a single group of voters both before and after the debate. It did not include a traditional horse-race question (i.e., “Who is your first choice?”) so it doesn’t figure directly into our polling averages or primary model. However, it showed strong results for Warren, with her making gains on favorability, perceived electability, and the number of Democrats who said they were considering voting for her.
Finally, an Emerson College poll of New Hampshire, conducted partially since the debate, has Sanders ahead there with 23 percent of the vote, followed by Buttigieg at 18 percent, Biden and Warren each at 14 percent, and Amy Klobuchar at 10 percent. As compared with Emerson’s previous poll of New Hampshire, in November, Sanders is actually down 3 points and Buttigieg is down 4 points, while Biden and Warren are unchanged and Klobuchar is up 8 points.
As I said, you can cherry-pick your way to pretty much whatever narrative you like. Biden fan? Both those SurveyUSA numbers look nice. Sanders stan? You’ll probably want to emphasize the Ipsos/Reuters poll. Warren aficionado? The SurveyUSA California poll and the Ipsos/FiveThirtyEight poll look good; the others, not so much.
But some of these polls are also pretty confusing. If you’re Sanders, for instance, should you be happy that the Emerson poll in New Hampshire still has you leading, or unhappy that it has you having lost a few points? Or to abstract the question: Should you pay more attention to the trendline within a poll or to the absolute result?
This question does not have a straightforward answer (other than that both are important to some degree). Ideally, you should be comparing a poll not only against the most recent survey by the same pollster, but really against all previous surveys by the pollster in that state — and for that matter also in other states — to detect whether it generally shows good results or poor results for your candidate. And when evaluating trendlines, you should account for when the previous polls were conducted. For example, any poll conducted in October is likely to have shown good results for Warren, since she was at her peak nationally then. So if a new poll came out today showing Warren having fallen by 2 points in Iowa since October, that might might be comparatively good news for her since you’d have anticipated a steeper decline.
If all this sounds like a lot of work … well, it’s the work that our polling averages and our model are doing for you behind the scenes. Usually our model moves in the direction you might expect intuitively, e.g., Sanders gained ground both in Iowa and in our overall delegate forecast after a Selzer & Co. poll showed him leading the Iowa caucuses.
In the presence of strong house effects, however, the model might move in surprising directions. Just as polls can have house effects in general elections — Rasmussen Reports polls have a notoriously pro-Trump/pro-Republican lean, for example — certain pollsters in the primaries persistently show better or worse results for certain candidates.
And it just so happens that all the pollsters who have released polls since the debate have fairly strong house effects. Emerson College has often shown strong results for Sanders, for instance. And SurveyUSA — both in its California polls and its national polls — has consistently had some of the best numbers for Biden. This is good news for Biden in one sense since SurveyUSA is one of our highest-rated pollsters. But it also means that it isn’t necessarily new news when a SurveyUSA poll comes out showing Biden doing well; such a result will be in line with our model’s expectations. Conversely, Ipsos has consistently shown some of the worst results for Biden, so it doesn’t necessarily move the needle in our model when another Ipsos poll comes out showing Biden doing mediocrely.
To give you a sense of the magnitude that house effects can have, here are the various post-debate polls with and without our model’s house effects adjustment:
House effects can make a big difference
Polls since the January debate, with and without FiveThirtyEight’s adjustments for house effects
SuvreyUSA national poll, Jan. 14-16, 2020
Candidate
Raw
Adjusted
Biden
32.0%
28.0%
Sanders
21.0
20.1
Warren
14.0
14.7
Bloomberg
9.0
9.0
Buttigieg
9.0
8.5
Ipsos/Reuters national poll, Jan. 15-16, 2020
Candidate
Raw
Adjusted
Sanders
20.0%
20.2%
Biden
19.0
22.9
Warren
12.0
16.1
Bloomberg
9.0
8.5
Buttiigeg
6.0
7.4
SuvreyUSA California poll, Jan. 14-16, 2020
Candidate
Raw
Adjusted
Biden
30.0%
26.1%
Sanders
20.0
19.1
Warren
20.0
20.8
Buttigieg
8.0
7.5
Bloomberg
6.0
6.0
Emerson College New Hampshire Poll, Jan. 13-16, 2020
Candidate
Raw
Adjusted
Sanders
22.9%
18.0%
Buttigieg
17.7
17.7
Biden
14.1
13.4
Warren
13.5
13.4
Klobuchar
10.0
10.3
Yang
6.3
5.0
Only candidates polling at 5 percent or more in each survey are shown
Source: Polls
While the SurveyUSA national poll had Biden at 32 percent and Ipsos had him at 19 percent, the gap is a lot smaller once you account for house effects. The adjustment brings the SurveyUSA poll down to 28 percent and the Ipsos poll up to around 23 percent, a difference that is well within the polls’ sampling error given their respective sample sizes.
To be clear, house effects are not the same thing as statistical bias, which can be evaluated only after a state has conducted its voting. For example, SurveyUSA is implicitly suggesting that Biden is underrated by other pollsters. If they’re wrong about that, SurveyUSA polls will turn out to have had a pro-Biden bias. But if Biden’s results match what SurveyUSA’s polls project, then their polls will have been unbiased and all the other polls will have had an anti-Biden bias. Obviously, we think you should usually trust the polling average — that’s the whole point of averaging or aggregating polls. But especially in the primaries, where turnout is hard to project, it’s also worth paying attention to the differences between polls — and sometimes pollsters with strong house effects (even to the point of being “outliers”) turn out to be correct.
For all that said, polls with strong house effects, because of the additional complications they present, aren’t necessarily ideal for evaluating polling swings following news events such as debates. So while it’s tempting to infer from the polls we have so far that the debate didn’t change things very much — no candidate is consistently seeing their numbers surge or crater — we should wait for a few more polls to confirm that.
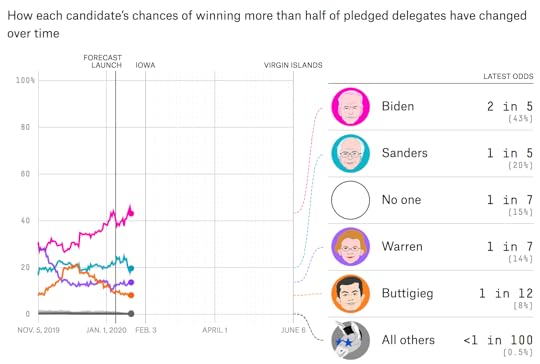
In the meantime, our topline forecast is largely unchanged. Biden remains the most likely candidate to win the majority of pledged delegates, with a 41 percent chance, followed by Sanders at 23 percent, Warren at 12 percent and Buttigieg at 9 percent. There is also a 15 percent chance no one wins a majority, a chance that could increase if Bloomberg, who has now almost caught Buttigieg in our national polling average, continues to rise.
Nate Silver's Blog

- Nate Silver's profile
- 730 followers

