
Nate Silver's Blog, page 14
August 2, 2022
A Majority Of Americans Think We Are In A Recession
In Part 2 of this installment of the FiveThirtyEight Politics podcast, the team breaks down how the latest economic debate — if the U.S. is entering a recession — could affect the midterm elections.


Bipartisan Legislation Has An Unexpected Comeback In Congress
In Part 1 of this installment of the FiveThirtyEight Politics podcast, the crew discusses how Congress has been passing a slew of bipartisan legislation recently and whether that trend will continue with the new Inflation Reduction Act.
August 1, 2022
Politics Podcast: All The Political News You Missed Last Week
Last week Sens. Joe Manchin and Chuck Schumer announced they had reached an agreement on a climate, tax and health care bill — an outcome that seemed unlikely just weeks ago. In this installment of the FiveThirtyEight Politics podcast, the crew discusses how Congress has been passing a slew of legislation recently and whether that trend will continue with the new Inflation Reduction Act. Speaking of inflation, the team also breaks down how the latest economic debate — if the U.S. is entering a recession — could affect the midterm elections.
Finally, they cover some juicy political news from last week, including the relaunch of Andrew Yang’s Forward Party, which has joined forces with two centrist groups, and the Washington Post’s report that the Department of Justice is looking into former President Donald Trump’s actions regarding its Jan. 6 criminal investigation.
You can listen to the episode by clicking the “play” button in the audio player above or by downloading it in iTunes , the ESPN App or your favorite podcast platform. If you are new to podcasts, learn how to listen .
The FiveThirtyEight Politics podcast is recorded Mondays and Thursdays. Help new listeners discover the show by leaving us a rating and review on iTunes . Have a comment, question or suggestion for “good polling vs. bad polling”? Get in touch by email, on Twitter or in the comments.
July 29, 2022
The Political Environment Might Be Improving For Democrats
By Nate Silver
Jul. 29, 2022, at 8:10 AM
ILLUSTRATION BY EMILY SCHERER
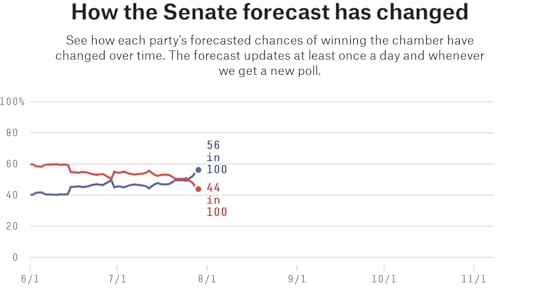
As was the case when we launched the forecast a month ago, the Deluxe version of FiveThirtyEight’s midterm model still rates the battle for control of the Senate as a “toss-up.” But within that category there’s been modest, but consistent movement toward Democrats. Their chances of winning the Senate now stand at 55 percent. That’s up from 47 percent from forecast launch on June 30. It’s also up from 40 percent in a retroactive forecast dated back to June 1.1
This is matched by Democrats’ improved position on the generic congressional ballot, which asks voters which party they would support in a congressional election. Democrats are now essentially tied with Republicans in our generic ballot polling average, after having trailed by 2 to 3 percentage points over most of the late spring and early summer.
In the Classic version of our forecast — which doesn’t use the race ratings published by the Cook Political Report and other expert groups — the movement toward Democrats has also been steady. There, their chances sit at 67 percent, up from 56 percent at launch on June 30 and 52 percent in the June 1 retroactive forecast. (We discussed some of the differences between our Classic and Deluxe versions of the forecast on this week’s podcast, and it’s a theme we’ll revisit in the coming weeks.)
It’s always hard to know how much to emphasize relatively modest movement in the forecast. Sure, the difference between a 47 percent chance and a 55 percent chance might matter to a poker player (raises hand) or an options trader. But in practical terms, the story is the same, which is that the battle for Senate control is highly competitive and neither party has a clear advantage.
Watch: https://abcnews.go.com/fivethirtyeigh...
In this case, though, I think the shift is worth discussing. One reason, as I’ve discussed previously, is that our model is designed to be pretty conservative — at least at this relatively early stage of the race.2 It takes a fair amount of data to get the model to change its opinion in July, more so than in October. So although the shift may be modest, it probably isn’t just statistical noise.
The other reason is that there are plenty of news developments to help explain the shift; the political climate would appear to be getting better for Democrats.
The most important of these is probably the Supreme Court’s June decision to overturn Roe v. Wade. Democrats have made a fairly clear improvement in the polls since then. And although abortion may not be as important to voters as the economy, it did rank as the second-most-important issue in this week’s Suffolk/USA Today poll.
That’s not the only factor working in Democrats’ favor, though. Consider:
Congress has been surprisingly productive, with bipartisan bills on gun safety and funding semiconductor manufacturing passing, a possible breakthrough on a Democratic spending and climate bill and movement toward bills to codify same-sex marriage and to reform how presidential elections are certified.It’s not clear how much the Jan. 6 hearings have changed public opinion, but they have highlighted an issue where the public is relatively sympathetic toward Democrats, with 79 percent of voters saying former President Donald Trump acted either unethically or illegally in a new CNN poll.COVID-19 — an issue that was something of a no-win for President Biden — is on the backburner for most voters. In the aforementioned Suffolk/USA Today poll, so few voters mentioned COVID-19 as their most important issue that it wasn’t broken out as one of the 25 issues respondents named. Cases remain high, but deaths are low compared to earlier stages of the pandemic.Granted, the economic news hasn’t been good for Democrats. Most voters think the economy is in a recession, even though the bureau that determines recessions in the U.S. hasn’t declared one yet and may never do so. But at the same time, some highly visible indicators have improved: Gas prices are down and the stock market has been in a rebound over the past five to six weeks.Watch: https://abcnews.go.com/ThisWeek/video...
There are a lot of “ifs” here. Economists are unsure about what to expect with inflation going forward; the next COVID-19 variant could be more deadly; there are still a lot of hurdles to clear in the Democratic legislative progress (*cough* Sen. Kyrsten Sinema *cough*); and Democrats may not be able to sustain the same level of attention currently given to abortion and the Jan. 6 hearings. Plus, Biden’s approval rating remains terrible to the point where even most Democrats say they want a different presidential nominee in 2024. But ultimately, Democrats have a lot of outs to a winning hand in the Senate, even if they’re drawing thin in the House.
July 25, 2022
What Would Losing Big In The Midterms Mean For Biden?
In this installment of “Model Talk,” FiveThirtyEight’s Nate Silver and Galen Druke discuss why Democrats are leading in the polls in numerous competitive Senate races, even though that bucks the conventional wisdom that Republicans will do well in the midterms. They also touch on the health of the polling industry and how much President Biden’s success in a potential 2024 primary election hangs on Democrats’ performance in the midterms.
Politics Podcast: The Polls And Pundits Disagree (Again)
The conventional wisdom that Republicans will do well in the midterms hasn’t always been borne out in the polling numbers, which have shown Democrats leading in numerous competitive Senate races around the country. That discrepancy can also be seen in the relatively large gap between FiveThirtyEight’s Lite and Deluxe midterm forecasts.
In this installment of “Model Talk” on the FiveThirtyEight Politics podcast, Nate Silver and Galen Druke discuss what to make of this and answer listener questions about the forecast model. They also touch on the health of the polling industry and how much President Biden’s success in a potential 2024 primary election hangs on Democrats’ performance at the midterms.
FiveThirtyEight More: Apple Podcasts | ESPN App | RSSYou can listen to the episode by clicking the “play” button in the audio player above or by downloading it in iTunes , the ESPN App or your favorite podcast platform. If you are new to podcasts, learn how to listen .
The FiveThirtyEight Politics podcast is recorded Mondays and Thursdays. Help new listeners discover the show by leaving us a rating and review on iTunes . Have a comment, question or suggestion for “good polling vs. bad polling”? Get in touch by email, on Twitter or in the comments.
July 22, 2022
New Hampshire Is Tiny And Pretty Weird. That Could Help Maggie Hassan.
By Nate Silver
Jul. 22, 2022, at 8:45 AM
ILLUSTRATION BY EMILY SCHERER
We remain in something of a summer doldrums for polling, and the overall outlook for November remains about the same as in recent weeks. But polls on the race for Congress have continued to inch slightly toward Democrats in what may reflect the impact of the Supreme Court’s decision to overturn Roe v. Wade.
In the Deluxe version of our midterm election forecast, Republicans have a 85 percent chance to win the House and a 51 percent chance to win the Senate, both largely unchanged from when we launched the model three weeks ago. Meanwhile, in the Classic version of the model, which sticks to purely quantitative factors and leaves out the expert race ratings published by the Cook Political Report and other such groups, Republicans are actually underdogs to win control of the Senate, with a 39 percent chance.
Part of the reason Republicans are not better positioned in the Senate is they don’t have a lot of easy pick-up opportunities, but one race where Republicans could gain traction is the New Hampshire Senate race. Democratic incumbent Sen. Maggie Hassan has led in all but one poll this year against a series of potential Republican opponents, but the GOP shouldn’t write the race off. Hassan’s lead is small in most of these polls, and it’s still early, with the primary not scheduled until Sept. 13.1
New Hampshire is also an unusual state in that it has some factors that should make it relatively fertile ground to defeat an incumbent, and others that should make it a challenging one. So let’s take a look under the hood.
Watch: https://abcnews.go.com/fivethirtyeigh...
The factor that could help Republicans most is that New Hampshire — famous for polling leads that seem to evaporate overnight, like Barack Obama’s against Hillary Clinton’s in the Democratic primary there in 2008 — is notoriously swingy. I don’t just mean that it’s a swing state, although it frequently is in general elections. I also mean that it has a lot of swing voters: moderate, independent voters who split their tickets. Consider that, in 2020, Democratic Sen. Jeanne Shaheen won reelection there by 16 percentage points, while Republican Gov. Chris Sununu was reelected by 32 points on the same ballot.2
FiveThirtyEight measures this with our elasticity index, which is derived from voter-level survey data3 to reflect how sensitive a state is to national trends. New Hampshire has an elasticity index of 1.21 — the fourth-highest in the country — which means that for every 1-point shift in the national environment, we’d expect New Hampshire to shift by about 1.2 points instead. So, for instance, a 5-point swing toward Republicans nationally would produce a 6-point swing there. That makes Hassan a bit more vulnerable.
What makes a state swingy? Generally speaking, the most reliable group of Democratic voters are Black voters, and the most reliable group of Republican voters are evangelical white Christians. New Hampshire is quite secular and quite white, so neither party’s base is very large there.
Likewise, most other high-elasticity states are relatively nonreligious and have relatively few Black voters, although states with large numbers of Latino voters can be pretty swingy, as Democrats are discovering to their dismay.
New Hampshire is a swingy state
FiveThirtyEight’s 2022 state elasticity scores
State Elasticity Score Rhode Island 1.29 Hawaii 1.23 Alaska 1.22 New Hampshire 1.21 Vermont 1.15 Massachusetts 1.14 Maine 1.14 Utah 1.11 Connecticut 1.10 North Dakota 1.09 Colorado 1.09 Wyoming 1.08 New Mexico 1.08 Iowa 1.07 Arizona 1.07 Washington 1.06 Nevada 1.06 Wisconsin 1.05 West Virginia 1.04 Indiana 1.04 Michigan 1.03 Nebraska 1.03 Kansas 1.03 South Dakota 1.03 Ohio 1.02 Florida 1.02 Idaho 1.02 Arkansas 1.02 Texas 1.01 New Jersey 1.01 Minnesota 1.00 California 1.00 Pennsylvania 0.99 Oregon 0.98 New York 0.97 Illinois 0.96 Montana 0.96 South Carolina 0.96 Oklahoma 0.96 Kentucky 0.95 Missouri 0.94 Tennessee 0.94 Virginia 0.94 North Carolina 0.93 Louisiana 0.92 Georgia 0.90 Maryland 0.87 Delaware 0.86 Mississippi 0.85 Alabama 0.83Elasticity isn’t the only factor the model considers, however. Another is a state’s population. And in smaller states, the incumbency advantage is larger.
If you’re a Senate history buff, think about states that have a handful of electoral votes, like Vermont, West Virginia, Hawaii or North Dakota. They tend to have fairly long-tenured senators. Only four senators (Bernie Sanders, Patrick Leahy, Jim Jeffords and Robert Stafford) have represented Vermont since 1975, for example. (Although Leahy is retiring and not seeking reelection this year.)
Why might the incumbency advantage be larger in small states? I can think of a few theories. One is that, in a smaller state, it’s easier for a senator to maintain a strong, personal relationship with influential constituents and to be visible in her community. A second theory is about competition: In a smaller state, there are fewer highly talented politicians with national aspirations, so an incumbent will be up against weaker opponents, on average.
A third hypothesis: It’s all about the pork. Since each state has the same number of senators, a senator from a small state is more likely to extract concessions in exchange for pork-barrel spending,4 and this can make them more popular across party lines with voters at home (think Sens. Lisa Murkowski of Alaska or Joe Manchin of West Virginia). Whatever the reason, the statistical tendency of small-state Senate incumbents to overperform is fairly robust, and this is accounted for by our model.
What else helps an incumbent? The weirder a state, the bigger the incumbency advantage. OK, I should probably clarify what I mean by “weird.” A more precise term would be “dissimilar” or “distinctive.”
As part of our forecast, we apply a process called CANTOR5 that determines which states and congressional districts are most similar to one another according to a variety of demographic, geographic and political variables — such as race, religion, income and education, population density, latitude and longitude, and voting behavior in recent presidential elections. A state like Hawaii qualifies as distinctive by this process, for instance. It has a far bigger Asian American and Native Hawaiian population than other states, it’s very Democratic, it’s very expensive and it’s truly out there in the middle of nowhere in the Pacific Ocean.
New Hampshire counts as somewhat distinctive, by contrast. As I mentioned, it’s quite white and quite nonreligious relative to the rest of the country. It also has above-average incomes and education levels but below-average population density (in the way that FiveThirtyEight measures it). On the other hand, it is toward the middle of the road politically. Overall, it ranks as the 25th-most distinctive state. Michigan is the state which most closely resembles the rest of the country, by contrast.
New England is distinctive
States that are least similar to other states, according to FiveThirtyEight’s CANTOR
Rank State 1 Hawaii 2 California 3 Utah 4 Alaska 5 Vermont 6 Massachusetts 7 Wyoming 8 New York 9 Maryland 10 West Virginia 11 New Jersey 12 Mississippi 13 North Dakota 14 Rhode Island 15 South Dakota 16 Idaho 17 Maine 18 Arkansas 19 New Mexico 20 Connecticut 21 Washington 22 Texas 23 Alabama 24 Oklahoma 25 New Hampshire 26 Nevada 27 Montana 28 Louisiana 29 Florida 30 Delaware 31 Oregon 32 Tennessee 33 Kentucky 34 Illinois 35 South Carolina 36 Colorado 37 Georgia 38 Arizona 39 Nebraska 40 Virginia 41 Iowa 42 Minnesota 43 North Carolina 44 Kansas 45 Missouri 46 Pennsylvania 47 Indiana 48 Wisconsin 49 Ohio 50 MichiganFactors that CANTOR considers include race, religion, age, gender, household income, educational status, voting behavior in recent presidential and state legislative elections, percentage of residents born abroad, population density, geographic region, latitude and longitude.
How could distinctiveness provide an advantage to an incumbent? In some ways, the answers are similar to why small states have a leg up. If a state has a population with unique concerns — say, religious minorities like Mormon or Jewish voters, or a racial minority like Native Hawaiians — incumbents can exhibit competence by serving those populations in ways that somewhat cross party lines and are less subject to the whims of the national political environment.
Another related theory is that there could be a stronger bond between voters and politicians in distinctive states. The politician may be a member of the minority group, or they may have ties to an industry that is uniquely important in the state. In the same sense that you probably know a married couple who are “perfect for one another,”6 there may be stronger matching in these cases.
But a statistical measure of distinctiveness is only as good as its inputs, and there are some things CANTOR leaves out. Being home to an industry like gambling in Nevada or coal production in West Virginia is potentially politically important, for instance, but CANTOR doesn’t take this into consideration.
Overall, New England is a culturally distinctive region that is hard to pin down statistically, but is visible in everything from its cuisine to its intense loyalty to the Boston Red Sox. My subjective experience is that New England is considerably weirder — excuse me, “more distinctive” — than our metric describes it, and that means New England tends to be quite loyal to its incumbents. Hassan will hope that pattern holds.7
July 15, 2022
Biden Is Very Unpopular. It May Not Tell Us Much About The Midterms.
By Nate Silver
Jul. 15, 2022, at 6:00 AM
ILLUSTRATION BY EMILY SCHERER
This week, a Siena College/New York Times poll showed President Biden with just a 33 percent approval rating, a result so poor that it touched off speculation — including from yours truly — about whether he would even run again in 2024. The Siena/New York Times number is on the low end of the polling consensus, but Biden’s approval rating in our polling average — about 39 percent1 — is nonetheless a historically low number.
And yet, the same poll showed a neck-and-neck race for Congress. Democrats led by 1 percentage point among registered voters2 on the question of which party voters preferred controlled Congress and trailed by 1 point among likely voters.
What to make of this seeming divergence? How much does the president’s approval rating actually matter for predicting congressional outcomes?
From a zoomed-out perspective, the answer is that there’s a reasonably strong relationship. If you knew nothing else about the race for Congress, you’d expect an unpopular president’s party to lose seats. And indeed, that’s likely what will happen this year, too. Republicans are an 87 percent favorite to take over control of the House, according to the Deluxe version of our forecast. The Senate remains much closer to a toss-up, but that has more to do with poor Republican candidates than anything the Democrats are doing well.
But predicting the number of seats lost in Congress based on the president’s approval rating is not quite the question we’re interested in from a forecasting standpoint. Rather, we want to know how much the president’s approval rating matters given all the other information we have about the race. In other words, is Biden’s poor approval already “baked in” to the congressional generic ballot polls and polls of individual House and Senate races? Or is there reason to think that the Democrats’ standing will get worse between now and November?
The statistical answer is that it’s mostly baked in. Warning: The following paragraphs are going to be a bit technical. If you want more of an intuitive answer, skip ahead to the bolded bullet points below.
The way our model addresses this is by looking at every congressional race since 1990 and evaluating how predictable the movement in the generic ballot has been based on baseline conditions, which we sometimes refer to as the “fundamentals.” Specifically, the factors it looks at include the president’s approval rating, the result of the previous election for Congress, whether or not the election is a midterm and the degree of political polarization. (Times of high political polarization — like now — will tend to produce less dramatic swings in races for Congress because there are fewer swing voters.)
Right now, those “fundamentals” expect Democrats to eventually lose the House popular vote by about 8 points, which would be an awful result for the party and would very likely result in its loss of both chambers of Congress. By comparison, if Biden had a breakeven approval rating instead of being about 17 points underwater, the “fundamentals” would predict Democrats to lose the popular vote by around 4.5 points, which would still mean almost certain doom in the House but might be enough for them to save the Senate.
However, the model also weighs those “fundamentals” against the current state of affairs. Right now, Democrats trail in our generic congressional ballot polling average — a proxy for the House popular vote — by about 2 points. But that’s actually more like a 4-point deficit among likely voters, since Republicans are likely to have a turnout advantage in November. Our model accounts for this, but the model also accounts for factors aside from the generic ballot in forecasting the House popular vote, and when we take into consideration those factors, our model predicts Democrats to lose the popular vote by almost 6 points, not that far from what the “fundamentals” show.
Even if there were a bigger gap, though, the “fundamentals” ultimately do not get all that much weight in the model. The reason is simply that, even at this fairly early point in the cycle, the generic ballot (at least if you properly adjust it to account for likely voters) and other indicators directly related to the current election have historically been more reliable predictors than the “fundamentals.” The model does expect conditions to get a bit worse for Democrats, but really just a bit.3
So what is the intuition behind this? Here are a few factors to keep in mind:
1. Voters have good reasons to disapprove of Biden without wanting Republicans in CongressWhen your approval rating has fallen into the 30s, you’ve not only lost the confidence of most swing voters but also some members of your own party. The Siena/New York Times poll, for instance, showed Biden with only a 70 percent approval rating even among Democrats. However, 90 percent of Democrats in that same poll prefer Democratic control of Congress, compared to just 4 percent who want the GOP in charge.
One concern for Democrats is that those disaffected voters won’t turn out. Still, there’s no particular reason to expect them to vote Republican if they do. A lot of them think Biden is too old — a concern also shared by many independent voters — but that’s more a factor for 2024 than in congressional preferences for 2022.
And on many issues — from abortion to LGBTQ rights to the integrity of the 2020 vote — Republicans are adopting highly right-wing, partisan positions that have little appeal to swing voters and might even motivate otherwise disaffected Democrats to turn out. Parties generally pay a penalty for ideological extremism. In other words, although Democrats have also adopted unpopular left-wing positions on many issues, Republicans aren’t as poised to capitalize on a high inflation and poor electoral environment for Democrats as a more moderate, less Trumpian version of the party would be.
This is just a good principle of statistical analysis. If you have a direct measure of the quantity that you’re interested in, there’s not much need for a proxy or an indirect one.
Suppose, for instance, that you’re trying to estimate the volume of home sales in — I don’t know — Indianapolis. You could imagine some clever ways to get at this. You could drive around town and count the number of “FOR SALE” signs. Or you could track the number of clicks on Zillow and other websites that list homes for sale. But all of that is beside the point because home sales can be directly measured, albeit with something of a lag until reports are compiled.
Likewise, if you’re interested in races for Congress, and you ask voters how they’re going to vote for Congress and also how they feel about the president, voters’ preference for Congress is the direct measure and the one that should be more reliable. It’s presumptuous, frankly, to suggest otherwise and to disbelieve a voter who says she disapproves of Biden but also wants Democrats to stay in charge of Congress.
In the national exit poll in November 2020, 52 percent had a favorable opinion of Biden and 46 percent had an unfavorable opinion. That’s considerably better than his numbers now, and Biden won a fairly comfortable victory in the popular vote. But, it also wasn’t the sort of sweeping mandate that, say, former President Barack Obama had in 2008, which was accompanied by approval and favorability numbers that initially soared into the 60s and 70s. Moreover, Democrats rode into Obama’s first term with 257 House seats, far more than the 222 they held after the 2020 election.
Part of the reason that the 2010 midterms were so awful for Democrats was because they had a long way to fall from being about as popular as a party probably could be in modern American politics. In 2022, Democrats don’t have that problem because they weren’t very popular to begin with. They barely held onto the House.
So while goodwill toward Biden may have been just enough to get him over the hump in 2020 — and a lot of that goodwill has now evaporated — conditions aren’t necessarily that different than they were two years ago. The major parties are both unpopular, there are few if any nationally beloved political figures and the country is highly polarized. What’s more, with unpopular former President Donald Trump potentially set to declare a 2024 bid soon, he could also be a factor in the race — maybe one that helps Democrats.
Finally, I’d note that if you had predicted some months ago that polls for Congress and Biden’s numbers would have converged toward one another, you would have been wrong. Since May 1, Biden’s approval rating has declined by about 15 points:
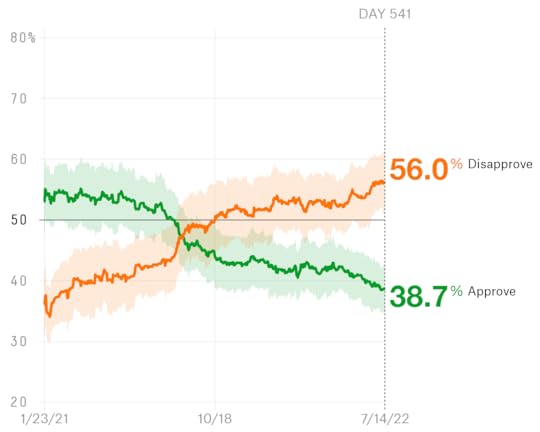
And yet, the generic ballot has been essentially unchanged:
Instead, as voters have gathered more information about the race, they have drawn more of a distinction between how they feel about Biden and what they’d like to see happen in Congress. Maybe this trend will reverse itself. But the “fundamentalists” — the analysts who think the races for Congress are predictable based on presidential approval and other baseline conditions — have been wrong so far.
July 11, 2022
July 8, 2022
Maybe Dobbs Did Change The Race. We’ll Need More Time To Know For Sure.
By Nate Silver
Jul. 8, 2022, at 8:34 AM

ILLUSTRATION BY EMILY SCHERER
It was a slow week of polling over the holiday weekend — happy birthday, USA — and the FiveThirtyEight midterm election forecast hasn’t changed much since we launched it last week. Republicans have an 86 percent chance of winning control of the House in November according to the Deluxe version of our model. But the Senate is much closer to a toss-up, with Republicans at a 53 percent chance of a takeover. Both of those numbers are pretty much the same as when we launched the model.
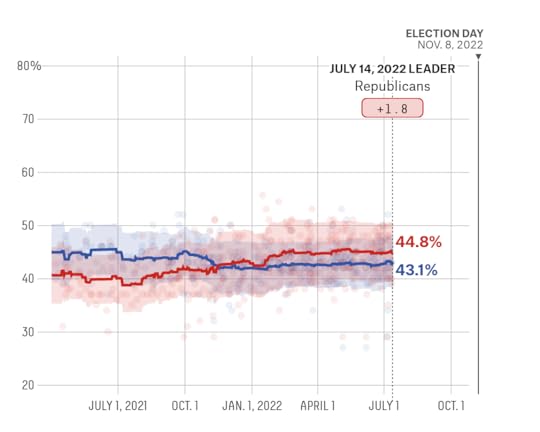
But we’ve seen some movement toward Democrats on the generic congressional ballot, which asks voters which party they would support in an election. Democrats now trail Republicans by 1.6 percentage points in the FiveThirtyEight average. That compares with a 2.3-point deficit on June 24, when the Supreme Court announced in Dobbs v. Jackson Women’s Health that it would overturn Roe v. Wade.
Why make a huge deal of the difference between 2.3 points and 1.6 points? Well, I’m not making a huge deal of it. But because of the way our polling average is designed, it’s a bigger deal than it might seem at first glance.
The truth is, when you design any sort of model, it’s rarely as simple as just following the data. Rather, you have a lot of choices to make. One of the most important ones is how sensitive a model or an average is to new data. It’s obviously possible to err in either direction. There’s a lot of noise in polling averages, and you don’t want a model that does acrobatics in response to every new poll, especially when it’s still many months out from the election and most voters are thinking more about what kind of meat to grill than about whom to elect to Congress.
But polls can and do change in response to big news, and Roe being overturned — probably the most well-known Supreme Court decision of the past 50 years — is big news.
Watch: https://abcnews.go.com/fivethirtyeigh...
Usually, the generic ballot is a noisy measure, and if you know nothing about what’s causing the changes, the best empirical strategy is to be quite conservative in updating the average. If the polls move by several points and there’s no real underlying cause, it’s probably just noise.
After all, most people — even most people who vote in congressional elections — are not following the news intensely on a day-to-day basis. Cable news ratings, for instance, reflect a tiny fraction of the American population: The most-watched cable news program is seen by something like 1 percent of Americans on a typical night.
So, in figuring out whether shifts in a polling average represent signal or noise, the model averages out lots of times when there’s nothing much going on and a few times when there is. The safe bet is usually “probably mostly noise, awaiting more evidence of signal.”
Watch: https://abcnews.go.com/fivethirtyeigh...
But given that we do have a huge story on our hands, let’s do a direct before-and-after comparison. Six pollsters1 have released generic ballot polls both before and after the Dobbs decision.2 All six of those polling firms have shown a shift toward Democrats. On average, Democrats trailed by 1.3 points in the pre-Dobbs version of these polls but led by 1.5 points in the most recent ones, a shift of almost 3 points toward the party.
Since Dobbs, generic ballot polls have shifted toward DemocratsGeneric ballot polls conducted before and after the Supreme Court’s Dobbs v. Jackson Women’s Health decision
Pollster Pre-Dobbs Post-Dobbs Shift Big Village D+1 D+6 D+5 Rasmussen Reports R+8 R+5 D+3 Emerson College R+3 R+2 D+1 Harris Poll R+2 EVEN D+2 YouGov/Yahoo News D+4 D+7 D+3 Morning Consult/Politico EVEN D+3 D+3 Average R+1 D+2 D+3“Pre-Dobbs” polls include the pollster’s most recent poll conducted before June 24, and “Post-Dobbs” polls include polls that went into the field on June 24 or later. Pollsters with “Pre-Dobbs” polls conducted before May 15 were excluded.
For pollsters that released results among both registered voters and all adults, the registered voter version of the poll is used.
Source: POLLS
If this persists, then our generic ballot average — and also our midterm model — will eventually catch up and move toward Democrats. Of course, that might not happen. The change could still be a statistical quirk. Or it could be temporary, an artifact of partisan nonresponse bias. That is, if Democrats are more engaged than Republicans by news of the Supreme Court’s decision — and there’s evidence to suggest they are — they may be more likely to respond to polls for some period of time, at least until the next news story takes hold. Then again, if Democrats are more motivated than Republicans to vote by the decision, that could help them in a real way in November, too.
Bottom line: Most of the time, polling averages are exceptionally useful, but be wary of using them in ways in which they weren’t intended. The FiveThirtyEight generic ballot polling average is designed to be conservative and slow-moving and not really equipped to deal with breaking-news developments.3 That our generic ballot polling average is steady in reaction to the news doesn’t really prove anything either way, then. But because of the Dobbs decision, there may be some electoral upside for Democrats beyond what our model currently shows.
Nate Silver's Blog

- Nate Silver's profile
- 729 followers

