
Nate Silver's Blog, page 11
September 26, 2022
Politics Podcast: Why Biden’s Unpopularity Doesn’t Seem To Be Tanking Democrats
A president’s approval rating is traditionally tied to how his party performs in a midterm election, but Democrats have been outpacing President Biden in the polls for months. In this installment of the FiveThirtyEight Politics podcast, the crew discusses how Biden’s approval rating may impact the midterm election and how the Democrats’ performance in November could influence the president’s 2024 reelection plans.
The team also debates whether tracking Google search terms over time is a better barometer than traditional polling when it comes to understanding the issues shaping American voting patterns. Lastly, politics reporter Alex Samuels and visual journalist Elena Mejía break down their reporting on how Black voters are changing the political landscape of Georgia.
You can listen to the episode by clicking the “play” button in the audio player above or by downloading it in iTunes , the ESPN App or your favorite podcast platform. If you are new to podcasts, learn how to listen .
The FiveThirtyEight Politics podcast is recorded Mondays and Thursdays. Help new listeners discover the show by leaving us a rating and review on iTunes . Have a comment, question or suggestion for “good polling vs. bad polling”? Get in touch by email, on Twitter or in the comments.


September 23, 2022
The Polls Still Do Not Show A GOP Bounceback
By Nate Silver
Sep. 23, 2022, at 1:49 PM
ILLUSTRATION BY EMILY SCHERER
Ever since we launched our election model in late June, it has moved entirely in one direction: toward Democrats. Pretty much every week, they’ve either gained ground in our forecast or held steady.
This week has been more in the “held steady” category. In the Deluxe version of our model, Democrats’ chances of keeping the Senate are 71 percent, while their chances of holding the House are 31 percent. Neither number has meaningfully changed from a week ago.
As Democrats’ position has continually improved, I’ve tended to focus on optimistic scenarios for Democrats. Frankly, I’ve been looking for an opportunity to reiterate why Republicans could still have a pretty good midterm. They are, after all, reasonably clear favorites to flip the House, and a 30 percent chance to flip the Senate is nothing to sneeze at, either. That 30 percent chance is pretty much the same one our model gave to Donald Trump against Hillary Clinton on Election Day in 2016.
But that Republicans could win doesn’t mean that their situation is improving. I’ve seen several recent claims about Republican momentum in the polls that I don’t think are yet justified in the evidence.
Let’s leave our probabilistic forecast aside for now and just look at the polls themselves. Specifically, we’ll look at what our polling averages say as I write this on Sept. 22 and how that compares to one month ago, on Aug. 22. A fair amount has happened since then: The White House announced its student loan forgiveness program on Aug. 24; there’s been some fairly negative inflation news and other economic data; Florida Gov. Ron DeSantis sent around 50 migrants to Martha’s Vineyard; Russia is facing significant setbacks in its war with Ukraine; and campaigns are kicking into higher gear in many states after Labor Day.
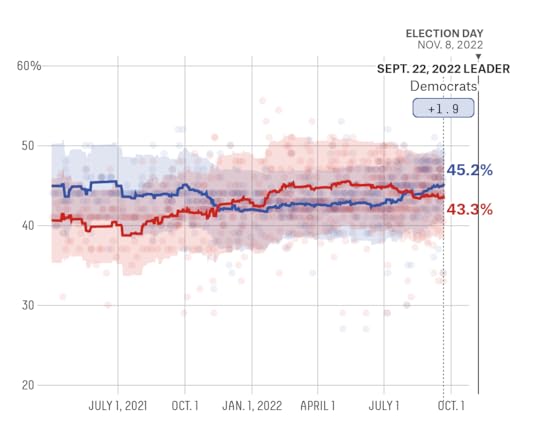
First up, the generic Congressional ballot. Democrats currently lead by 1.9 percentage points in our average. That reflects continued improvement from Aug. 22, when they led by 0.4 percentage points.
Our generic ballot average, however, is designed to be somewhat slow-moving — so if there’s been a recent reversal in the improving electoral environment for Democrats, it may be slow to detect it. Our presidential approval average is more aggressive, by contrast. As of Sept. 22 at 5 p.m. Eastern, Biden has a 42.5 percent approval rating and a 53.0 percent disapproval rating. That’s mediocre, although similar to where several other presidents have been in advance of their first midterm.
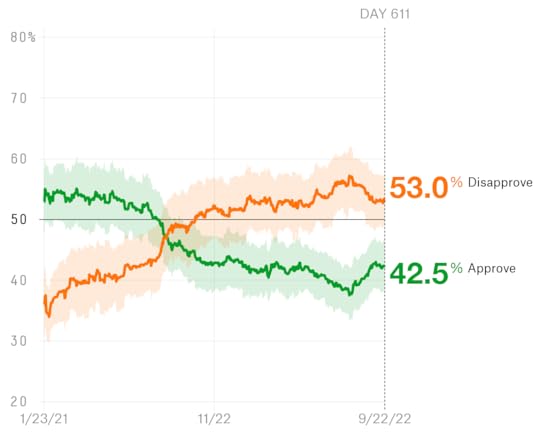
Nonetheless, those numbers are improved from Aug. 22, when Biden had a 40.9 approval rating against 54.3 percent disapproval.
What about individual Senate and gubernatorial races? FiveThirtyEight publishes polling averages in these races once there are a sufficient number of polls. Technically speaking, these polling averages are calculated separately from the version used by our forecast model, which performs various fancy adjustments to the polls (for instance, our model adjusts outdated polls based on changes in the generic ballot).
For the purposes of this article’s exercise, though, the comparative simplicity of our standalone polling averages should work well. So let’s look at all races where there have been a) at least two polls between the Supreme Court’s decision to overturn Roe v. Wade on June 241 and Aug. 22, and b) at least two polls between Aug. 22 and now. In these states, we have enough data to establish a post-Dobbs baseline and to see whether there’s been a meaningful shift. Eleven Senate races meet this criteria;2 here is how the polling average has changed in each one:
How the polling in key Senate races has changedDemocratic margin in FiveThirtyEight polling average for key Senate races on Aug. 22 and Sept. 22
FiveThirtyEight polling average as of … State 8/22/22 9/22/22 Arizona +8.3 +7.5 Colorado +10.0 +9.1 Florida -2.7 -3.8 Georgia +1.8 +2.0 Nevada +3.7 +0.7 New Hampshire +3.7 +7.3 North Carolina +0.1 -0.3 Ohio +1.0 -0.2 Pennsylvania +10.4 +8.9 Washington +12.9 +10.7 Wisconsin +2.6 0.0 Average +4.7 +3.8Includes Senate races in which there were at least two polls conducted between June 24 and Aug. 22, and at least two polls conducted from Aug. 22 to Sept. 22. Utah, where the race is between an independent and a Republican, is not included.
If you squint, you can see some movement toward Republicans. On Aug. 22, Democrats led by 4.7 percentage points in these races on average, and now they lead by 3.8 percentage points.
But few individual races have moved all that much. Republicans have gained at least a full percentage point in Florida, Nevada, Pennsylvania, Washington and Wisconsin, while Democrats have done so in New Hampshire.
Interestingly enough, this movement has often been in line with what the “fundamentals” in each race might have predicted. Most expert groups had rated races such as Wisconsin and Nevada as tossups, even though polls had shown Democrats ahead there. So this may just be reversion to the mean, given that neither race had been polled terribly often, rather than any actual shift in voter sentiment.
Finally, a look at gubernatorial races, using the same parameters as we did for the Senate races:
How the polling in key gubernatorial races has changedDemocratic margin in FiveThirtyEight polling average for key governor’s races on Aug. 22 and Sept. 22
FiveThirtyEight polling average as of … State 8/22/22 9/22/22 Arizona +3.3 +2.0 Florida -6.6 -5.6 Georgia -5.7 -5.1 Massachusetts +29.5 +25.3 Michigan +13.2 +12.2 Minnesota +4.8 +9.8 Nevada +2.1 +1.2 New Hampshire -26.2 -19.9 New York +18.4 +13.7 Ohio -14.5 -15.2 Pennsylvania +8.6 +10.5 Texas -8.9 -7.1 Wisconsin -0.4 +2.5 Average +1.4 +1.9Includes gubernatorial races in which there were at least two polls conducted between June 24 and Aug. 22, and at least two polls conducted from Aug. 22 to Sept. 22.
These don’t show any shift toward Republicans. On average, Democrats led by 1.4 percentage points on Aug. 22, and they lead by 1.9 percentage points now. Some individual races have changed, of course, but these moves have been in either direction. Democrats have gained at least a percentage point in Florida, Minnesota, New Hampshire, Pennsylvania, Texas and Wisconsin, while Republicans have done so in Arizona, Michigan, Massachusetts and New York.
We could go race by race and debate which of these shifts are “real” and which reflect noisy or low-quality polling. But that’s beside the point, which is that there hasn’t been any systematic rebound by Republicans. In the 24 gubernatorial and Senate races listed here, Democrats led by an average of 2.9 percentage points on Aug. 22, and they lead by 2.8 percentage points now. There’s been essentially no change, in other words.
Of course, that may not be true in the future. It may be too soon to see the impact of recent news stories in the polls. I tend to think DeSantis’s stunt in sending migrants to Massachusetts will engender more of a reaction on cable news and on Twitter than it will necessarily matter to normal swing voters. But a sustained focus on immigration could be worse for Democrats than one on other issues such as abortion. And as I wrote last week, our model does expect the political environment to get slightly better for Republicans between now and November.
Mostly, though, we’ve reached that part of the election cycle where you ought to be wary of media narratives about which party has “momentum.” There are a lot of competitive elections this cycle, and since Labor Day, we’ve started to see a lot more polling. It’s very, very easy to cherry-pick your way into a story that fits your preconceived notions about the race. But when there’s a major, nationwide shift in the race — as there was toward Democrats after the Dobbs decision — you usually don’t have to squint to see it.
The Polls Still Do Not Show A GOP Bounce Back
By Nate Silver
Sep. 23, 2022, at 1:49 PM
ILLUSTRATION BY EMILY SCHERER
Ever since we launched our election model in late June, it has moved entirely in one direction: toward Democrats. Pretty much every week, they’ve either gained ground in our forecast or held steady.
This week has been more in the “held steady” category. In the Deluxe version of our model, Democrats’ chances of keeping the Senate are 71 percent, while their chances of holding the House are 31 percent. Neither number has meaningfully changed from a week ago.
As Democrats’ position has continually improved, I’ve tended to focus on optimistic scenarios for Democrats. Frankly, I’ve been looking for an opportunity to reiterate why Republicans could still have a pretty good midterm. They are, after all, reasonably clear favorites to flip the House, and a 30 percent chance to flip the Senate is nothing to sneeze at, either. That 30 percent chance is pretty much the same one our model gave to Donald Trump against Hillary Clinton on Election Day in 2016.
But that Republicans could win doesn’t mean that their situation is improving. I’ve seen several recent claims about Republican momentum in the polls that I don’t think are yet justified in the evidence.
Let’s leave our probabilistic forecast aside for now and just look at the polls themselves. Specifically, we’ll look at what our polling averages say as I write this on Sept. 22 and how that compares to one month ago, on Aug. 22. A fair amount has happened since then: The White House announced its student loan forgiveness program on Aug. 24; there’s been some fairly negative inflation news and other economic data; Florida Gov. Ron DeSantis sent around 50 migrants to Martha’s Vineyard; Russia is facing significant setbacks in its war with Ukraine; and campaigns are kicking into higher gear in many states after Labor Day.
First up, the generic Congressional ballot. Democrats currently lead by 1.9 percentage points in our average. That reflects continued improvement from Aug. 22, when they led by 0.4 percentage points.
Our generic ballot average, however, is designed to be somewhat slow-moving – so if there’s been a recent reversal in the improving electoral environment for Democrats, it may be slow to detect it. Our presidential approval average is more aggressive, by contrast. As of Sept. 22 at 5 p.m. Eastern, Biden has a 42.5 percent approval rating and a 53.0 percent disapproval rating. That’s mediocre, although similar to where several other presidents have been in advance of their first midterm.
Nonetheless, those numbers are improved from Aug. 22, when Biden had a 40.9 approval rating against 54.3 percent disapproval.
What about individual Senate and gubernatorial races? FiveThirtyEight publishes polling averages in these races once there are a sufficient number of polls. Technically speaking, these polling averages are calculated separately from the version used by our forecast model, which performs various fancy adjustments to the polls (for instance, our model adjusts outdated polls based on changes in the generic ballot).
For the purposes of this article’s exercise, though, the comparative simplicity of our standalone polling averages should work well. So let’s look at all races where there have been a) at least two polls between the Supreme Court’s decision to overturn Roe v. Wade on June 241 and Aug. 22, and b) at least two polls between Aug. 22 and now. In these states, we have enough data to establish a post-Dobbs baseline and to see whether there’s been a meaningful shift. Eleven Senate races meet this criteria2; here is how the polling average has changed in each one:
How the polling in key Senate races has changedDemocratic margin in FiveThirtyEight polling average for key Senate races on Aug. 22 and Sept. 22
FiveThirtyEight polling average as of … State 8/22/22 9/22/22 Arizona +8.3 +7.5 Colorado +10.0 +9.1 Florida -2.7 -3.8 Georgia +1.8 +2.0 Nevada +3.7 +0.7 New Hampshire +3.7 +7.3 North Carolina +0.1 -0.3 Ohio +1.0 -0.2 Pennsylvania +10.4 +8.9 Washington +12.9 +10.7 Wisconsin +2.6 0.0 Average +4.7 +3.8Includes Senate races in which there were at least two polls conducted between June 24 and Aug. 22, and at least two polls conducted from Aug. 22 to Sept. 22. Utah, where the race is between an independent and a Republican, is not included.
If you squint, you can see some movement toward Republicans. On Aug. 22, Democrats led by 4.7 percentage points in these races on average, and now they lead by 3.8 percentage points.
But few individual races have moved all that much. Republicans have gained at least a full percentage point in Florida, Nevada, Pennsylvania, Washington and Wisconsin, while Democrats have done so in New Hampshire.
Interestingly enough, this movement has often been in line with what the “fundamentals” in each race might have predicted. Most expert groups had rated races such as Wisconsin and Nevada as tossups, even though polls had shown Democrats ahead there. So this may just be reversion to the mean, given that neither race had been polled terribly often, rather than any actual shift in voter sentiment.
Finally, a look at gubernatorial races, using the same parameters as we did for the Senate races:
How the polling in key gubernatorial races has changedDemocratic margin in FiveThirtyEight polling average for key governor’s races on Aug. 22 and Sept. 22
FiveThirtyEight polling average as of … State 8/22/22 9/22/22 Arizona +3.3 +2.0 Florida -6.6 -5.6 Georgia -5.7 -5.1 Massachusetts +29.5 +25.3 Michigan +13.2 +12.2 Minnesota +4.8 +9.8 Nevada +2.1 +1.2 New Hampshire -26.2 -19.9 New York +18.4 +13.7 Ohio -14.5 -15.2 Pennsylvania +8.6 +10.5 Texas -8.9 -7.1 Wisconsin -0.4 +2.5 Average +1.4 +1.9Includes gubernatorial races in which there were at least two polls conducted between June 24 and Aug. 22, and at least two polls conducted from Aug. 22 to Sept. 22.
These don’t show any shift toward Republicans. On average, Democrats led by 1.4 percentage points on Aug. 22, and they lead by 1.9 percentage points now. Some individual races have changed, of course, but these moves have been in either direction. Democrats have gained at least a percentage point in Florida, Minnesota, New Hampshire, Pennsylvania, Texas and Wisconsin, while Republicans have done so in Arizona, Michigan, Massachusetts and New York.
We could go race by race and debate which of these shifts are “real” and which reflect noisy or low-quality polling. But that’s beside the point, which is that there hasn’t been any systematic rebound by Republicans. In the 24 gubernatorial and Senate races listed here, Democrats led by an average of 2.9 percentage points on Aug. 22, and they lead by 2.8 percentage points now. There’s been essentially no change, in other words.
Of course, that may not be true in the future. It may be too soon to see the impact of recent news stories in the polls. I tend to think DeSantis’s stunt in sending migrants to Massachusetts will engender more of a reaction on cable news and on Twitter than it will necessarily matter to normal swing voters. But a sustained focus on immigration could be worse for Democrats than one on other issues such as abortion. And as I wrote last week, our model does expect the political environment to get slightly better for Republicans between now and November.
Mostly, though, we’ve reached that part of the election cycle where you ought to be wary of media narratives about which party has “momentum.” There are a lot of competitive elections this cycle, and since Labor Day, we’ve started to see a lot more polling. It’s very, very easy to cherry-pick your way into a story that fits your preconceived notions about the race. But when there’s a major, nationwide shift in the race — as there was toward Democrats after the Dobbs decision — you usually don’t have to squint to see it.
September 16, 2022
Will The Polls Overestimate Democrats Again?
By Nate Silver
Sep. 16, 2022, at 6:00 AM
ILLUSTRATION BY EMILY SCHERER
As Democrats’ prospects for the midterms have improved — they’re now up to a 71 percent chance of keeping the Senate and a 29 percent chance of retaining the House, according to the 2022 FiveThirtyEight midterm election forecast1 — I’ve observed a corresponding increase in concern among liberals that the polls might overestimate Democrats’ position again, as they did in 2016 and 2020. Even among commenters who are analyzing the race from an arm’s-length distance, there sometimes seems to be a presumption that the polls will be biased toward Democrats.
The best version of this argument comes from Other Nate (Nate Cohn, of The New York Times). He pointed out in a piece on Monday that states such as Wisconsin and Ohio where Democratic Senate candidates are outperforming FiveThirtyEight’s fundamentals index — like how the state has voted in other recent elections — were also prone to significant polling errors in 2020. Cohn’s analysis is worth reading in full.
Here, I’m going to present something of a rebuttal. Not necessarily to Cohn’s specific claims, but rather to the presumption I often see in discussion about polling that polling bias is predictable and necessarily favors Democrats. My contention is that while the polls could have another bad year, it’s hard to know right now whether that bias will benefit Democrats or Republicans. People’s guesses about this are often wrong. In 2014, for example, there was a lot of discussion about whether the polls would have a pro-Republican bias, as they did in 2012. But they turned out to have a pro-Democratic bias instead.
There’s one important complication to this, however. Our model actually assumes that current polling probably does overstate the case for Democrats. It’s just not necessarily for the reasons people assume.
As I mentioned, the Deluxe version of our forecast gives Democrats a 71 percent and 29 percent chance of keeping the Senate and House, respectively. But the Deluxe forecast isn’t just based on polls: It incorporates the fundamentals I mentioned earlier, along with expert ratings about these races. Furthermore, it accounts for the historical tendency of the president’s party to perform poorly at the midterms, President Biden’s mediocre (although improving) approval rating and the fact that Democrats may not perform as well in polls of likely voters as among registered voters. As the election approaches, it tends to put more weight on the polls and less on these other factors, but it never zeros them out completely. (In this respect, it differs from our presidential forecast.)
By contrast, the Lite version of our forecast, which is more or less a “polls-only” view of the race, gives Democrats an 81 percent chance of keeping the Senate and a 41 percent chance of keeping the House. It also suggests that they’ll win somewhat more seats: There are 52.4 Democratic Senate seats in an average Lite simulation as compared with 50.8 in a Deluxe simulation, or 212 Democratic House seats in an average Lite simulation versus 209 in a Deluxe simulation. Notably, this corresponds to current polls overstating Democrats’ position by the equivalent of 1.5 or 2 percentage points. Put another way, we should think of a race in which the polling average shows Democrats 2 points ahead as being tied.
That’s not quite the same thing as saying that the polls are systematically biased, though. Polls reflect a snapshot of what is happening today, and Democrats might indeed do very well if the election were held now instead of in November. In states like Ohio, for instance, they’ve enjoyed a significant advertising advantage thanks to superior fundraising, but that will probably even out to some extent by Election Day.
Meanwhile, Biden and Democrats have also been on something of a winning streak lately, between a series of policy accomplishments, inflation trending downward and the political backlash to the Supreme Court’s unpopular decision to overturn Roe v. Wade. But a worse-than-expected inflation report this week and a narrowly averted rail workers’ strike, which could have caused substantial supply chain disruptions, are reminders that uncertain real-world events won’t necessarily continue to play out in Democrats’ favor.
It’s also the case that in individual races, information besides the polls can help make a more accurate prediction, even when you have a lot of polls. For example, the partisan lean of a state still tells you something. Let’s say the polling average has the Democrat ahead by 10 points in a state where the fundamentals put the Republican up by 2. Empirically, the best forecast in a race like this uses a blend of mostly polls and some fundamentals (exactly how much weight is given to the polls depends on how many polls there are and how close it is to the election). And you might end up with a forecast that has the Democrat winning by 7 or 8 points rather than 10 points, for instance. In that sense, in races such as Wisconsin and Ohio where there is a significant divergence between polls and fundamentals, Democrats probably should have concerns.
What I resist, though, is the implication that it can be presumed that the polls have a predictable, persistent, systematic bias toward Democrats. Is Rep. Tim Ryan going to underperform his current polls in Ohio’s Senate race? We’ll see, but more likely than not, the answer is yes. But is it just a thing now that polls always overrate Democrats?
I’m skeptical. Here are seven reasons why:
1. Polling bias hasn’t been predictable historicallyOur historical database of polls shows that there’s not much in the way of consistent polling bias. Two cycles of a pro-Republican bias in 1998 and 2000 were followed by a Democratic bias in 2002. A fairly sharp Republican bias in 2012 reversed itself, and the polls were biased toward Democrats in both 2014 and 2016.
Polling bias isn’t consistentWeighted-average statistical bias in polls in final 21 days of the campaign
Pres. State Level Cycle General Governor U.S. Senate U.S. House Combined 1998 — R+5.8 R+4.5 R+0.9 R+3.8 1999-2000 R+2.4 R+0.2 R+2.8 D+1.2 R+1.8 2001-02 — D+3.5 D+2.0 D+1.4 D+2.6 2003-04 D+1.1 D+1.9 D+0.8 D+2.1 D+1.4 2005-06 — D+0.4 R+2.1 D+1.1 D+0.1 2007-08 D+1.0 R+0.1 D+0.1 D+1.4 D+0.9 2009-10 — R+0.2 R+0.8 D+1.3 D+0.4 2011-12 R+2.5 R+1.6 R+3.1 R+3.2 R+2.8 2013-14 — D+2.3 D+2.7 D+3.9 D+2.8 2015-16 D+3.3 D+3.1 D+2.8 D+3.4 D+3.0 2017-18 — R+0.9 EVEN R+0.8 R+0.5 2019-20 D+4.2 D+5.6 D+5.0 D+6.1 D+4.8 All years D+1.3 D+0.9 D+0.7 D+1.2 D+1.1Bias is calculated only for races in which the top two finishers are a Democrat and a Republican. Therefore, it is not calculated for presidential primaries. Pollsters that are banned by FiveThirtyEight are not included in the averages. So as not to give a more prolific pollster too much influence over the average, polls are weighted by one over the square root of the number of polls each pollster conducted in a specific category.
Historically, the correlation between the polling bias in a given cycle and the bias in the previous cycle is either essentially zero or slightly negative, depending on whether you define “previous cycle” as “two years ago” or “four years ago.”2
2. Pollsters have a strong incentive to be unbiasedPollsters get a lot of crap from people, but one nice thing about their job is that they regularly get to compare their results against reality. Sure, it’s possible for a pollster to get unlucky because of sampling error — if you survey 500 people, sometimes you’ll draw a sample showing the Republican winning even if the Democrat is really up by 5 points. For the most part, though, pollsters can and do consider changes to their methodology based on errors in past elections.
And precisely because pollsters are subject to public scrutiny and there are relatively objective ways to measure their performance, they have strong financial and professional incentives to scrutinize their methods for potential sources of error and fix them if they can. It’s the same incentive that a professional golfer has to fix his swing: If he’s consistently hitting every shot to the left side of the fairway, for instance, at some point he’ll make adjustments. Maybe he’ll even overcompensate and start hitting everything to the right side instead.
3. The way polling averages weight pollsters changesEven if pollsters don’t change their methods, the market will change the polling landscape on its own, at least to some degree. Pollsters who performed well in previous elections will get more business, and those who performed poorly will lose it.
For instance, we’ve seen relatively few traditional “gold standard” polls sponsored by major media organizations this cycle, perhaps because those polls tended to have a Democratic bias in 2020. That’s a shame, because most of these polling organizations have good long-term track records despite some recent problems. But it does mean that polling averages are more weighted toward Republican-leaning firms that have done comparatively well in recent election cycles, such as Rasmussen Reports and Trafalgar Group. This is especially true for FiveThirtyEight’s polling averages, which weight polls in part based on their historical accuracy. Groups like Rasmussen, for instance, get more say in the polling average than they did in 2020 because their rating is now higher.
4. Polls haven’t had a Democratic bias in elections without Trump on the ballotAs you can see in the table in the first point, polls did not have a systematic Democratic bias in 2018. That seems relevant, considering that was the most recent midterm.
Polls have also generally not had a Democratic bias in other elections in the Trump era when Trump himself was not on the ballot. They didn’t have one in the Alabama Senate special election in 2017, for instance, or the Georgia Senate runoffs in January 2021, or in last year’s Virginia gubernatorial race.
There have also been some races where Democrats have overperformed their polls, such as in last year’s California gubernatorial recall election and in the 2017 governor’s race in Virginia. But these errors don’t tend to get as much attention from the media as those that underestimated Republicans.
It may be that Republicans benefit from higher turnout only when Trump himself is on the ballot. A certain number of voters were willing to walk over glass to vote for Trump: Would they do the same for J.D. Vance, Mehmet Oz, Ron Johnson or Blake Masters? Evidence from non-Trump elections in the Trump era suggests maybe not. I tend not to buy the so-called “shy Trump” theory, or that voters are reluctant to state their preference for Trump. But it may nonetheless be hard to reach Trump voters, who may be more socially isolated, or who may be irregular voters who are screened out by likely voter models.
5. Polls have been unbiased or underestimated Democrats in recent elections in 2022Democrats have had a lot of success in elections since the Supreme Court’s Dobbs decision — and importantly for our purposes, they’ve done as well or better than polls predicted in these races:
In the Kansas abortion referendum, the only poll showed the “yes” side — which would have enabled the Kansas Legislature to implement additional abortion restrictions — winning by 4 percentage points, but it lost by 18 points (!) instead.Meanwhile, the only nonpartisan poll of the special election in Minnesota’s 1st Congressional District showed Republican Brad Finstad winning by 8 points, but he actually won by 4, although an internal poll released by his opponent did underestimate Finstad’s margin.That said, polls of the special election in Alaska’s at-large House seat were quite accurate in predicting both the first-round vote and that Democrat Mary Peltola would narrowly defeat former Alaska Gov. Sarah Palin if they were the final two candidates using Alaska’s ranked-choice system.Finally, of the five polls of the special election in New York’s 19th Congressional District, which were from a mix of Democratic and Republican firms, all showed Republican Marc Molinaro winning by margins ranging from 3 points to 14 points. But Democrat Pat Ryan won by 2 points instead.I couldn’t find any polls for the special elections in New York’s 23rd Congressional District or Nebraka’s 1st Congressional District, also held since the Dobbs decision.
6. Pollsters have a semi-decent excuse for 2020: COVID-19Ironically, polls conducted before large parts of the country were shut down in March 2020 in response to the COVID-19 pandemic were more accurate than those conducted immediately before Election Day in 2020. Take the FiveThirtyEight polling average on March 1, 2020. It showed Biden up by 4.1 percentage points nationally, very close to his eventual 4.5-point popular vote margin. Our polling averages also correctly showed a very close race in states such as Pennsylvania and Wisconsin.
This may be because the pandemic profoundly affected who answered the polls. Specifically, Democrats were more likely to be in jurisdictions that implemented stay-at-home orders, and liberals were otherwise more likely to voluntarily limit their social interactions. Having more time at home on their hands, they may have been more likely to respond to polls. That’s less of a concern this year, with few voters treating COVID-19 as a high priority and few government restrictions in place.
7. People are too hung up on polls from 2016 and 2020Elections have consequences, and they’re relatively infrequent events. So the second-guessing and recriminations tend to linger for a while.
But that doesn’t change the fact that people’s concerns about the polls stem mostly from a sample of exactly two elections, 2020 and 2016. You can point out that polls also had a Democratic bias in 2014. But, of course, they had a Republican bias in 2012, were largely unbiased in 2018, and have either tended to be unbiased or had a Republican bias in recent special elections.
True, in 2020 and 2016, polls were off the mark in a large number of races and states. But the whole notion of a systematic polling error is that it’s, well, systematic: It affects nearly all races, or at least the large majority of them. There just isn’t a meaningful sample size to work with here, or anything close to it.
Again, that doesn’t mean you should expect the polls to be spot-on. It may be that we’re living in a universe with larger polling errors than before in response to declining response rates. And there are some decent reasons to suspect that Democrats won’t perform as well in November as they would in an election right now. Still, I’ll stick to my usual advice: Prepare for the polls to be wrong — in either direction.
September 15, 2022
What’s Behind Democrats’ Improvement In Our Congressional Forecasts?
Why have Democrats’ odds of winning the House and Senate improved so consistently in recent months? Can the polls be trusted? In this installment of “Model Talk” on the FiveThirtyEight Politics podcast, Nate Silver and Galen Druke discuss what’s behind the recent movement in the forecast and answer questions from listeners.
Politics Podcast: It’s Not Yet Time To Start Worrying About The Polls
Why have Democrats’ odds of winning the House and Senate improved so consistently in recent months? Can the polls be trusted? In this installment of “Model Talk” on the FiveThirtyEight Politics podcast, Nate Silver and Galen Druke discuss what’s behind the recent movement in the forecast and answer questions from listeners.
You can listen to the episode by clicking the “play” button in the audio player above or by downloading it in iTunes , the ESPN App or your favorite podcast platform. If you are new to podcasts, learn how to listen .
The FiveThirtyEight Politics podcast is recorded Mondays and Thursdays. Help new listeners discover the show by leaving us a rating and review on iTunes . Have a comment, question or suggestion for “good polling vs. bad polling”? Get in touch by email, on Twitter or in the comments.
September 13, 2022
Republicans Can’t Agree On New Abortion Restrictions
While Republican lawmakers can’t agree on how restrictive abortion legislation should be in South Carolina and West Virginia, candidates running in the midterms are trying to distance themselves from the stricter abortion bans they supported earlier in their campaigns. In Part 3 of this installment of the FiveThirtyEight Politics podcast, the team breaks down how GOP lawmakers and candidates have been approaching potential policies on abortion after the Supreme Court’s Dobbs decision.
Why Are Senate Candidates Avoiding Debates?
Only two midterm debates for Senate races are scheduled so far. Plenty of candidates say they’re open to debating their opponents, but only on their terms, setting up stalemates as a result. In Part 2 of this installment of the FiveThirtyEight Politics podcast, the crew analyzes how debates can affect campaigns and why Senate candidates seem to be avoiding them this year.
King Charles III Isn’t Nearly As Popular As The Queen Was. Does That Matter?
In Part 1 of this installment of the FiveThirtyEight Politics podcast, we turn to the recent death of Queen Elizabeth II and the succession of her eldest son, King Charles III, whose popularity is significantly lower than the late monarch’s.
September 12, 2022
Politics Podcast: Does The Monarchy Rely On Public Approval?
Only two midterm debates for Senate races are scheduled so far. Plenty of candidates say they’re open to debating their opponents, but only on their terms, setting up stalemates as a result. In this installment of the FiveThirtyEight Politics podcast, the crew analyzes how debates can affect campaigns and why Senate candidates seem to be avoiding them this year.
Next, the team breaks down how GOP lawmakers and candidates have been approaching potential policies on abortion after the Supreme Court’s Dobbs decision. While Republican lawmakers can’t agree on how restrictive abortion legislation should be in South Carolina and West Virginia, candidates running in the midterms are trying to distance themselves from the stricter abortion bans they supported earlier in their campaigns.
Finally, we turn to the recent death of Queen Elizabeth II and the succession of her eldest son, King Charles III, whose popularity is significantly lower than the late monarch’s.
You can listen to the episode by clicking the “play” button in the audio player above or by downloading it in iTunes , the ESPN App or your favorite podcast platform. If you are new to podcasts, learn how to listen .
The FiveThirtyEight Politics podcast is recorded Mondays and Thursdays. Help new listeners discover the show by leaving us a rating and review on iTunes . Have a comment, question or suggestion for “good polling vs. bad polling”? Get in touch by email, on Twitter or in the comments.
Nate Silver's Blog

- Nate Silver's profile
- 729 followers

