
Nate Silver's Blog, page 106
April 17, 2017
Politics Podcast: Trump’s Paths, Revisited
Subscribe: Apple Podcasts |
ESPN App |
Download |
RSS |
New to podcasts?
The FiveThirtyEight Politics podcast crew assess the election results in Kansas’s 4th Congressional District and the prospects in Tuesday’s special election in Georgia’s 6th District. As the Trump administration approaches Day 100, they also look back on Nate Silver’s article about the 14 wildly different paths that Trump’s presidency could take. Have any paths become more likely than others?
You can listen to the episode by clicking the “play” button above or by downloading it in iTunes, the ESPN App or your favorite podcast platform. If you are new to podcasts, learn how to listen.
The FiveThirtyEight Politics podcast publishes Monday evenings, with occasional special episodes throughout the week. Help new listeners discover the show by leaving us a rating and review on iTunes. Have a comment, question or suggestion for “good polling vs. bad polling”? Get in touch by email, on Twitter or in the comments.


The Save Ruined Relief Pitching. The Goose Egg Can Fix It.

Hall of Fame relief pitcher Richard “Goose” Gossage isn’t the biggest fan of the “Moneyball” revolution. Here at FiveThirtyEight, we don’t think his expletive-laced tirades about nerds ruining baseball have always found their target the way his fastballs once did. But on one point, he’s absolutely right: The save is a stupid [bleep]ing statistic.
Gossage recently lashed out against modern closers — including all-time saves leader Mariano Rivera — arguing that they aren’t used in the right situations and that cheaply earned saves exaggerate closers’ value compared to the pitchers of his day. “I would like to see these guys come into more jams, into tighter situations and finish the game. … In the seventh, eighth or ninth innings. I don’t think they’re utilizing these guys to the maximum efficiency and benefit to your ballclub,” Gossage said. “This is not a knock against Mo [Rivera],” he continued later. “[But] I’d like to know how many of Mo’s saves are of one inning with a three-run lead. If everybody in that [bleep]ing bullpen can’t save a three-run lead for one inning, they shouldn’t even be in the big leagues.”
Gossage is right about pretty much all of that. A pitcher probably shouldn’t get much credit for handling just the final inning when his team has a three-run lead. Moreover, the top relief pitchers today are less valuable than they were in Gossage’s heyday in the 1970s and ’80s. In large part, that’s because managers are trying to maximize the number of saves for their closer, as opposed to the number of wins for their team. They’re managing to a stat and playing worse baseball as a result.
But there’s a solution. Building on the work of Baseball Prospectus’s Russell Carleton, I’ve designed a statistic and named it the goose egg to honor (or troll) Gossage. The basic idea — aside from some additional provisions designed to handle inherited runners, which we’ll detail later — is that a pitcher gets a goose egg for a clutch, scoreless relief inning. Specifically, he gets credit for throwing a scoreless inning when it’s the seventh inning or later and the game is tied or his team leads by no more than two runs. A pitcher can get more than one goose egg in a game, so pitching three clutch scoreless innings counts three times as much as one inning does.
The goose egg properly rewards the contributions made by Gossage and other “firemen” of his era, who regularly threw two or three innings at a time, often came into the game with runners on base, and routinely pitched in tie games and not just in save situations. I’ve calculated goose eggs for all seasons since 1930 — plus select seasons since 1921 — based on play-by-play data from Retrosheet. While Gossage ranks only 23rd in major league history with 310 saves, he’s the lifetime leader in goose eggs (677) — ahead of Rivera and every other modern closer.
PITCHER
SAVES
PITCHER
GOOSE EGGS
Mariano Rivera
652
Goose Gossage
677
Trevor Hoffman
601
Rollie Fingers
663
Lee Smith
478
Hoyt Wilhelm
641
Francisco Rodriguez
430
Mariano Rivera
614
John Franco
424
Lee Smith
589
Billy Wagner
422
John Franco
589
Dennis Eckersley
390
Trevor Hoffman
580
Joe Nathan
377
Bruce Sutter
557
Jonathan Papelbon
368
Tug McGraw
521
Jeff Reardon
367
Jeff Reardon
520
Troy Percival
358
Sparky Lyle
520
Randy Myers
347
Kent Tekulve
517
Rollie Fingers
339
Lindy McDaniel
507
John Wetteland
330
Mike Marshall
489
Francisco Cordero
329
Gene Garber
468
Roberto Hernandez
326
Ron Perranoski
444
Huston Street
324
Francisco Rodriguez
430
Jose Mesa
321
Todd Jones
425
Todd Jones
319
Billy Wagner
421
Rick Aguilera
318
Jesse Orosco
416
Robb Nen
314
Doug Jones
410
Tom Henke
311
Stu Miller
405
Goose Gossage
310
Roberto Hernandez
404
Jeff Montgomery
304
Randy Myers
404
Doug Jones
303
Darold Knowles
400
Career leaderboards for saves and goose eggs, 1930-2016
Plus select seasons since 1921
Source: Retrosheet
If managers want to squeeze every ounce of potential and talent out of their top relievers — maybe even doubling their value — it’s time to give up the save and embrace the goose.
Bullpens are still built around the save
While I come to bury the save, let me first sing some of its praises. The statistic, invented by the sportswriter Jerome Holtzman and officially adopted by Major League Baseball in 1969, came into the world with noble intentions. Relief pitchers were becoming more commonplace — the share of starts that ended in complete games would decline from 40 percent in 1950 to 22 percent in 1970. But these pitchers’ contributions were largely unheralded by fans, Holtzman correctly noted, because they rarely earned wins or losses and ERA did not reveal much about which relievers had been used in clutch situations.
Furthermore, some of the intuitions behind the save rule are correct. Modern statistics such as leverage index find that late-inning situations when a team holds a narrow lead are indeed quite important. For instance, an at-bat in the ninth inning when the pitcher’s team leads by one run has a leverage index of 3.3. That means it has more than three times as much impact on the game’s outcome as an average at-bat.
The problem is that there’s a fuzzy relationship between the most valuable relief situations and the ones that the save rewards. Take a look at the following chart, which shows the leverage index in different situations based on the inning and the game score:

Imagine that one evening, Pitcher A throws a scoreless eighth inning in a game where his team leads by one run — a situation that has a leverage index of 2.4 — before being pulled for his team’s closer. Meanwhile, in another ballgame on the other side of town, Pitcher B enters the game in the ninth inning when his team holds a three-run lead — a leverage index of just 0.9 — and gives up two runs but eventually records the final out. Pitcher A’s performance was quite valuable. Pitcher B’s was not — in fact, it was kind of crappy. But Pitcher B gets a save for his troubles whereas Pitcher A doesn’t. It doesn’t make a lot of sense.
There are other problems with the save, also. It doesn’t give a pitcher any additional reward for pitching multiple innings — even though two clutch innings pitched in relief are roughly twice as valuable as one. And a pitcher doesn’t get a save for pitching in a tie game, even though it’s one of the highest-leverage situations.
I know I’m not breaking much news here: Stat geeks have been complaining about the save for years. But don’t modern, post-“Moneyball” teams know better than this? Aren’t they using their best relievers in the highest-leverage situations, whether or not they yield a save? In a word: no. (In 11 words: Mostly not, except maybe for the Cleveland Indians and Andrew Miller.) The next table reflects how teams used their closers (as defined by closermonkey.com, a site that tracks bullpen usage obsessively) over the course of 2016, as measured by the number of innings the closer pitched in different situations:
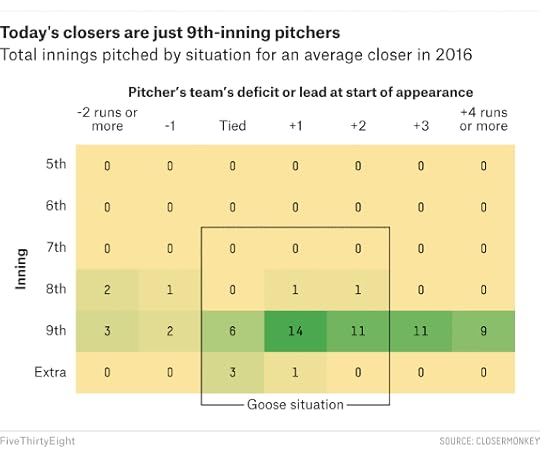
The typical modern closer is really just a ninth-inning specialist. In 2016, the average closer threw 66 innings, and 56 of them came in the ninth inning. This included 11 innings in games where his team led by three runs in the ninth — a save situation, but not a high-leverage one. Conversely, it included just six innings in tie games in the ninth, which is not a save situation but is one of the highest-leverage situations you can find.
Again, this is pretty much how you’d use your bullpen if the goal was to maximize the number of saves for your closer (instead of the number of wins for your team). Managers seem so conditioned by the “only use your closer in the ninth inning with a lead” heuristic that they often use their closers in the ninth inning when their team leads by more than three runs, which is a not a save situation and is even more of a waste of the closer’s supposed talent. Baseball teams have supposedly reached a state of statistical enlightenment — but their closer usage is every bit as stubborn as NFL teams’ too-frequent refusal to go for it on 4th down.
Defining a goose egg
If managers were thinking about goose eggs rather than saves, they’d find plenty of better ways to use their best relievers. So let’s define a goose egg, officially. Just as for the save rule, the formal definition is a bit more complicated than the quick-and-dirty version I described above. But here goes:
A relief pitcher records a goose egg for each inning in which:
It’s the seventh inning or later;
At the time the pitcher faces his first batter of the inning:
His team leads by no more than two runs, or
The score is tied, or
The tying run is on base or at bat
No runs (earned or unearned) are charged to the pitcher in the inning and no inherited runners score while the pitcher is in the game; and
The pitcher either:
Records three outs (one inning pitched), or
Records at least one out, and the number of outs recorded plus the number of inherited runners totals at least three.
You’ll notice that the rules are more forgiving to pitchers who enter the game with runners on base, since these cases can have much higher leverage indexes than situations where the bases are empty. For instance, if a pitcher enters the game with two runners on and records a single out without allowing a run, he’ll earn a goose egg.
But the rule is strict about what it means by a scoreless inning. An unearned run cooks a goose egg, just as an earned run does. (The eggs are delicate.) And a pitcher doesn’t get a goose egg if a run scores while he’s in the game, even if the run was charged to another pitcher.
Overall, these rules can yield high goose-egg totals among many types of relievers, not just closers. That’s clear when you look at the goose egg leaderboard for 2016, for example. The Indians’ Miller and the Mets’ Jeurys Familia tied for the major league lead with 42 goose eggs last year, but Familia was used as a typical modern closer (and led the majors with 51 saves) while Miller often entered the game in the seventh or eighth inning. Mets setup man Addison Reed tied for fourth in the majors with 39 goose eggs last season, meanwhile, even though he had just one save.
TRADITIONAL STATS
GOOSE STATS
PITCHER
INNINGS PITCHED
ERA
W-L
SAVES
BLOWN SAVES
GOOSE EGGS
BROKEN EGGS
Jeurys Familia
77.2
2.55
3-4
51
5
42
7
Andrew Miller
74.1
1.45
10-1
12
2
42
7
Zach Britton
67.0
0.54
2-1
47
0
40
1
Addison Reed
77.2
1.97
4-2
1
4
39
5
Tyler Thornburg
67.0
2.15
8-5
13
8
39
7
Nate Jones
70.2
2.29
5-3
3
9
38
8
David Robertson
62.1
3.47
5-3
37
7
36
7
Sam Dyson
70.1
2.43
3-2
38
5
36
5
Roberto Osuna
74.0
2.68
4-3
36
6
35
4
Kelvin Herrera
72.0
2.75
2-6
12
3
35
9
Kenley Jansen
68.2
1.83
3-2
47
6
34
6
Familia, Miller tied for goose-egg lead in 2016
ERA and W-L record cover relief appearances only
Sources: FanGraphs, Retrosheet
Miller and Familia’s league-leading total would have been paltry by Gossage’s standards, however. In addition to being the lifetime leader in goose eggs, he’s also the single-season leader, having recorded 82 goose eggs (almost as many as Miller and Familia combined) in 1975, when he threw 141.2 (!) innings in relief for the Chicago White Sox.
The top firemen of Gossage’s day routinely had 60 goose eggs or more in a season, with their totals sometimes reaching into the 70s or — in the case of Gossage in 1975 and John Hiller in 1974 — the 80s.
Just one pitcher since 2000 — the Angels’ Scot Shields in 2005 — has had as many as 60 goose eggs in a season, however. These days, it’s rare for a pitcher to record even 50 goose eggs. League-leading goose-egg totals have plummeted even as saves have risen. The turning point seems to have been 1990, when Bobby Thigpen and Dennis Eckersley both beat the single-season saves record while rarely working more than one inning at a time. In the 1970s and 1980s, the average league leader in saves threw 112 innings over 69 appearances. Since 1990, by contrast, the average saves leader has also appeared in 69 games but has thrown only 71 innings.
THROUGH 1989
SINCE 1990
YEAR
PITCHER
GOOSE EGGS
YEAR
PITCHER
GOOSE EGGS
1975
Goose Gossage
82
1992
Doug Jones
67
1974
John Hiller
80
2005
Scot Shields
60
1965
Stu Miller
79
1990
Bobby Thigpen
56
1969
Ron Perranoski
79
1993
John Wetteland
56
1973
Mike Marshall
79
1996
Trevor Hoffman
55
1977
Rich Gossage
74
1993
Jeff Montgomery
54
1963
Dick Radatz
73
1996
Mariano Rivera
54
1965
Bob Lee
72
1998
Robb Nen
53
1964
Dick Radatz
71
2004
Brad Lidge
53
1979
Kent Tekulve
71
1998
Trevor Hoffman
51
1970
Lindy McDaniel
70
2000
Danny Graves
51
1983
Bob Stanley
70
2011
Jonny Venters
51
1950
Jim Konstanty
69
1997
Trevor Hoffman
50
1980
Doug Corbett
68
2011
Tyler Clippard
50
1965
Eddie Fisher
66
1991
Mitch Williams
48
1974
Tom Murphy
66
1993
Jim Gott
48
1974
Mike Marshall
66
1997
Jeff Shaw
48
1977
Sparky Lyle
66
2007
Heath Bell
48
1978
Rollie Fingers
66
1991
Paul Assenmacher
47
1980
Bruce Sutter
66
1992
Lee Smith
47
1972
Tug McGraw
65
1996
Roberto Hernandez
47
1979
Sid Monge
65
1996
Troy Percival
47
1980
Dan Quisenberry
65
1998
Jeff Shaw
47
1982
Bill Caudill
65
2003
Eric Gagne
47
1984
Willie Hernandez
65
2004
Tom Gordon
47
2004
Mariano Rivera
47
2008
Francisco Rodriguez
47
2014
Tony Watson
47
Single-season goose-egg leaderboard, 1930-2016
Plus select seasons since 1921.
Source: Retrosheet
Broken eggs and GWAR
(goose wins above replacement)
Having only learned about the goose egg a few moments ago, you might still be a little suspicious of it. Sure, closers are pitching fewer innings than they used to and getting fewer goose eggs. But perhaps they’re pitching more efficiently and providing more overall value as a result? It goes without saying that pitchers like Miller and Zach Britton are really good at their jobs.
To properly value relievers, we need a companion statistic called the broken egg, which is to a goose egg as a blown save is to a save. (I wanted to call this companion stat a “blown goose,” but my editors decided that vaguely dirty jokes were the hill they wanted to die on.) We’ll define it as follows:
A relief pitcher records a broken egg for each inning in which:
He could have gotten a goose egg if he’d recorded enough outs;
At least one earned run is charged to the pitcher; and
The pitcher does not close out the win for his team.
In other words, you get a broken egg when you could have gotten a goose egg but are charged with an earned run instead, with an exemption if you get the last out of the game. Note that this leaves some situations that result in neither goose eggs nor broken eggs, which we’ll say are a “meh.” For instance, if a run scores while you’re in the game but it isn’t charged to you, that’s neither a goose egg or a broken egg; it’s a meh. I’ll speak no more of mehs in this article because they’re pretty boring; when I use the phrase “goose opportunity,” it means a goose egg or a broken egg.
There are usually about three goose eggs for every broken egg, meaning that relievers convert about 75 percent of their goose opportunities. And unlike saves and blown saves, which are highly punitive to guys who aren’t closers, the goose system gives middle relievers a fair shake. For instance, Mark Eichhorn — a good-but-not-great middle reliever for the Blue Jays and other teams in the 1980s and ’90s — converted 76 percent of his lifetime goose opportunities, about the same rate as an average closer.
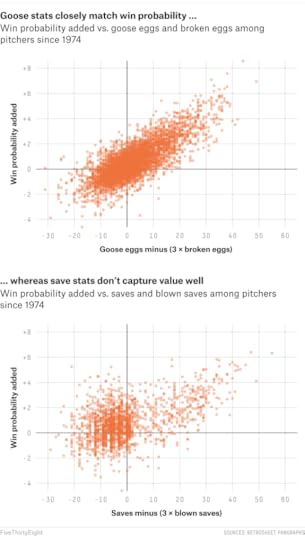
Goose eggs and broken eggs — when taken together — also do a good job of replicating more complicated statistics. For instance, there’s a 0.78 correlation between a simple linear combination of these stats and the highly sophisticated statistic win probability added (WPA), which is arguably the best way to value relief pitchers. WPA is a lot of work to calculate, however, so goose eggs and broken eggs get you to mostly the same place but are relatively simple counting statistics. Saves and blown saves, on the other hand, have a much noisier relationship with WPA (a correlation of 0.50).
But if you take your statistics with an extra helping of rigor — and if you’ve read this far, you probably do — there are a few more things to consider. It’d be nice to adjust performance for a pitcher’s park and league; it was a lot easier to convert goose opportunities at Dodger Stadium in the low-offense 1960s than at Coors Field during the juiced-offense era. We’d also like to know how valuable a late-inning reliever is, which will require some notion of what the replacement level is for the goose statistic. Considering that a lot of high-performing closers — including Rivera — were once middling starters, is the job really that challenging?
To answer those questions, we need to create another new stat: goose wins above replacement (GWAR). To do that, I went back to the history books. Over time, the number of goose opportunities per game has increased (as teams pull their starting pitchers earlier) while the success rate for converting them has varied. The offense-friendly era from 1993 through 2009 was a rough one for relief pitchers, who converted a middling 73.8 percent of their goose opportunities. The best relievers from this era, such as Rivera and Trevor Hoffman, might be slightly underrated without considering this context. But since 2010, which has seen a revival of pitching, the goose-egg conversion rate has improved to 76.5 percent.
YEARS
ERA
AVERAGE GOOSE OPPORTUNITIES PER GAME
CONVERSION RATE
1921-1940
Lively Ball Era
0.28
73.8%
1941-1945
World War II
0.21
77.2
1946-1962
Postwar Era
0.53
75.9
1963-1972
Neo-Deadball Era
0.71
77.5
1973-1992
Balanced Era
0.79
76.3
1993-2009
Juiced Offense Era
0.84
73.8
2010-2016
Strikeout Era
0.92
76.5
Goose opportunities are increasing
Source: Retrosheet
To determine the goose replacement level, I looked at the performance of pitchers since 1996 who made no more than 150 percent of the league’s minimum salary and who were acquired in free agency, on waivers, or through the Rule 5 draft. Essentially, these are the guys who are available to any major league team at any time for next to nothing — the literal definition of replacement-level players. But they actually weren’t too bad in goose situations. They converted 71.5 percent of their goose opportunities during this period, as compared to 74.7 percent for the league as a whole. To put that in more familiar terms, these relievers had a 3.91 ERA, weighted by their number of goose situations, as compared to a 3.64 weighted ERA for the league overall.
Therefore, a team shouldn’t be spending a lot for average relief pitching — the average relievers just aren’t that much better than the replacement-level guys. Pick up a few failed starters off the waiver wire, tell them to limit their repertoire to their two best pitches, and test them out in Triple-A or in low-leverage situations. You won’t necessarily have the next Gossage or Miller — those guys are scarcer and more valuable commodities — but you’ll probably find a couple of pretty good late-inning relievers without paying a lot to do it.
A complete formula for GWAR, which adjusts for a pitcher’s park as well as his league and converts performance in goose situations to wins, can be found in the footnotes.20
The best relievers of all time, according to goose
Even with all this extra work, however, we come to basically the same conclusion that we did before: Most of the best relief seasons came a long time ago, and from pitchers who followed Gossage’s usage pattern rather than Rivera’s.
YEAR
NAME
GOOSE EGGS
BROKEN EGGS
CONV. %
REPLACEMENT-LEVEL CONV. %
GWAR
1965
Stu Miller
79
7
91.9%
75.0%
7.5
1975
Goose Gossage
82
11
88.2
74.3
6.7
1996
Mariano Rivera
54
6
90.0
68.7
6.6
1969
Ron Perranoski
79
13
85.9
72.2
6.6
1996
Troy Percival
47
3
94.0
69.0
6.5
1984
Willie Hernandez
65
7
90.3
73.1
6.4
1980
Doug Corbett
68
10
87.2
71.8
6.3
1967
Ted Abernathy
51
3
94.4
72.5
6.2
1977
Sparky Lyle
66
8
89.2
73.3
6.1
1993
Jeff Montgomery
54
7
88.5
69.5
6.0
2000
Keith Foulke
42
3
93.3
67.7
6.0
1993
John Wetteland
56
6
90.3
71.8
6.0
1970
Lindy McDaniel
70
9
88.6
74.2
5.9
1999
Billy Wagner
44
4
91.7
68.0
5.9
1973
John Hiller
59
7
89.4
72.2
5.9
1972
Tug McGraw
65
6
91.5
75.9
5.8
1963
Dick Radatz
73
11
86.9
73.9
5.7
1988
John Franco
56
5
91.8
73.8
5.7
1979
Aurelio Lopez
54
7
88.5
70.6
5.7
1988
Doug Jones
51
5
91.1
71.6
5.7
1987
Tim Burke
42
2
95.5
70.7
5.7
1977
Bruce Sutter
62
10
86.1
71.1
5.6
1979
Kent Tekulve
71
13
84.5
71.7
5.6
1982
Bill Caudill
65
10
86.7
72.4
5.6
1969
Wayne Granger
59
9
86.8
71.0
5.6
1979
Bruce Sutter
63
11
85.1
70.9
5.5
2002
Eric Gagne
46
3
93.9
72.5
5.5
1983
Dan Quisenberry
60
11
84.5
69.8
5.4
2004
Joe Nathan
41
2
95.3
71.1
5.4
1982
Greg Minton
63
8
88.7
74.1
5.4
2004
Mariano Rivera
47
4
92.2
71.8
5.4
2004
Eric Gagne
46
5
90.2
69.8
5.4
1978
Gene Garber
52
7
88.1
70.5
5.4
2008
Brad Lidge
34
0
100.0
69.5
5.4
1979
Joe Sambito
52
6
89.7
71.8
5.4
1998
Trevor Hoffman
51
5
91.1
72.7
5.4
1955
Ray Narleski
44
2
95.7
73.3
5.4
2016
Zach Britton
40
1
97.6
72.6
5.3
1969
Tug McGraw
46
4
92.0
71.6
5.3
1983
Bob Stanley
70
17
80.5
68.8
5.3
Single-season goose wins above replacement (GWAR) leaderboard, 1930-2016
Plus select seasons since 1921
Sources: Retrosheet, baseball-reference.com
The best relief-pitching season of all time, according to this metric, belongs to Stu Miller, who had 79 goose eggs and just 7 broken eggs for the 1965 Baltimore Orioles. Miller’s traditional numbers looked pretty good that year — he went 14-7 with a 1.89 ERA and 24 saves in 119.1 innings pitched, finishing seventh in American League MVP balloting. His goose stats make it clear that he was almost unhittable in high-leverage situations, however. He contributed 7.5 wins above replacement according to GWAR, which is a Cy Young Award-caliber performance.
After Miller’s 1965 comes Gossage’s 1975, and then there’s a year from Rivera. But Rivera’s best season according to GWAR was not 2004, when he had a league-leading and career-high 53 saves, but 1996, when he was used as a setup man to John Wetteland and had just 5 saves in 107.2 innings of 2.09 ERA relief. Rivera was promoted to closer the next year, but his value declined as the Yankees held him to 71.2 innings despite the success he’d had in the fireman role.
Only two of the top 40 relief seasons have come in the past 10 years. You can be literally almost perfect — as Britton and his 0.54 ERA were last year — and yet still not provide as much value as pitchers like Gossage did because you didn’t have enough volume in high-leverage situations.
The lifetime GWAR leaderboard is somewhat more forgiving to modern closers. Rivera tops the list, with Hoffman second and Gossage third:
NAME
GOOSE EGGS
BROKEN EGGS
CONV. %
REPLACEMENT-LEVEL CONV. %
GWAR
Mariano Rivera
614
108
85.0%
70.5%
54.6
Trevor Hoffman
580
113
83.7
71.6
43.7
Goose Gossage
677
146
82.3
73.1
39.4
Billy Wagner
421
80
84.0
69.8
37.0
John Franco
589
132
81.7
72.0
36.3
Tug McGraw
521
101
83.8
73.0
34.9
Jonathan Papelbon
361
52
87.4
71.7
33.7
Troy Percival
354
64
84.7
69.4
33.3
Hoyt Wilhelm
641
146
81.4
73.8
31.3
Joe Nathan
344
53
86.6
71.9
30.4
Francisco Rodriguez
430
87
83.2
71.9
30.3
Bruce Sutter
557
134
80.6
72.2
30.3
Todd Jones
425
101
80.8
69.7
30.2
Lee Smith
589
156
79.1
71.6
28.9
John Wetteland
307
62
83.2
69.9
25.6
Jeff Reardon
520
130
80.0
72.5
25.4
Rollie Fingers
663
164
80.2
74.3
25.3
Robb Nen
314
60
84.0
71.2
24.8
Stu Miller
405
81
83.3
73.7
24.3
Randy Myers
404
92
81.5
72.2
23.9
Armando Benitez
331
73
81.9
70.7
23.6
Kent Tekulve
517
134
79.4
72.5
23.4
Huston Street
325
63
83.8
72.2
23.3
Roberto Hernandez
404
111
78.4
69.8
23.3
Tom Henke
357
81
81.5
71.4
23.1
Ron Perranoski
444
99
81.8
73.7
22.8
Lindy McDaniel
507
130
79.6
72.9
22.3
Dan Quisenberry
380
87
81.4
72.3
22.1
Jeff Montgomery
360
89
80.2
70.8
21.8
Sparky Lyle
520
130
80.0
73.6
21.6
Dave Giusti
305
54
85.0
73.4
21.5
Dennis Eckersley
352
81
81.3
72.0
20.8
Todd Worrell
350
80
81.4
72.2
20.7
Jose Valverde
252
45
84.8
71.6
20.5
Mike Henneman
306
67
82.0
71.6
20.2
Bob Wickman
344
92
78.9
70.2
19.7
Keith Foulke
263
62
80.9
69.3
19.7
Dave Smith
347
78
81.6
73.0
19.2
Dave Righetti
372
92
80.2
72.2
19.2
Craig Kimbrel
227
34
87.0
73.0
19.0
Career goose wins above replacement (GWAR) leaderboard, 1930-2016
Plus select seasons since 1921
Sources: Retrosheet, baseball-reference.com
So perhaps you can argue that modern closer usage at least helps the best relievers to preserve their longevity, even if it almost certainly doesn’t maximize their value over the course of a given season. Then again, Rivera and Hoffman and Billy Wagner might just have been freaks; there’s been a ton of turnover in the closer ranks lately. Of the top 10 pitchers in saves in 2011, only three were still in the league in 2016, and only one (Craig Kimbrel) was still regularly working as a closer. As long as teams are burning through relief pitchers, they might as well try to get more value out of their best ones.
So how should an ace reliever be used?
Managers have a lot of room for improvement if they forget about saves and use goose eggs as a bullpen guide. A bare-bones workload for a goose-optimized closer would look something like this:
Pitch in all goose situations, including ties, in the ninth inning. For a typical team, that works out to about 40 or 45 innings over the course of the season.
Pitch in goose situations in the eighth inning when his team leads by one run exactly, with the plan of usually also pitching the 9th when the game remains in a goose situation. This will add another 15 innings or so.
Pitch in any goose situations in extra innings, up to a maximum of two total innings pitched for the game. Keep in mind that this will often be impossible because the closer will already have been used earlier in the game. Still, this should amount to another five or 10 innings in a typical season.
That will work out to a total of around 65 innings pitched for the season — about the same number that closers throw now — over roughly 50 appearances. But those innings would come with a super-high leverage index of about 2.5. And the pitcher would go from around 40 or 45 goose opportunities in a season to 60 or 65 instead, potentially generating nearly 50 percent more value as a result.
For an older or injury-prone closer (say, the Los Angeles Angels’ Huston Street), that might be basically all the work they could handle. But there are lot of teams that might want to replicate MiIler’s success, and there are younger, fitter pitchers who could build on this minimal workload. Depending on the day, they could enter in the eighth inning in tie games, for instance. And they could come into the game with runners on, even in the seventh inning; it can be worth using your best reliever to get your team out of a jam in these cases even if you have to remove him from the game later. A pitcher picking up some of these situations might wind up throwing 85 or 90 innings — and a roughly equal number of goose opportunities — over the course of a season in which he makes 60 or 65 appearances. Those pitchers could have roughly double the value that modern closers do. It’s really not that radical a shift from how pitchers are used now.
But it doesn’t have to stop there. Modern teams have about 150 goose opportunities in a season. One day, they’ll find a guy with the right genetics and the right mentality to throw two or three innings every second or third day — someone who really could approach Gossage’s usage pattern — and when that happens, Gossage’s 82-goose-egg single-season record might come under threat. It would be a high bar to clear. But it would be an accomplishment worth chasing down, whereas a save record usually isn’t.
You can download detailed data on goose eggs and broken eggs for all pitchers since 1930 here.

Handicapping The Georgia 6 Special Election
If the polls are right, then Democrat Jon Ossoff will receive by far the most votes in Georgia’s 6th Congressional District, which is holding a special election to replace former U.S. Rep. Tom Price on Tuesday. But Ossoff will probably finish with less than 50 percent of the vote, which would trigger a runoff between him and the next-highest finisher — most likely the Republican Karen Handel, but possibly one of three other Republicans (Bob Gray, Dan Moody Judson Hill) who are closely bunched behind her in polls.
Furthermore, the combined vote for all Republican candidates will probably exceed the combined vote for Ossoff and other Democrats, although it should be close. And the district has historically been Republican-leaning, although it was much less so in the 2016 election than it had been previously. All of this makes for a fairly confusing set of circumstances and a hard-to-forecast outcome.
But we can gain some insight by evaluating the results of past elections to Congress in California, Louisiana and Washington, which follow a similar structure to the Georgia special election. That is to say, they have a first round or nonpartisan blanket primary in which unlimited numbers of candidates from all parties compete against one another, and a second round in which the top two candidates advance to a runoff. This data allows us to come to a handful of broad conclusions:
First, the aggregate party margin — whether Democrats or Republicans receive more votes overall — indeed has some predictive power for forecasting runoff results. It’s a useful thing to look at.
But so does the top-two margin — that is, which candidate wins the first round, and by how much.
Of these measures, the aggregate party margin is somewhat more predictive. But when there’s a split between them — say, the Democrat is the top finisher but Republicans win the aggregate vote — the runoff could usually go either way.
The runoff often winds up being a lot different than what you might expect from the first round, as the dynamics of a multiway race and a two-way race aren’t that similar to one another. Uncertainty is inherently fairly high.
Metrics such as the overall partisanship of a district — as measured by its relative presidential margin, for instance (how it votes for president as compared to the rest of the country) — may be more predictive of runoff outcomes than the first-round results.
Apply these principles to the Georgia 6 race, and you’ll conclude that Tuesday night’s first round won’t actually resolve that much — unless Ossoff hits 50 percent of the vote and averts the runoff entirely. (That’s an unlikely but hardly impossible scenario given the fairly high error margins of polls under these circumstances.) Even if Ossoff finishes in the low 40s, it will be hard to rule him out in the second round provided that he still finishes in first place by a comfortable margin. But even if Ossoff finishes just a point or two shy of 50 percent, and Democrats finish with more votes than Republicans overall, he won’t have any guarantees in the runoff given that it’s a Republican-leaning district and that the GOP will have a chance to regroup. With the runoff not scheduled until June 20, there will be lots of time for speculation about what the first round meant — and a lot of it will be hot air.
While I’ve already given away the conclusion, let’s walk through the evidence in a bit more detail. First, here’s where polls have the race, using an average of the most recent surveys from SurveyUSA, Opinion Savvy, Landmark Communications, Lake Research Partners, Meeting Street Research, Revily, Red Racing Horses and Clout Research, with undecideds allocated proportionately among the candidates.
CANDIDATE
DEMOCRATS
REPUBLICANS
Jon Ossoff
46
Karen Handel
18
Bob Gray
13
Dan Moody
9
Judson Hill
9
Ron Slotin
1
David Abroms
1
Other Republicans
1
Other Democrats
1
Total by party
48
51
Ossoff has a big lead, but Democrats are under 50 percent
Average of recent polls from SurveyUSA, Opinion Savvy, Landmark Communications, Lake Research Partners, Meeting Street Research, Revily, Red Racing Horses and Clout Research, with undecideds allocated proportionately.
Ossoff has polled at a raw 42 percent on average between these polls, but he gets up to 46 percent given his portion of the undecided vote. Handel is the top Republican, at 18 percent after allocating undecideds, with Gray following her at 13 percent. Republicans combined have 51 percent of the vote, however, whereas Democrats have 48 percent.
If Tuesday’s results wound up exactly like this — with Republicans winning the aggregate party vote by 3 percentage points, but Ossoff winning the top-two margin by 28 points over Handel — then what would the outlook be for the second round?
With help from my colleague Aaron Bycoffe, I found 181 elections to Congress (either the House or the Senate) since 2008 in California, Louisiana and Washington, which used the two-stage format and in which a Republican squared off against a Democrat in the runoff. Then I ran a regression to predict the runoff margin based on the aggregate party margin and the top-two margin. It came up with the following formula:
Runoff margin = .66 * Aggregate party margin + .22 * Top-two margin
Note that the coefficient is larger on the aggregate party margin than top-two margin — that’s the regression’s way of saying that the aggregate party margin is the more important indicator. However, the top-two margin — that is, who actually won the first round — shouldn’t be overlooked. Out of 21 races in our database where a candidate won the plurality in the first round but her party lost the aggregate party vote, the candidate nevertheless won the runoff 11 times. For instance, Republicans combined got more of the vote in Washington’s U.S. Senate primary in 2010, but Democratic incumbent Patty Murray got the plurality of the vote. Murray went on to win the second round over Republican Dino Rossi.
Plugging Ossoff’s numbers into the formula above, we come up with a projection that he’d win the runoff by 4 percentage points. So that sounds pretty good for him, right? Well, yes … it would be pretty good. But not more than pretty good, because he has some other things to worry about. For one thing, the margin of error in the calculation is quite high. Specifically, it’s about 8 percentage points for projecting one candidate’s vote share in the runoff, or 16 percentage points (!) for projecting the margin between the candidates. First-round results only tell you so much in these cases.
And then there’s the partisanship of the district to consider. In Louisiana’s Senate election in 2014, Democratic incumbent Mary Landrieu received 42 percent of the vote in the first round, a plurality. But she improved only to 44 percent in the runoff, easily losing to Republican Bill Cassidy. There just weren’t enough Democratic votes to go around in Louisiana. Could Ossoff suffer from a similar problem?
Perhaps, but the partisanship of Georgia’s 6th District is hard to gauge. Former Republican speaker Newt Gingrich represented the district for 20 years. And in 2012, it voted for Mitt Romney by 23 percentage points, according to data compiled by Daily Kos Elections. But last year, it chose Donald Trump over Hillary Clinton by less than 2 percentage points. Like other well-educated, Sunbelt suburbs, it was one of the bright spots for Democrats in what was otherwise a tough election.
Because of this ambiguity, the results in Georgia 6 are going to be hard to benchmark. An Ossoff win would unambiguously be good news for Democrats. But a narrow loss could be anywhere from disappointing to encouraging for them, depending on the margin and whether you think 2016 represented the new normal in the district. If judged by its 2012 results, merely coming within single digits in Georgia 6 would count as a decent result for Democrats, as was the case in a special election in the Kansas’s 4th Congressional District last week. If we’re going by 2016, by contrast, Democrats ought to be competitive in the district as a matter of course — and they should be winning their fair share of races there when the national climate is even moderately Democratic leaning.
To measure district partisanship at FiveThirtyEight, we use the past two presidential elections, but weight them 75-25 in favor of the most recent election. We also compare the district to how the country voted overall, instead of looking at its raw vote totals. By our formula, Georgia 6 comes out as an R +10 district, meaning that it’s a net of 10 points more Republican than the country as a whole. (That is, in an election where the Republican and Democratic candidates tied in the national popular vote, you’d expect the Republican to win by 10 point in Georgia 6). That’s the sort of district that wouldn’t be competitive in a neutral year, but could easily become competitive if the national environment were friendly to Democrats.
If it seems like I’ve taken a lot of time to parse this district’s partisanship, that’s because it matters quite a lot for forecasting purposes. If you test a district’s presidential margin in the runoff elections I described above, it turns out to be more important than either the aggregate party margin or the top-two margin from the first round of voting. Put another way, these nonpartisan primaries can be weird — parties and voters sometimes face counterintuitive tactical choices — and therefore they may not be that informative. But in an environment when congressional and presidential voting are increasingly correlated, the long-term partisanship of a district can tell you a lot.
To get back to Georgia 6, we can now use the following formula to project the runoff results:
Runoff margin = .53 * Relative presidential margin + .35 * Aggregate party margin + .19 * Top-two margin
As I mentioned, the relative presidential margin is Republican +10 in the district. And Republicans project to win the aggregate party margin by 3 points on Tuesday. But Ossoff projects to win the top-two margin by 28 points. Apply the formula, and it shows a photo-finish for the runoff, with the Republican projected to win by 1 percentage point — effectively a toss-up given the formula’s high margin of error.
We’re almost getting to the point where this has turned into (gulp) a model rather than just a quick-and-dirty way to take the pulse of the race. And if this were a full-fledged model, there are a couple of other things we’d want to consider. For one thing, it’s probably safe to conclude that we’re in a somewhat Democratic-leaning environment right now, given Trump’s poor approval ratings, a modest Democratic advantage on the generic congressional ballot and the results of last week’s special election in Kansas. That should mitigate some of Georgia 6’s Republican lean. For another thing, a couple of polls, such as this one, have tested prospective runoff matchups, and they’ve usually shown Ossoff a percentage point or two ahead of Handel and other Republicans. It’s not much of a “lead,” but it suggests that a runoff might at least be a toss-up for him.
As of Sunday evening, betting markets gave Ossoff about a 40 percent chance of eventually being the next member of Congress from Georgia 6, whether by winning a majority of the vote on Tuesday or prevailing in the June runoff. While that isn’t a ridiculous assessment, it looks too pessimistic on Ossoff. If the polls are right, the outcome of a runoff is more like a true 50-50 proposition — plus, there’s an outside chance that Ossoff could win outright on Tuesday. We’ll have a better sense for the odds after Tuesday, although perhaps not that much better given the uncertainties I described above.
But I generally think the conventional wisdom has been too slow to catch up with the fact that midterm and off-year elections are often problematic for the president’s party, and especially when the president is as unpopular as Trump. What might seem like an extraordinary feat — Democrats flipping Gingrich’s old seat — is going to be more commonplace in an environment like this one.

April 12, 2017
What Do We Know About The 2018 Midterms Right Now?
In this week’s politics chat, we look ahead to the 2018 midterm elections. The transcript below has been lightly edited.
micah (Micah Cohen, politics editor): Greetings, everyone. Our question for today: What do we know about the 2018 midterms right now? What metrics/trends/things should 2018 enthusiasts be looking at?
So, first up: How would you describe the political environment right now? (And does that even matter for what happens in a year and a half?)
natesilver (Nate Silver, editor in chief): Cloudy with a chance of landslide. An anti-Trump/GOP landslide, that is.
perry (Perry Bacon Jr., senior writer): President Trump’s approval numbers, at least right now, are bad. George W. Bush in 2006 or Barack Obama 2014 bad. That is not good for Republicans.
harry (Harry Enten, senior political writer): Yeah, the environment is not Republican friendly. It often isn’t friendly to the president’s party in the lead up to a midterm, but this is really bad. The president’s approval rating is just 41 percent. That’s the worst ever at this point in a presidency. Then there’s the generic ballot; an average of the generic ballot polls so far has the Republican Party down 6 percentage points. That’s the worst ever for the majority party in Congress at this point.
Now, does that matter? Things shift, but it’s certainly a poor starting position for the GOP.
clare.malone (Clare Malone, senior political writer): God I want to say something contrarian here. But I don’t think I can, really, given, ya know, reality.
natesilver: Contrarianism isn’t allowed here at FiveThirtyEight, Clare.
micah: Says the uber-contrarian.
perry: The counter, I think, is the map. Lots of Senate seats in red states are up in 2018. Lots of House races in districts that were conservative leaning pre-Trump.
micah: OK, but what about the second half of my question? I assume a lot can change before November 2018.
natesilver: I guess the way I see it is this: My prior is that a midterm is usually quite bad for the president’s party. So the default is that Republicans fighting an uphill battle. You could make an argument that we don’t have that much reason to deviate from the default yet. But the default is still pretty bad.
clare.malone: It also depends on whether or not there are sustained efforts among Democrats at the state level to make sure their voters turn out, especially post-health care battle. That issue was a big thing for people to rally around. Democrats are trying to make the whole “make Trump release his taxes” thing happen this weekend, but I think they’re going to have to find other offensive (as opposed to defensive) strategies to keep the base active.
harry: This is not for this year, but we know from the past that, if anything, the generic ballot tends to move against the party in power in the year running up to the midterms. So just talking about the fundamentals, the environment may actually get worse for Republicans.
natesilver: And obviously Perry is right that the Senate map isn’t very friendly to Democrats, but that’s different from the political environment per se. If you had a Republican-leaning environment at the midterms, maybe the GOP would gain six or seven Senate seats given the map. In the Democratic-tinged environment we’ll probably have, however, maybe they’ll just break even. That’s still a huge difference.
perry: Can the environment change? Trump could get more popular. I think?
clare.malone: For sure.
natesilver: There are two opposing forces here: On the one hand, presidents tend to get less popular over time. On the other hand, they tend to revert to the mean so, e.g., very unpopular presidents might be more likely than not to rebound at some point. Right now — because Trump’s approval ratings are already so low — I think it’s reasonable to assume his numbers are about equally likely to fall further or to rebound some.
Although, that assessment doesn’t consider any circumstances pertinent to Trump in particular. It just says “given a president with a 40 percent approval rating 80 days into his term, what would you expect his approval rating to be in six months”? And the answer is probably about 40 percent, but with a huge margin of error around that.
If Trump’s in some sort of death spiral because he’s overmatched for the job, you could argue the case for its being lower. But to some extent, we’re out on a limb because no president has been so unpopular so soon into his term.
perry: Clare hinted at what I think is an interesting question about the Democrats. We are seeing really strong activism, but that is different than midterm turnout. The activism could predict higher turnout. Or not.
clare.malone: Right … they still don’t have a message besides “Trump bad.”
natesilver: At the midterms, I’m more likely to take signs of activism/energy seriously than I would for a presidential general election.
micah: So in terms of whether the political winds stay blowing in Democrats’ favor or swing around towards the GOP, does it all basically come down to Trump? Or does it somewhat depend on what Democrats do?
To Clare’s point, this Democratic tax day thing seems a bit weak sauce to me.
clare.malone: A lot of it is on Democrats, IMO. It doesn’t seem that Trump can get much less popular unless something breaks with Russia or he drowns a kitten on live TV or something. It seems more likely that he stays the same or gets a little more popular because people find what he’s doing relatively harmless or they get used to Trump talk.
natesilver: I want to contradict your contrarianism, Clare. There are lots of ways that Trump could get less popular. If his supporters feel like he’s not delivering on his promises, that’s a big risk. And remember, his favorability rating has been in the 35 percent range at points in the past, so — although comparing approval and favorability numbers is slightly apples-to-oranges — he isn’t even at the low end of his own historical range.
harry: Enthusiasm about who people were supporting was a big leading indicator of Republican success in 1994, 2010, and 2014. Same for Democrats in 2006. So I’m big on enthusiasm in midterms.
clare.malone: What’s Trump’s lowest range? I’d like to be able to fathom the depths!
natesilver: He had a 35 percent favorability rating for long stretches of the 2016 election. And actually bottomed out toward 30 percent when he was having problems with his fellow Republicans last spring.
harry: But I’m less sure about Trump’s individual numbers. I know what they mean now, but those can move around. That’s why I’m also interested in congressional numbers like the generic ballot. Why look to the wheat when you can look to the pasta, if you catch my drift.
natesilver: I have no idea what you mean.
clare.malone: “Look into the pasta”?
micah: Harry, please go sit in the corner.
natesilver: “Why look to the wheat when you can look to the pasta.”
clare.malone: Is that like, “read the tea leaves”? Except wack.
micah: Except it doesn’t make any sense whatsoever.
Anyway, let’s keep going on my “how much does it matter what Democrats do?” question a little more.
perry: I would frame the Democrats’ question this way: The people at the town halls will vote. But that is not a majority in most districts. What happens to black turnout? Latino turnout? Turnout among people who often drop off at midterms even if they voted in the presidential election? Turnout of people under 35? Those are important questions. I don’t know the demographics of the town hall attendees, but the pictures are often of older, white women.
clare.malone: But maybe not the white women they need…
micah: So maybe Democrats should be spending all their time readying their GOTV operation and sorta trust that the anti-Trump passion will take care of itself?
clare.malone: See, this is the problem with the Democrats’ resistance messaging if it doesn’t shift a little pre-midterms: They risk alienating all those people who are on the margins, who might have voted for Trump but have regrets. They still haven’t landed squarely on an economic message. They’re still prosecuting the “unfit for office” line. No one wants to hear that after a while. Negativity wears.
Yeah, if you hate Trump, you’re gonna hate him in a year.
You gotta persuade now.
perry: I think a totally negative message, no real vision, can work in a midterm. But it does require your base to vote.
natesilver: I think negative can work, too. But it can be a mix of negative message against Trump and a negative message against the Republican Party — and maybe also a negative message against incumbency/“the system” — depending on the state or district.
harry: We’re dealing with a very small subset of House elections off of which we think Republicans have a turnout advantage in midterms. Go back to 2006 and it disappears. That was the year with bigly Democratic enthusiasm (as I showed above). I’m also not convinced the midterm gap is that large. You see that in Patrick Ruffini’s numbers in Pennsylvania. Let’s put it this way, if Democrats hold a 9 percentage point advantage on the generic ballot as Marist recently found, then they’re going to make big gains. So I think it’s more about persuasion than about turnout, but both are important. I’ll also add that the onus is less on the Democrats than in a presidential election. That’s a choice. This is a referendum on the party in power.
perry: Interesting.
natesilver: Go hard anti-Trump in suburban, Sunbelt districts such as Georgia 6, hard anti-Paul Ryan in some of the Midwestern districts that have flipped to the GOP, hard anti-establishment out West, and you can put a fair number of districts in play.
perry: You guys are saying most of the districts they need to flip are not full of very liberal constituencies anyway?
clare.malone: Not Sunbelt suburbs, necessarily.
micah: That’s why the all-negative strategy doesn’t make sense to me. They need to flip GOP/Trump-won districts.
harry: Yes, but remember if Trump is unpopular, then he’ll be underwater in those districts, too.
clare.malone: I will also point out here that a fair number of competitive districts are in California. Which can have interesting Sunbelt-esque characteristics in certain parts.
natesilver: People aren’t voting for a Democratic agenda, though. Because Democrats can’t really get anything done as long as Trump’s in the White House*. So in some sense, it’s more honest and accurate to say “we’re running as a check on Paul Ryan and Donald Trump.”
*Unless Trump actually tries to bargain with Democrats, which could be interesting.
micah: OK, what else should 2018 watchers be looking at? Candidate recruitment?
harry: Candidate recruitment and retirements.
clare.malone: Orrrrrriinnnnnnnnnnn!
Orrin Hatch might retire (he gave what I read to be a soft “I will run”), in which case we might see the resurrection of Mitt Romney and that would be totally fascinating to have him on the national scene.
perry: Democrats say people are coming out of the woodwork to run. Question is 1. fundraising. Everyone is not going to raise Jon Ossoff money. 2. Candidate recruitment. I would say this might be more important on the Republican side, in Senate races, if they are trying to knock off Joe Manchin or Claire McCaskill. The numbers are potentially there. Are the candidates?
clare.malone: Not that I know of?
harry: In Missouri, maybe. Republicans will have a strong candidate in Ann Wagner to take on McCaskill.
clare.malone: It’ll be interesting to see if the small-dollar fundraising goes places with any candidates — Our Revolution, the Bernie Sanders-associated PAC might try to make moves on that.
natesilver: By the way, this is how the Kansas and Georgia special elections matter a lot, too. If Democrats were to win one of those — or, I guess, make it a photo finish in Kansas — you’re going to see a HUGE boost in recruitment, and also perhaps a fair number of GOP retirements.
micah: FYI for readers: We’re chatting late on Tuesday, before the results from Kansas 4 are finalized. [Editor note: Republican Ron Estes won, but not by much.]
perry: That is a good point. Candidates are looking for signs this is a good environment. Basically everyone Democrats wanted to run in 2006 eventually did, as it became clear it was a good time to run.
Our assumption in this conversation is the House is the story. That Democrats are more likely to gain the majority there than the GOP is likely to get 60 seats in the Senate, which would also be huge. Is that assumption correct?
micah: I think that’s correct.
harry: If there was a Democratic president there’d be a good shot for Republicans to get to 60. I could see them getting to 56 seats in a good year under Trump. But 60 seems hard. They’d have to go and win a number of purple seats. A poll just out from Virginia has Tim Kaine up by 20+ percentage points over possible Republican opponents.
natesilver: Republicans aren’t gonna get 60 seats — or even come close — unless there’s a Sept. 11-like event that makes Trump super popular. They’re more likely to lose the Senate than to get 60 seats, IMO.
And much more likely to lose the House.
perry: That is what I think, too. But Trump and his team were talking about winning 60 Senate seats maybe two months ago, before the travel ban and health care debacles.
micah: OK, so what else is there to pay attention to?
natesilver: Governor’s races obvs. Including the one in Virginia this year.
clare.malone: That seems likely to go Democratic, at this point. Both Democrats — Tom Perriello and Ralph Northam — are polling better than Ed Gillespie, the Republican.
perry: Interesting. Gillespie is as un-Trump as you can get.
harry: The latest Quinnipiac poll has the Democrats up around 10 percentage points.
natesilver: Could Perriello be a 2020 candidate, though?
harry: Doug Wilder tried to run in 1992 after winning Virginia’s governor’s race in 1989, so it’s not crazy.
clare.malone: I mean, what are you gonna do with yourself after just one term?
Lotsa excess energy to expend.
perry: In 2018, I think you have several GOP governors in big states who are term-limited. That gives Democrats an opportunity.
micah: Yeah, overall the governors map is basically the inverse of the Senate map, right?
harry: Lots of Republican governors up for re-election or term-limited, though the correlation between the national environment and governor races is less clear than for federal elections.
micah: Clare, did Perriello seem like presidential material to you? Maybe not in 2020, but someday?
perry: Donald Trump is president.
micah: lol. Fair point.
clare.malone: He’s certainly a smart, ambitious guy. Has lived overseas (foreign policy plaudits.) I’m sure the thought of running for president has crossed his mind, if not uttered in private.
perry: I guess the question I would be curious about: Is there a Democratic governor who if he or she won re-election in 2018 would be a 2020 contender?
micah:
I.
love.
this.
game.
perry: I can’t think of one. This is perhaps a weakness of the party.
clare.malone: What about senator? Sherrod Brown used to get mentioned for things. He might be too old? I don’t know anymore.
perry: I missed that Micah was being sarcastic!
micah: I wasn’t!
clare.malone: Micah’s a sick, twisted dude, Perry.
perry: Brown is up in 2018, so are Amy Klobuchar and Christopher Murphy, so they can’t do all of the presidential hinting I think they would do otherwise
harry: I’d say the only governor who could potentially be popular with the base whose seat is up in 2018 is John Hickenlooper in Colorado, but he’s term-limited.
clare.malone: Right, if Brown lost, would he run?
natesilver: There’s nothing wrong with 2020 speculation, just like there’s nothing wrong with having a beer on a Sunday afternoon.
micah: I hate the “it’s too soon” act political reporters do. For one, they f*cking love talking about this stuff — why pretend otherwise? Secondly, Trump aside, running for president takes a lot of prep work. The contenders don’t think it’s too soon.
micah: OK, let’s close out with the special elections.
We’re chatting about this before the Kansas 4 results come in, but I’ve never seen U.S. House special elections get so much attention!
natesilver: Apparently you don’t remember Dede Scozzafava in 2009.
These things always get a fair amount of attention. You could have a good argument about whether it’s too much attention or too little.
perry: These races are important, for two reasons. 1. Every seat matters and winning Georgia 6 gets Democrats one seat closer. 2. As Nate said, wins/close losses could motivate the Democrats’ base to get even more involved. But if Ossoff loses, that may be a problem for Democrats. All of this hype, and nothing.
harry: Special elections in the whole can be predictive. That is, if Democrats outperform what we expect across many races, then that’s a good sign for Democrats. What we don’t want to do is look at individual results and draw big conclusions.
I’m also not looking at wins and losses. I’m looking at the margin relative to the presidential lean.
What I'll be keeping an eye on in upcoming special elections. Started with CA-34 last week and continues with KS-04 this week. pic.twitter.com/tNZwG51uoY
— (((Harry Enten))) (@ForecasterEnten) April 9, 2017
If Republicans start seeing that Democrats are doing well compared to the presidential lean across the board, it could hurt their recruiting.
natesilver: I do wonder if expectations have changed to the point where even a narrow win in Georgia 6 would be taken as an OK sign for Republicans. And, yeah, expectations are dumb — they’re basically just another word for media spin — but to the extent Georgia 6 could affect something like candidate recruitment, the narrative coming out of the race could matter.
harry: Yeah, I think that’s where binary win/loss can matter, is recruitment. And expectations have gotten crazy in Georgia 6. There hasn’t been a single poll that has Ossoff close to getting the 50 percent necessary to avoid a runoff.
clare.malone: It’s just a place for people to expend their excess energy, I think (Georgia 6). That’s part of the phenom.
micah: I think that’s right.
Since this chat will publish after the Kansas results are in, anyone bold enough to make predictions now?
Bueller?
You’re all chickens. I’ll say R +14.
clare.malone: Someone will make a “What’s the Matter With Kansas?” headline pun.
perry: I literally know nothing about this race except for what I read in Harry’s story. Republican by 16.
natesilver: R+9.
micah: “Nate Silver Predicted Close Race In Kansas House Election”
natesilver: Oh please stop, Micah.
perry: Lol. Can I tweet that? #dontgetfired
micah: Haha.
clare.malone: Nate, I hear you’re endorsing Jon Ossoff, right?
micah: I heard that, too.
OK, closing thoughts?
natesilver: Closing thought: My experience has been that people don’t adjust their expectations quickly enough to how bad the midterm/off-year environment usually is for the president’s party. They certainly didn’t in 2014, 2010, 2006.
So, yes, there are absolutely some reasons for skepticism in terms of how many gains Democrats could make. They face a problematic map, Trump could get more popular, #theresistance could turn out to have more bark than bite, etc. But I think people are forgetting how rough these things usually are for the president’s party. The modal case at this point is that the House gets very interesting, Democrats pick up several governor’s seats, and the Senate is maybe a wash (because only because of the GOP’s very favorable map). That’s the default.
So I’m looking for evidence to deviate from the default. A close race in Georgia 6 would actually be pretty consistent with the default. A close race in Kansas 4, on the other hand, would be more genuinely surprising and would suggest that Democrats had a lot of upside.

April 10, 2017
Are The Cavs Overrated Or Underrated?
The Cleveland Cavaliers haven’t been any good lately. And I don’t just mean their loss Sunday against the Atlanta Hawks, in which they became only the third team in NBA history to blow a 26-point fourth-quarter lead. They’re 12-13 since the All-Star break. They have one of the NBA’s worst defenses, having allowed 107.9 points per 100 possessions — in the same territory as the Orlando Magic and the New York Knicks. They haven’t won a road game against a Western Conference playoff team all season. But handicappers think LeBron James and company have a pretty good chance of winning their second-straight NBA title anyway.
Their view depends on their belief in the existence of Playoff LeBron, a superhero that transcends his already-formidable regular season form to carry his team to ever-greater heights. The good news for Cavs’ fans is that Playoff LeBron exists. He just might not be mighty enough to drag this team to a title.
On the basis of their regular-season record and point differential, this season’s Cavs have been in the same general vicinity as teams such as the Boston Celtics, Toronto Raptors and Utah Jazz. Those teams are variously 30-to-1 to 100-to-1 longshots to win the title, according to Vegas bookmakers. But the Cavs are nonetheless the second-favorite team to win the championship, with a 20 to 25 percent chance according to bookmakers.
Computer systems disagree. All of them have the Warriors as odds-on favorites to win the title, with the San Antonio Spurs as the next-best bet, and the Cavs as part of an undistinguished mass of teams beneath them. ESPN’s BPI puts Cleveland’s chances at just 4 percent. Basketball-Reference’s playoff odds also have them at 4 percent. And FiveThirtyEight’s Elo-based ratings, which heavily weight recent play, have them even lower at just 2 percent.
Usually, Elo-type ratings mimic betting markets fairly well. We give the Warriors a 65 percent chance of winning the title, for instance, and the San Antonio Spurs an 11 percent chance — right in line with where markets have them. So what accounts for the huge difference on Cleveland?
One explanation is that this is all just sort of irrational: the Cavs are a marquee team and bettors just can’t stomach the idea that they’re just the Raptors with better uniforms. But I’m not sure I totally buy that; NBA betting markets are usually fairly sharp.
Instead, bettors expect the Cavs to find a higher gear in the postseason. This isn’t an idea they just came up with; it was already priced into their assessment of the Cavs before the year began. At the start of the NBA season, FiveThirtyEight’s projections forecast the Cavs to win 57 regular-season games. (They have 51 now, so they’ll finish with no more than 53 wins.) That forecast was almost the same as what Vegas gave them, which put their over-under at 56.5 wins. But we also gave the Cavs only an 11 percent chance of winning the title whereas Vegas put them at 5-to-2 against, or a 29 percent chance. In other words, handicappers and the computer models agree on “regular-season Cavs.” It’s just that Vegas thinks that “playoff Cavs” are different — and much better — whereas our Elo ratings make no such distinction.
But is there good reason to think that Cleveland can turn it up a notch?
It’s not hard to recall examples of defending champions that lollygagged their way through the regular season, only to show up as the best version of themselves in the playoffs. In 2000-01, Shaquille O’Neal, Kobe Bryant and the Los Angeles Lakers finished with a 56-26 record — better than the Cavs this year, but not by that much — before winning 15 of 16 playoff games and repeating as NBA champion. And Hakeem Olajuwon and the 1994-95 Houston Rockets finished at 47-35 before winning the title despite being the No. 6 seed. In his last season in Miami, James and the 2013-14 Miami Heat had an uninspired regular season, going 54-28. But they made the NBA finals before losing to San Antonio.
I’ve done a bit of cherry-picking there, however. Overall, it’s not clear if defending champs overperform by much in the playoffs. In the table below, I’ve looked at every defending NBA champion since the ABA-NBA merger in 1976-77. If the “higher gear” theory is correct, then they should systematically beat Elo’s expectations in the postseason, in which case their Elo ratings will rise over the course of the playoffs. On average, however, these teams’ Elo ratings increased only from 1644 to 1658 during the playoffs. So there’s a little something there, but in Elo terms, that’s pretty minor — not much more than a rounding error.
ELO RATING IN PLAYOFFS
YEAR
TEAM
RECORD
POINT DIFF.
PLAYOFFS
START
END
DIFF.
2017
Cavaliers
51-29
+3.2
TBD
1566
TBD
TBD
2016
Warriors
73-9
+10.4
Lost NBA Finals
1788
1756
-32
2015
Spurs
55-27
+6.3
Lost 1st Round
1733
1721
-12
2014
Heat
54-28
+4.2
Lost Finals
1581
1604
+23
2013
Heat
66-16
+7.0
Won Title
1757
1754
-3
2012
Mavericks
36-30
+1.8
Lost 1st Round
1547
1525
-22
2011
Lakers
57-25
+6.0
Lost 2nd Round
1659
1624
-35
2010
Lakers
57-25
+4.8
Won Title
1613
1695
+82
2009
Celtics
62-20
+7.4
Lost 2nd Round
1693
1653
-40
2008
Spurs
56-26
+5.1
Lost Conf. Finals
1662
1678
+16
2007
Heat
44-38
-1.2
Lost 1st Round
1505
1479
-26
2006
Spurs
63-19
+6.7
Lost 2nd Round
1685
1675
-10
2005
Pistons
54-28
+3.3
Lost NBA Finals
1613
1689
+76
2004
Spurs
57-25
+7.5
Lost 2nd Round
1734
1719
-15
2003
Lakers
50-32
+2.7
Lost 2nd Round
1655
1651
-4
2002
Lakers
58-24
+7.2
Won Title
1676
1738
+62
2001
Lakers
56-26
+3.7
Won Title
1647
1779
+132
2000
Spurs
53-29
+5.9
Lost 1st Round
1637
1625
-12
1999
Bulls
13-37
-8.6
Missed playoffs
1355
—
—
1998
Bulls
62-20
+7.2
Won Title
1728
1785
+57
1997
Bulls
69-13
+10.7
Won Title
1766
1802
+36
1996
Rockets
48-34
+1.6
Lost 2nd Round
1485
1497
+12
1995
Rockets
47-35
+2.3
Won Title
1531
1665
+134
1994
Bulls
55-27
+2.9
Lost 2nd Round
1575
1607
+32
1993
Bulls
57-25
+6.2
Won Title
1679
1726
+47
1992
Bulls
67-15
+10.1
Won Title
1769
1762
-7
1991
Pistons
50-32
+3.1
Lost Conf. Finals
1552
1535
-17
1990
Pistons
59-23
+5.4
Won Title
1666
1716
+50
1989
Lakers
57-25
+6.4
Lost NBA Finals
1637
1677
+40
1988
Lakers
62-20
+4.8
Won Title
1643
1662
+19
1987
Celtics
59-23
+6.6
Lost NBA Finals
1676
1659
-17
1986
Lakers
62-20
+6.8
Lost Conf. Finals
1652
1647
-5
1985
Celtics
63-19
+6.5
Lost NBA Finals
1668
1685
+17
1984
76ers
52-30
+2.4
Lost 1st Round
1587
1572
-15
1983
Lakers
58-24
+5.1
Lost Finals
1605
1606
+1
1982
Celtics
63-19
+6.4
Lost Conf. Finals
1686
1703
+17
1981
Lakers
54-28
+3.3
Lost 1st Round
1610
1595
-15
1980
SuperSonics
56-26
+4.2
Lost 2nd Round
1639
1614
-25
1979
Bullets
54-28
+4.8
Lost Finals
1581
1554
-27
1978
Trail Blazers
58-24
+5.9
Lost 1st Round
1558
1551
-7
Average*
1644
1658
+15
How defending NBA champions fared the next season
* Average excludes 1999 Bulls and 2017 Cavaliers
Source: Basketball-reference.com
Forget looking at defending champions, though. The more important variable, as far as sports bettors are probably concerned, is LeBron. Between his experience, his toughness, and his ability to thrive in crunch-time situations, he has a game well tailored to the playoffs. And that shows up in the data:
ELO RATING IN PLAYOFFS
YEAR
TEAM
RECORD
POINT DIFF.
PLAYOFFS
START
END
DIFF.
2017
Cavaliers
51-29
+3.4
TBD
1566
TBD
TBD
2016
Cavaliers
57-25
+6.0
Won Title
1642
1759
+117
2015
Cavaliers
53-29
+4.4
Lost Finals
1631
1692
+61
2014
Heat
54-28
+4.8
Lost Finals
1581
1604
+23
2013
Heat
66-16
+7.9
Won Title
1757
1754
-3
2012
Heat
46-20
+6.4
Won Title
1613
1712
+99
2011
Heat
58-24
+7.5
Lost Finals
1672
1702
+30
2010
Cavaliers
61-21
+6.5
Lost 2nd Round
1701
1646
-55
2009
Cavaliers
66-16
+8.9
Lost Conf. Finals
1725
1742
+17
2008
Cavaliers
45-37
-0.3
Lost 2nd Round
1506
1562
+56
2007
Cavaliers
50-32
+3.9
Lost Finals
1598
1621
+23
2006
Cavaliers
50-32
+2.2
Lost 2nd Round
1562
1564
+2
Average*
1635
1669
+34
LeBron James’s teams usually find a higher gear in the playoffs
* Average excludes 2017 Cavaliers.
Source: Basketball-reference.com
James’ teams have made the playoffs 11 times prior to this season. And they’ve played really well, both in absolute terms and relative to their regular-season performance. James and the Cavs did have a disastrous postseason in 2010 — when, as the No. 1 overall seed, they lost to the Celtics in the second round — but that’s pretty much the only exception. On average, they’ve gained 34 Elo points from the start of the playoffs to the end. And over James’s past six postseasons, they’ve outperformed their regular-season ending Elo rating by an average of 55 points.
So let’s say that Elo has the Cavs’ underrated by somewhere in the neighborhood of 50 points. Call that a “LeBron clutch factor” or whatever else you like. I asked my colleague Jay Boice to add 50 Elo points to the Cavs’ Elo rating and rerun our playoff simulations. Their championship odds rose … but only to 6 percent.
Instead, you have to add about 150 points of Elo rating to get the Cavs’ odds in the same vicinity as Vegas has them. That’s a lot. Elo sees the Cavs’ current level of performance as equivalent to a 48-34 regular-season record. Add 150 Elo points to that total, and they’d project to a 62-20 regular season record. That’s a 14-win gain — about what you’d get from adding someone like Kawhi Leonard or Anthony Davis to the roster.
Have no doubt: I’d love to plunk some money down on the Cavs at the odds our forecast and the other computer models give them. Playoff basketball is a pretty different specimen from regular-season basketball, and our model isn’t doing anything to account for that. This is something for us to examine for future iterations of the model, even if the Cavs get bounced in the first round.
But I also wonder if the bookies aren’t going too far in the other direction. There are plenty of defending champions — and James-led teams — that underwhelmed in the regular season before going on to win a title or at least reach the finals. But few of them underperformed as much as the Cavs have. They also tended to benefit from down periods in the league, as the 1994-95 Rockets and 2000-01 Lakers did. This year, the Cavs will have to get past the Warriors, who might be even better than last year’s 73-9 version, or, failing that, probably the Spurs.
Nor will the Cavs’ enter the postseason with much rest. Instead, as the East’s No. 1 overall seed has been up in the air between the Cavs and the Celtics, James has averaged 43 minutes per over the team’s last five games. Kyrie Irving has gotten only two days off since the All-Star break. Kevin Love has played heavy minutes despite missing time in February and March due to knee surgery.
James has beaten expectations so many times in the playoffs that transcendent things are almost expected from him. If he leads the Cavaliers to another title this year it really might be his greatest accomplishment yet.
[image error]Politics Podcast: Trump’s Non-Doctrine Doctrine
Subscribe: iTunes |
ESPN App |
Download |
RSS |
New to podcasts?
The FiveThirtyEight Politics podcast team discusses the political fallout from President Trump’s decision to authorize airstrikes against Syrian president Bashar al-Assad’s regime. The crew digs into polling on past American military interventions abroad. And FiveThirtyEight’s Perry Bacon Jr. joins the podcast to track who in Trump’s White House has gained or lost influence so far.
You can listen to the episode by clicking the “play” button above or by downloading it in iTunes, the ESPN App or your favorite podcast platform. If you are new to podcasts, learn how to listen.
The FiveThirtyEight Politics podcast publishes Monday evenings, with occasional special episodes throughout the week. Help new listeners discover the show by leaving us a rating and review on iTunes. Have a comment, question or suggestion for “good polling vs. bad polling”? Get in touch by email, on Twitter or in the comments.

April 7, 2017
Most Senators Support Trump’s Syria Airstrike
UPDATE (April 7, 6:29 p.m.): We’ve added Sen. Cochran! Seventy-nine senators support the strike in Syria, and all 100 are on the record.
UPDATE (April 7, 6 p.m.): The article below has been updated with positions for 12 senators previously recorded as “no clear public statement.” According to our latest count, only Sen. Thad Cochran of Mississippi has yet to take a position; 78 senators support the strike in Syria (48 Republicans and 30 Democrats).
More than three-fourths of U.S. senators, including more than two dozen Democrats, have said that they support President Trump’s decision to strike an air base in Syria in retaliation for the use of chemical weapons by the regime of Bashar al-Assad. Much of that support came with concern about what comes next, but this is one of the first times in Trump’s presidency that a major policy decision has received more than token support from Senate Democrats.
A tally of senators’ positions also illustrated an important partisan divide. Almost every Democrat who backed the military strikes hedged their support. Some argued that Trump should have consulted Congress before this move. Others said that, going forward, the president would need to ask for and receive formal congressional authorization or at least present a detailed Syria strategy to the country before any further military action.
In contrast, the majority of Republicans who issued a statement offered full support for Trump’s move, without such conditions.
NUMBER OF SENATORS
POSITION ON INITIAL STRIKES
DEMS
GOP
TOTAL
Strong support
1
32
33
Support with qualifications about next steps
29
17
46
No clear position with reservations about next steps
13
2
15
Oppose
5
1
6
How are senators responding to the Syria strikes?
As of 6:30 p.m. on April 7, 2017
Sources: public statements and media reports
Kentucky’s Rand Paul is the only Republican who has publicly said he opposes the strikes, arguing that such military action must be approved by Congress first. He called Trump’s decision “unconstitutional.” Another Republican, Utah’s Mike Lee, while not opposing the attack in Syria, also declined to support it, similarly citing the lack of congressional authorization.
Nearly 20 other Republicans, including Tennessee’s Bob Corker and Nebraska’s Ben Sasse, said that Trump needed a more comprehensive plan, greater consultation with Congress, or both.
Just one Democrat, Florida’s Bill Nelson, praised Trump’s decision without equivocation. A few Democrats, including Connecticut’s Chris Murphy and Virginia’s Tim Kaine, outright opposed the strikes. Kaine was more focused on the lack of congressional authorization. Murphy, while saying Congress should have been consulted, argued this was simply a strategic mistake.
“An ill-thought out military action with absolutely no overall strategy for Syria risks dragging us further into a civil war in which we cannot tip the scales,” Murphy said. “And put in the context of U.S. policies that aid the slaughter of civilians in Yemen and deny terrorized Syrians the ability to flee their dystopian existence, a solitary air strike exposes the immoral hypocrisy of this administration’s policy in the Middle East.”
At least 10 Democratic senators have released statements that were more vague, not outright opposing or supporting the strikes. This group included some of the party’s leading figures, such as Vermont’s Bernie Sanders and Massachusetts’s Elizabeth Warren.
In a series of tweets, Sanders said, “Syria’s Bashar Assad’s use of chemical weapons against the men, women and children of his country makes him a war criminal.”
But he added, “I’m deeply concerned the strike in Syria could lead the U.S. back into the quagmire of long-term military engagement in the Middle East.”
This mix of views, with lots of positions other than simply opposing or supporting Trump’s actions, illustrate the lack of agreement even within the two parties about what the U.S. should do about Syria. And this was only about a single military strike. If Trump consults Congress on Syria policy, as many members in both parties seem to want, that may leave the president with less, not more, clarity on what he should do.
Aaron Bycoffe, Ben Casselman, Galen Druke, Meena Ganesan and Nate Silver contributed research to this article.

April 6, 2017
Nuking The Filibuster May Hurt Republicans In The Long Run
The Supreme Court filibuster just died. Having failed to break a Democratic filibuster on the nomination of Neil Gorsuch to the Supreme Court, Republicans voted 52-48 to invoke the so-called nuclear option, allowing debate on Gorsuch and future Supreme Court justices to be ended by the Senate on a simple majority vote.
Unless there’s an intense public outcry — and there was barely a peep when Democrats invoked the nuclear option for other nominations four years ago — the legislative filibuster might be next on the chopping block. Republican Majority Leader Mitch McConnell has said he’ll keep the legislative filibuster for the current Congress. But with the intense partisanship that typifies Congress these days, the reverence for Senate traditions such as the filibuster isn’t likely to hold much longer.
In the short run, this will give Republicans and their narrow majority in the Senate more power. Gorsuch is expected to be confirmed on a mostly party-line vote on Friday. President Trump may get the chance to nominate additional Supreme Court justices later in his term. And if Republicans decide to eliminate the legislative filibuster somewhere down the line, they’ll have more flexibility on repealing and replacing Obamacare, tax reform and other policies.
But in the long run, it’s not at all clear that eroding the filibuster will be in the GOP’s best interest. In the recent past, they’ve made more effective and more frequent use of it than Democrats ever did. Consider some of the additional legislation that might have passed had the filibuster not been in place during President Barack Obama’s time in office. The list includes the DREAM Act, a cap-and-trade system to regulate carbon emissions, a gun-control compromise bill and a “public option” as part of Obamacare. Democrats would probably also have been able to pass an even more aggressive stimulus package if not for the de facto 60-vote requirement.
These episodes illustrate a couple of points. First, political fortunes can change in a hurry. It was only eight years ago that Democrats had 59 or 60 seats in the Senate. But also, there may be some asymmetry in when and how the filibuster is invoked and which party it hurts the most. Historically, the filibuster has been used — both by Southern Democrats and by Republicans — to stymie progressive legislation, such as during the Civil Rights era. And in general, if Democrats and liberals are hoping to bring about change, while Republicans and conservatives are hoping to preserve the status quo, impediments to change such as the filibuster will hurt Democrats more.
So if eliminating the filibuster pays clear dividends to Republicans in the short run, and potential benefits to the Democrats in the long run, the question is: How long until we get to the long run? In other words, how long might we expect it to be before Democrats control the Senate again? And would a Democratic Senate coincide with having a Democratic president?
This requires making some medium-to-long-range forecasts, which is obviously a dangerous exercise. But we can cover the problem in some very broad strokes. First, we can look at how long a party typically maintains control of the Senate. Beginning with the 66th Congress in 1919, which was the first one in which all members of the Senate had been chosen by direct election rather than being appointed by their states, the Senate has changed control 12 times, not counting a brief interval when Democrats controlled the Senate in January 2001 because George W. Bush had not yet been sworn in as president.
YEARS
MAJORITY PARTY
DURATION IN YEARS
1919-33
Republicans
14
–
1933-47
Democrats
14
–
1947-49
Republicans
2
–
1949-53
Democrats
4
–
1953-55
Republicans
2
–
1955-81
Democrats
26
–
1981-87
Republicans
6
–
1987-95
Democrats
8
–
1995-2001*
Republicans
6.5
–
2001-03
Democrats
1.5
–
2003-07
Republicans
4
–
2007-15
Democrats
8
–
2015-Present
Republicans
TBD
–
How long does a Senate majority last?
* Republicans temporarily lost their majority on Jan. 3, 2001, when the new Congress was sworn in and the Senate was split 50-50 but the lame duck Democratic vice president, Al Gore, still had the tie-braking vote in the Senate. I do not consider this to be a change in control. Instead, the change came in June 2001, when Sen. Jim Jeffords of Vermont began to caucus with Democrats.
Source: Senate.GOV
On average, the Senate has changed hands once every eight years; the median time required for a change is about six years. Or here’s a slightly different way to frame the question: Given that Republicans will already have controlled the Senate for four years at the end of the current Congress, how much longer might we expect them to control it? The answer — again based on the historical data you see above — is an average of six additional years or a median of four additional years beyond January 2019.
So to give you a very rough answer, the long run begins somewhere between four to eight years from now.
But we can perhaps very tentatively dip our toes in and try to game out how the next few election cycles might go, given the current political conditions. Here are a few obvious things we know:
Republicans currently control the Senate 52-48, and they have Vice President Mike Pence’s tie-breaking vote.
Trump won 28 states despite losing the national popular vote, so 56 of 100 senators are from states Trump won. This reflects the fact that sparsely populated rural states have the same number of senators as highly populous coastal ones and perhaps means that the GOP has a geographic advantage in the Senate. As is the case with the Electoral College, however, it’s not clear whether this is a long-run advantage for Republicans or was something more peculiar to the circumstances of the 2016 election.
Trump is historically unpopular relative to other presidents at this point of their terms, and midterm elections are usually pretty tough on the president’s party. So the GOP is swimming into something of a current.
There are some big imbalances between the three classes of senators. More than 70 percent of the seats up for re-election next year are held by Democrats. But about two-thirds of the seats up in 2020, and then again in 2022, are held by Republicans.
Let’s consider how this might play out:
Who will control the Senate after 2018? Republicans will still control the presidency. And they’ll probably also still control the Senate. While Democrats would only need to gain three seats to control the Senate, they face the very difficult map I mentioned above, with only nine Republican seats to target but 25 of their own ones to defend. Having Trump in the White House is a blessing for vulnerable red-state Democrats such as Sen. Claire McCaskill of Missouri, who can run as a check on Trump’s power instead as of a validator of Hillary Clinton’s agenda. So Democrats might do pretty well in defending their own seats. But finding three Republican pickups is tough. Arizona and Nevada are the most obvious chances for Democrats, but after that they’re probably hoping to pick up (gulp) Ted Cruz’s seat in Texas. Or (double gulp) Orrin Hatch’s in Utah? Or they’re hoping for a retirement that could prompt a special election that is not currently scheduled yet. None of this is quite impossible, but it’s unlikely.
Who will control the Senate — and the presidency — after 2020? Ordinarily, the presidency doesn’t change hands after just one term, but betting markets — no doubt looking at Trump’s poor approval ratings — actually have Democrats as slight favorites to win the 2020 election. I’m not sure I totally buy that, but let’s say the next election is roughly in the vicinity of a toss-up. Will whichever party controls the presidency have the Senate to go along with it?
If it’s Republicans, the answer is probably yes. Although they might lose — or gain — a seat or two at the midterms (see above), they’ll probably enter the 2020 election with about the same 52-48 majority that they have now. And if the Republican’s candidate (whether it’s Trump or someone else) is doing well enough to win the presidency, the GOP will probably do well enough in the Senate to hold their majority. Remember, these outcomes are highly correlated, with down-ballot outcomes tending to follow top-of-the-ticket ones.
By the same token, however, a Democratic president would probably be accompanied by a Democratic Senate. The 2020 map offers decent opportunities for them, with 22 Republicans up for re-election but just 11 Democrats. Most of the Republicans are in deeply red states. But there are some decent opportunities for Democrats, including GOP-held seats in Colorado, Maine, North Carolina, Georgia and Iowa. Plus the new vice president would be a Democrat in the event of a 50-50 tie.
Related:
Could the Senate change hands again after the 2022 elections? If we’re really gaming things out, it’s worth noting that the 2022 Senate map is relatively favorable for Democrats. That’s because the same seats up for re-election as in 2016, which was also a good map for Democrats, will be up again. Democrats flipped only Illinois and New Hampshire last year, but at various times, they also had designs on GOP-held seats in Florida, Ohio, North Carolina, Pennsylvania, Wisconsin, Arizona, Missouri and Indiana, and they’ll target many of the same states in 2022. Republicans have a shorter list of plausible targets, including New Hampshire, Nevada and Colorado. But a Democratic president would probably have an easier time holding a narrow majority than a Republican one.
This is beginning to devolve to the point of ridiculousness, but that’s sort of the point — electoral politics are not all that predictable more than a couple of years in advance. We know that Republicans control the Senate now and that they will probably still do so after next year’s midterms. Beyond that, conditions are highly uncertain. By this definition, then, the long run begins on Jan. 20, 2021. Today could be the start of a decadeslong conservative majority on the Supreme Court. Or it could be the day that led to the Democrats’ passing a single-payer health care plan, or a $15 national minimum wage law, on a 51-49 party-line vote through a filibusterless Senate. If, over the long run, the filibuster has hurt Democrats more than helped them, perhaps they should bid it good riddance.

April 5, 2017
Is Filibustering Gorsuch A Smart Strategy For Democrats?
In this week’s politics chat, we debate whether the Democratic strategy of filibustering President Trump’s Supreme Court nominee, Neil Gorsuch, makes political sense. The transcript below has been lightly edited.
micah (Micah Cohen, politics editor): Are Democrats screwing this whole Gorsuch thing up? That’s our question for today. We’re going to go through the arguments for the Gorsuch filibuster (aka the Gorbuster) and then the ones against. Everyone got it? Good …
First, the pro-Gorbuster arguments, nicely summarized by Bloomberg political reporter Sahil Kapur:
Simple retribution for the GOP’s refusal to consider Obama nominee Merrick Garland.
It would excite and encourage the Democratic base.
Filibustering denies Trump an easy win.
If Democrats filibuster and then Republicans get rid of that option for Supreme Court picks (which they’ve said they will do), Democrats will have an easier time putting liberal justices on the court next time they’re in control.
natesilver (Nate Silver, editor in chief): And the arguments AGAINST are basically …
Democrats need to hold their fire for next time.
Their move would be unpopular.
Opportunity cost (there are better ways to fight Trump).
Even if Gorsuch were scuttled, it’s not clear where they’d go next.
micah: OK, let’s go through the affirmative arguments first.
Pro-Gorbuster argument No. 1: It’s payback for Garland, and that, by itself, makes the filibuster worthwhile.
Go!
clare.malone (Clare Malone, senior political writer): It’s a very natural emotional response for the Democratic base to have — payback time! — and for Democratic politicians to capitalize on, in addition to their own feelings of anger over the way things went down. Politics is as much emotion as it is pragmatism.
harry (Harry Enten, senior political writer): This works only if there are no other consequences for the filibuster. An eye for an eye feels good. But it doesn’t work if there are consequences. The question is whether you view the disappearance of the filibuster (which is likely once Democrats filibuster) as a negative consequence for Democrats.
clare.malone: I think I know what Harry thinks of this filibuster move … but Harry is not running for office, so I think he can discount the emotional response that voters are having — I think a lot of Democratic senators might be thinking of 2018 seats that are up. Claire McCaskill herself said she feared a tea-party-type challenger from the left.
harry: Don’t act like you know me.
natesilver: I’m trying to figure out if I’d vote for Harry. Probably.
clare.malone: What would Harry’s slogan be?
More soda, less tax?
natesilver: “A Car in Every Garage, A Diet A&W Cream Soda in Every Fridge”
Natural although it might be, and as objectionable as the Republicans’ behavior on Garland might have been, the situations aren’t really all that parallel. Mainly because the Democrats aren’t in the majority, and they don’t ultimately have any power. Perhaps if the Democrats take over the Senate in 2018 (which is unlikely, but never say never) they could refuse to confirm any Trump nominees — and that would be payback.
perry (Perry Bacon Jr., senior writer): Is payback a good reason to do anything ever?
micah: OK, what if I phrase the payback argument this way: Democrats have to fight 
April 3, 2017
The Gorsuch Filibuster Shows The Liberal Base’s Clout
At least 41 Democratic senators have publicly committed to filibuster President Trump’s Supreme Court nominee, Neil Gorsuch, leading to a probable showdown with Republican Senate Majority Leader Mitch McConnell.
The filibuster might seem like payback for Democrats after Republicans refused to consider the nomination of then-President Obama’s Supreme Court nominee, Merrick Garland, for 293 days starting last year. Unlike Republicans last year, however, Democrats don’t have all that much power. They aren’t in the majority — and McConnell has strongly hinted that he could seek to eliminate the filibuster for Supreme Court picks if Gorsuch can’t get 60 votes. Across a variety of surveys, moreover, a plurality of voters think the Senate should confirm Gorsuch, although a fair number of voters don’t have an opinion either way. Therefore, Democrats’ political endgame is unclear.
Gorsuch is quite unpopular with liberal voters, however: By a 61-15 margin, they oppose his confirmation, according to a YouGov poll last week. Thus, the planned filibuster may simply be a sign of the liberal base’s increasing influence over the Democratic coalition. The share of Democrats who identify as liberal has steadily increased over the past 10 years. According to the recently released Cooperative Congressional Election Study, 53 percent of Democratic voters identified as liberal last year. Until recently, it was rare to find surveys that showed liberals made up a majority of the party.
But to some extent, that 53 percent figure understates the case. The CCES also asked voters about whether they’d engaged in a variety of political activities, including donating to a candidate, attending a political meeting, working on behalf of a campaign or putting up a political sign. Among Democrats who’d done at least one of those things — a group I’ll call “politically active Democrats” — 69 percent identified as liberal. These were some of the voters who helped propel Bernie Sanders to almost two dozen primary and caucus victories last year.
Oftentimes these liberals are found in states where you might not necessarily expect them — such as in the Mountain West, which was a strong region for Sanders last year. According to a regression analysis conducted on the CCES data, the proportion of politically active Democrats who identify as liberal is larger in states where candidate Trump fared poorly. But controlling for that, it’s also larger in states that have more white voters, and more college-educated voters. And it’s larger in the West than in the other political regions of the country. In the table below, I’ve estimated the share of politically active Democrats in each state who identify as liberal. Since the sample sizes for some states are small, the estimates are based on a blend of the raw polling data from the CCES and the regression model I described above.
SHARE OF POLITICALLY ACTIVE DEMOCRATS THAT IDENTIFY AS LIBERAL
STATE
DEM SENATORS UP FOR RE-ELECTION
POLL-BASED ESTIMATE
MODEL-BASED ESTIMATE
BLENDED ESTIMATE
D.C.
87%
77%
84%
Idaho
92
74
82
Utah
85
74
80
Washington
Cantwell
78
76
78
Minnesota
Klobuchar
78
74
78
Oregon
77
78
77
New Hampshire
81
71
76
Vermont
Sanders
78
75
76
Montana
Tester
73
77
76
Alaska
84
71
75
New Mexico
Heinrich
76
73
75
Maine
King
78
69
74
Arizona
75
70
74
Massachusetts
Warren
75
72
74
Connecticut
Murphy
75
72
74
Rhode Island
Whitehouse
74
73
73
Virginia
Kaine
73
68
72
California
Feinstein
72
74
72
Michigan
Stabenow
73
69
72
Indiana
Donnelly
73
68
72
Wyoming
83
67
72
New York
Gillibrand
72
71
72
Iowa
72
71
71
Illinois
71
70
71
South Dakota
82
67
71
Colorado
69
75
70
Nebraska
73
67
70
Arkansas
78
59
70
Florida
Nelson
69
66
69
Nevada
68
69
69
Tennessee
70
63
68
Pennsylvania
Casey
68
70
68
Delaware
Carper
63
72
68
Wisconsin
Baldwin
67
72
68
Ohio
Brown
68
68
68
Kansas
64
70
66
Mississippi
73
54
65
North Carolina
64
66
65
Texas
64
63
64
New Jersey
Menendez
63
67
63
Oklahoma
63
61
63
Louisiana
61
66
63
North Dakota
Heitkamp
51
66
61
Kentucky
60
64
61
Hawaii
Hirono
43
71
61
Missouri
McCaskill
60
65
61
Alabama
61
57
59
Maryland
Cardin
58
64
59
West Virginia
Manchin
49
67
57
South Carolina
51
59
54
Georgia
49
61
51
Where is the Democratic base most liberal?
Source: Cooperative Congressional Election Study
It’s not surprising that Washington, Oregon and Vermont are places where the liberal wing of the Democratic base dominates. But Idaho, where I estimate that 82 percent of politically active Democrats identify as liberal, and Utah, where I estimate that 80 percent do, also rate near the top. It’s not that Idaho and Utah are blue states, obviously; they’re among the most Republican in the country. Nonetheless — perhaps because a lot of moderate voters identify with the GOP in these states — the few Democrats that remain are overwhelmingly liberal.
The same phenomenon holds in Montana, where I estimate that 76 percent of politically active Democrats are liberal. That may help to explain why Sen. Jon Tester of Montana says he will vote against Gorsuch, even though he faces a tough general election campaign next year. Whether or not Democrats would issue a primary challenge to Tester, who has generally sided with the party on key votes, is questionable. Nonetheless, he’ll be relying on his base for money, volunteers and a high turnout on Election Day. In Montana, the conservatives are conservative — but the Democratic base is fairly liberal also.
By contrast, Democratic Sens. Heidi Heitkamp of North Dakota and Joe Manchin of West Virginia, who will vote to confirm Gorsuch, are on somewhat safer ground. Some 61 percent of politically active Democrats identify as liberal in North Dakota, while 57 percent do in West Virginia, according to this estimate. Those figures are almost certainly higher than they would have been a few years ago. But Heitkamp and Manchin probably face more risk from the general election than from a loss of support among their base.
Nor is the Democratic base all that liberal in the Mid-Atlantic region, including states such as Maryland, Delaware and New Jersey. Instead, even the party activists in these states can have a moderate, pro-establishment tilt. That may explain why senators such as Chris Coons of Delaware and Robert Menendez of New Jersey were slow to announce their positions on Gorsuch before eventually deciding to oppose him.

Nate Silver's Blog

- Nate Silver's profile
- 730 followers

