Phil Simon's Blog, page 41
July 21, 2019
How Dataviz Can Manifest a Tale of Two Sports
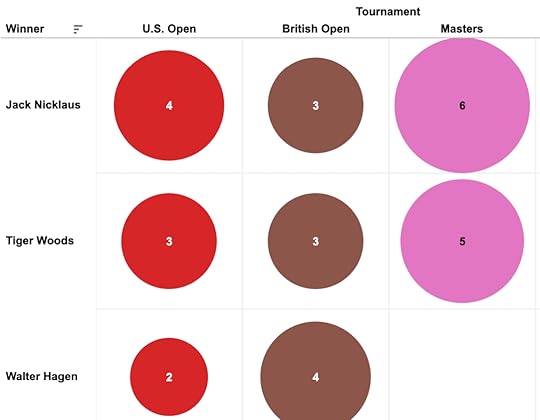
Shane Lowry ran away with the British Open today—his first major championship. In a way, a first-timer winning on Sunday is nothing new in the world of golf. For the last ten years, it seems that repeat champions have been the exception and not the rule. We are far from Tiger Woods’ heyday.
Using Tableau, it wasn’t hard to confirm my suspicion.
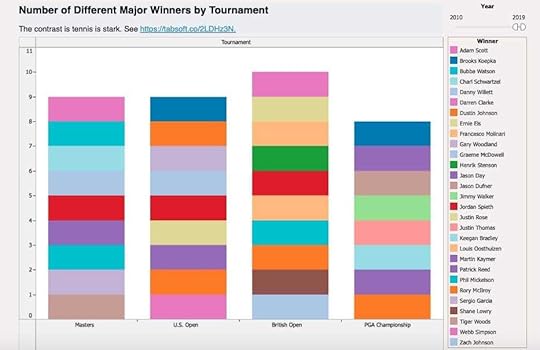
Yes, 29 different men have won major championships since 2009. It’s an amazing number. (See the entire interactive dataviz yourself here.)
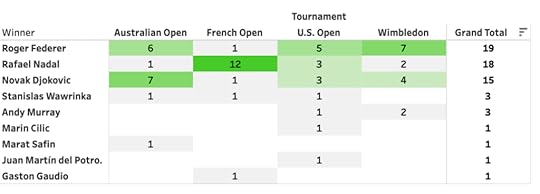
Contrast that with tennis. The era of the Big Three is alive and well. Case in point: Only six different men have won major tournaments in the same time period.
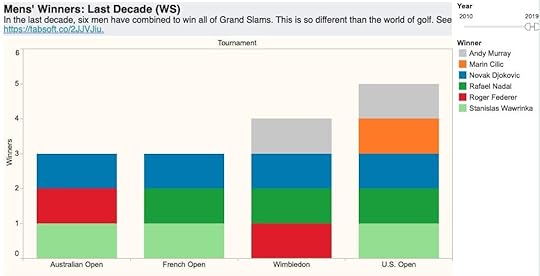
Again, you can view the entire tennis dataviz online here.
Simon Says: Tableau makes data discovery fun.
I have nothing against SQL statements and Excel, but I’ve never had as much fun visualizing data as I have with Tableau. Asking and answering questions is remarkably intuitive and the application’s formulas follow contemporary programming conventions.
Feedback
What say you?
The post How Dataviz Can Manifest a Tale of Two Sports appeared first on Phil Simon.


July 15, 2019
Thoughts on Learning Tableau
Back in the late-1990s through the late-2000s, I spent a great deal of time writing reports for my clients. To be sure, the methods varied. One of my go-to applications was Crystal Reports, now part of SAP. In a way, the specific tool didn’t matter. As long as I knew the structure of the database tables,1 I could find what I wanted and return the results in the desired format.
I am keeping this in mind as I prepare to teach a dataviz course next semester for the first time. No, we don’t use Crystal Reports; we use Tableau. Fortunately, the same old rule about reporting applications holds. At a high level, both Tableau and Crystal largely accomplish the same things and offer comparable functionality. Brass tacks: As long as you understand the data, you should be able to do what you want.
One Report, Many Options
For instance, I used to enjoy creating interactive Crystal reports for my clients. That is, rather than just spewing out the data in a predefined, static format, I would often allow users to select the way that they wanted to see the data. Examples included different cuts of the data and different grouping, sorting, and downloading options. Put differently, Crystal allowed report creators to add dynamic parameters.
I haven’t touched Crystal Reports in a decade, but Tableau lets you do the same thing. I inserted a string parameter winner name on my growing tennis data visualization. Here’s an animated gif showing it in action:
In case you’re wondering, you can do so much more with parameters.
Simon Says: Experience matters.
I’m no Tableau Zen Master, but I am certainly not terrible with the reporting application. As I’ve told my students many times before, knowing how one contemporary tool, programming language, or framework works makes it easier to learn new ones.
Feedback
What say you?
The post Thoughts on Learning Tableau appeared first on Phil Simon.
July 8, 2019
Why I Emphasize Strong Communication in My Syllabi
I’m putting the final touches on my Fall ’19 syllabi1 and include the following sentences in the communications section:
Are you curious about why a IS professor emphasizes clear communication so much? Check out the first job listing that Jeff Bezos posted for Amazon 25 years ago.
And here’s the screen grab from a man who has made his mark in the universe:
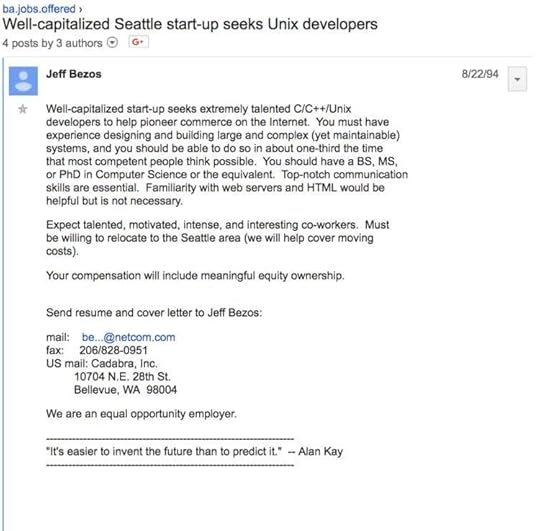
Yeah, some programming languages have gained traction since 1994. You won’t find any mention of Python or JavaScript in Bezos’ listing. Note however, the emphasis on strong communication skills, even and especially for techies.
Simon Says
Many things have changed since Bezos wrote that job description. The need for clear and effective business communication, however, is certainly not one of them.
Feedback
What say you?
The post Why I Emphasize Strong Communication in My Syllabi appeared first on Phil Simon.
July 3, 2019
Summer Reading
I’ve been reading about a book per week this summer and few stand out.
Specialists vs. Generalists
Range: Why Generalists Triumph in a Specialized World by David Epstein looks at the need for generalists in a specialist-driven world. Should someone specialize in one field à la Tiger Woods?
Or is Roger Federer’s approach to sample a bunch of different sports the way to go? Put differently, is it better to dabble in a number of things early on and stitch them all together later in life? Plenty people have done it and seen success. In fact, I’m one of them.
You can probably figure out the answer from the title. Epstein’s book should be required reading for those who think that only one thing matters. If you don’t have time to read the book, he covers much of it in the Longform Podcast.

 How to Win in a Winner-Take-All World: The Definitive Guide to Adapting and Succeeding in High-Performance Careers by Neil Irwin covers similar terrain but is just as good. Irwin is a gifted writer and his second book is rife with stories and great research on the benefits of being broad—not just deep.
I particularly enjoyed the way that he applied the principle of Pareto optimality to careers. I was unaware of the A. J. Liebling quote: I can write faster than anyone who can write better, and I can write better than anyone who can write faster. The more that I think about it, though, the more sense that it makes regardless of your primary occupation.
Both books made me think of the benefits of platform thinking. As I write in The Age of the Platform, entering adjacent fields has served Amazon, Apple, Facebook, and Google well.
Technology New and Old
Bitcoin Billionaires: A True Story of Genius, Betrayal, and Redemption by Ben Mezrich details the post-Facebook travails of the Winklevii. Turns out that these guys are pretty freaking smart after all.
Much like Mezrich’s other books, I question if the events folded exactly how he describes. Regardless, Mezrich’s 20th effort1 is a compelling, fast-paced read about an increasingly important topic. I knocked it out in a day.
 The Players Ball: A Genius, a Con Man, and the Secret History of the Internet’s Rise by David Kushner tells the fascinating story of the two guys who fought over the sex.com domain. It’s a gripping tale of two interesting, smart, stubborn, and ultimately flawed men trying to score big during the early days of the Web.
Currently Reading
Next on my list is Educated: A Memoir by Tara Westover on a friend’s recommendation.
Feedback
What say you?
The post Summer Reading appeared first on Phil Simon.
June 19, 2019
Can you use Slack too much?
“We become what we behold. We shape our tools and then our tools shape us.”
—Marshall McLuhan

Credit: Simoul Alva
I’m hard-pressed to think of a tool that I enjoy using more than Slack. I’m an effusive advocate. It doesn’t surprise me that, for the last year and change, the most popular post on my blog has been How I Use Slack Inside of the Classroom.
As I write in Message Not Received, Slack and its ilk are just like any communications tool: You can use them too much when in-person conversations make far more sense.
It’s hardly a revolutionary thought, but think about that when you’re spinning in circles and you’re unable to get a simple answer to a question. Along these lines, from an excellent recent piece by John Herrman in The New York Times:
Slack also defies the social customs and expectations of email, codified over decades of use and misuse. Some employees — and, crucially, employers — are still learning how to establish rules and boundaries around real-time chat. “I personally felt so much anxiety over Slack,” Ms. O’Quigley said. “I love my job, but nothing triggers alarm bells like when you receive a message from your team or boss after work hours.”
Simon Says
Herrman’s article is fascinating. Read it and you’ll discover that many of the problems that excessive e-mail causes Slack doesn’t necessarily solve. In some cases, employees have just moved the headache from one medium (e-mail) to Slack.
Brass tacks: Slack breakups aren’t necessary if people move a discussion to more appropriate medium. Sometimes, it’s best to just talk to someone. If I were king at any organization experiencing Slack fatigue,1 I’d have them immediately implement my three-message rule. Think of Slack and its cohorts as clubs in the bag.
Feedback
What say you?
The post Can you use Slack too much? appeared first on Phil Simon.
June 13, 2019
Who’s Won the Most Majors? An Interactive Dataviz
 The US Open is currently taking place at Pebble Beach.
I know by heart who has won the most majors and who’s in second place. Most golf fans do. Still, who won the most Masters between 1950 and 1970? What about British Opens in the 19th century? Has Tom Watson—the man who nearly won the British at the age of fifty-freaking-nine—ever won the PGA Championship?
No, you don’t need to google anything. Just find the data, tweak it, and mess around in Tableau. I did something similar on Sunday after Rafa Nadal won his twelfth French Open. It turns out that replacing datasets is very easy if you’ve structured your data similarly.1
A few minutes later, voilà!
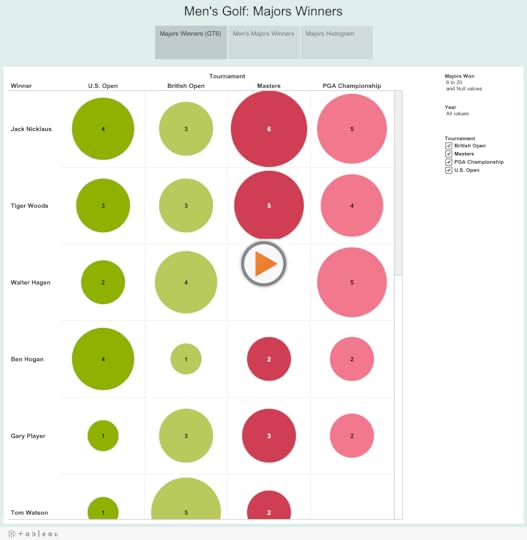
To view the dataviz above on Tableau Public, click here.
Simon Says
Aside from answering sports-related queries, I can think of myriad uses of Tableau. Maybe that’s why Salesforce dropped nearly $16B for it this week.
Feedback
What say you?
The post Who’s Won the Most Majors? An Interactive Dataviz appeared first on Phil Simon.
June 9, 2019
Visualizing Men’s Grand Slam Winners
Rafa did it again.
The man won his twelfth freaking French Open.
Twelve. Let that sink in a moment.
Put that gawdy number into context: Nadal has won more French Opens alone than total majors of all but three men: Pete Sampras, Roger Federer, and Novak Djokovic.

No, I don’t have a photographic memory. I just like to noodle with data and data visualizations. I have for my whole career. While researching The Visual Organization,I became a Tableau fan.1
It took me all of ten minutes to create the simple dataviz below. I grabbed the data from Kaggle, made a few tweaks in Excel,2 and went to work in Tableau Desktop. A few clicks later, I published my dataviz on Tableau Public and embedded it below.
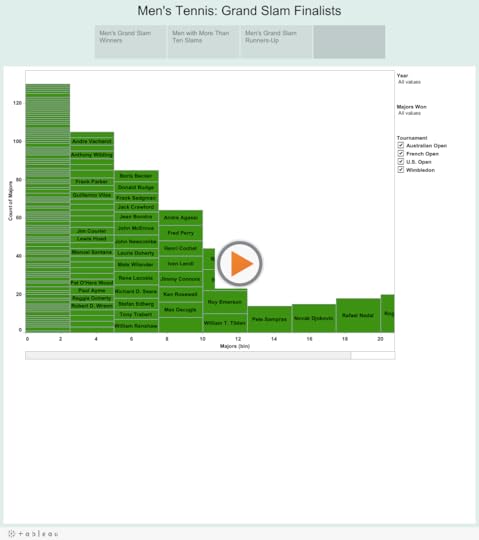
Fun fact: Only nine men have won Grand Slams in the past fifteen years, and four of those men only won a single Slam:
Tennis has never been more top-heavy on the mens’ side. Yes, we live in an era that the Big Four dominates.
Play with the data yourself and you can easily discover interesting things. It doesn’t take long to discover interesting nuggets. Exhibit A: William Larned won eight U.S. Open victories but struck out with the other Grand Slams. His clay counterpart is Max Decugis who won all of his eight majors at Roland Garros.
Simon Says: Get interactive. Now.
There’s just no excuse for building static charts and graphs these days. Adding basic interactivity lets everyday users discover interesting things in datasets. What’s more, it obviates the need to ask IT for reports. That’s so 1998.
And if you missed the match, watch some highlights below:
The post Visualizing Men’s Grand Slam Winners appeared first on Phil Simon.
June 2, 2019
My New Udemy Course: How to Write a Business Book
Writing a business book can open many professional doors.
I should know.
 Until the late aughts, I worked primarily as an independent enterprise systems consultant. In 2008, I started writing what became my first book, Why New Systems Fail. In the process, I transformed my career.
No, it didn’t happen overnight, but in the years since new consulting, speaking, coaching, and writing opportunities have arrived. I can say this with absolute certainty: My career would have taken a vastly different trajectory had I not started writing books. Take them away don’t know what I’d be doing today. I certainly would have not landed a job as a full-time college professor.
I decided that it’s time to share my knowledge in this domain in a new Udemy course.
Course Objectives
In no particular order, the course strives to do the following:
Answer questions that most first-time writers have. These including whether the thesis of a business book needs to be novel or whether a book needs to include stories and/or case studies.
Define and describe the building blocks of any successful business book.
Dispel many of the myths that plague would-be and first-time writers.
Disclose some of my key technology and writing tips designed to make you as productive as possible.
Tell you how to wrap up your business book. Yes, it’s better to go out with a bang, not a whimper.
And much, much more.
Unlike my first two Udemy courses, I sprung for a professional videographer on this one. I’m pleased with the result and will be doing the same for my future courses.
Here’s the promotional video:
Learn more about course.
Props to Second Star AZ for the excellent videography and editing.
The post My New Udemy Course: How to Write a Business Book appeared first on Phil Simon.
May 28, 2019
What I Learned Visiting an Amazon Fulfillment Center
I’ve been paying attention to Amazon since its inception—nearly 25 years. Researching my books, I’ve talked to ex-Amazon employees and yet, oddly, I have never set foot in an Amazon facility.
A few weeks ago, I decided to change that.
No, I didn’t stage a break-in. The e-commerce behemoth known for its secrecy offers public tours. Just sign up for one. Along with a group of 30 or so curious folks, I recently toured PHX6—a building the size of 32 football fields yet hardly one of Amazon’s largest.

Fulfillment Centers Are Freaking Enormous
Allow me to state the obvious: the place is crazy big. According to our tour guide, PHX6 is one of the smaller fulfillment centers in the country but I still couldn’t wrap my head around its size. It would probably take me five minutes to run from one end of the building to another.
Amazon Is Not Complacent
If Amazon is known for anything, customer-centricity and process improvement are certainly at the top of the list. Our tour guide pointed out several signs reminding employees that they can submit ideas designed to make things better. Make no mistake: One of the most valuable companies in the world is still hungry for more.
Amazon Controls Everything
Visitors cannot take their own photos for obvious reasons. A machine took the photo above at a designated spot. Afterward, people can easily allow Amazon to send the photo to an e-mail address or cell phone number.
Beyond that, ample signage reminds employees about company policies. I noticed plenty of cameras as well—no surprise given reports of employee theft. Also, our guide reminded us multiple times to stay in our lanes. If we veered from our paths or interrupted employees, we’d be leaving early.
Tech Is Everywhere
No, PHX6 doesn’t sport high-tech robots such as the ones seen below:
I’d be shocked, though, if robots didn’t arrive at PHX6 within the next few years.
Beyond robots, the speed of the sorting machines and even the custom-built tape machines blew my mind. This is a company obsessed with technology and efficiency.
Working at a Fulfillment Center Isn’t Easy
A few times, I peered down at workers furiously sorting packages. I didn’t ask about the alleged insane rules that employees need to follow but one thing was obvious: slackers and shirkers won’t last long at Amazon. As someone with back issues, I can’t envision standing on my feet all day.
Simon Says: Take the tour.
If you get a chance, take the 45-minute tour. Read all you like, seeing Amazon’s magic in person resonated with me differently than TV shows, books, and articles have.
Feedback
What say you?
The post What I Learned Visiting an Amazon Fulfillment Center appeared first on Phil Simon.
April 21, 2019
Sprucing Up Python Scripts with Data Visualization
 Last fall, I taught four sections of a survey course on information systems to freshmen who have chosen not to study information systems. Still, regardless of major, all students today benefit from knowing at least the basics of coding.
To this end, the other two instructors and I spend one class covering the basics of object-oriented programming.1 For the next three classes, we introduce simple programming concepts such as variables, print and if-then-else statements, lists,2 functions, and for and while loops. In CIS236 and its cousin CIS235, we only scratch the surface of one of the today’s most powerful and popular programming languages.
 At the end of the Python module, I stitch everything together with some examples that build upon what we have learned so far. My favorite is a basketball-inspired one that pokes fun at my lack of skills. The script calculates my game-by-game and aggregate shooting percentages.
Although it’s far beyond the scope of the class, there’s so much more you can do with Python, especially when you consider its libraries. After reading Clive Thompson’s excellent book Coders: The Making of a New Tribe and the Remaking of the World, I thought that I’d revisit last semester’s script and improve upon it.
Improving on the First Iteration
I knew that I would first have to gather and store shot and game data in simple lists.3 After that, creating the bar chart would be pretty straightforward. I’m sure that I could have done it in many different ways, but I chose to visualize the results with matplotlib.pyplot and numpy.
Give it a whirl yourself below by hitting the play button. Note that the bar chart appears at the bottom on the right. You’ll most likely have to scroll down to see it.
Click here to download this script on my GitHub.
Or, if you like, watch the video of it below:
Simon Says
I’m hardly an expert on all things Python, but that’s the point: It’s not that hard to improve upon a script and, dare I say, add a little flair. Beyond that, I can think of worse ways to spend a few minutes on a Sunday morning than learning more about Python and some of its libraries.
Feedback
What say you?
The post Sprucing Up Python Scripts with Data Visualization appeared first on Phil Simon.