Lorin Hochstein's Blog, page 8
July 6, 2024
Quick takes on Rogers Network outage executive summary
The Canadian Radio-television and Telecommunications Commission (CRTC) has posted an executive summary of a report on a major telecom outage that happened in 2022 to Rogers Communications, which is one of the major Canadian telecom companies.
The full report doesn’t seem to be available yet, and I’m not sure if it ever will be publicly released. I recommend you read the executive summary, but here are some quick impressions of mine.
Note that I’m not a network engineer (I’ve only managed a single rack of servers in my time), so I don’t have any domain expertise here.
Migration!When you hear “large-scale outage”, a good bet is that involved a migration. The language of the report describes it as an upgrade, but I suspect this qualifies as a migration.
In the weeks leading to the day of the outage on 8 July 2022, Rogers was executing on a seven-phase process to upgrade its IP core network. The outage occurred during the sixth phase of this upgrade process.
I don’t know anything about what’s involved a telecom upgrading its IP core network, but I do have a lot of general opinions about migrations, and I’m willing to bet they apply here as well.
I think of migrations as high-impact, bespoke changes that the system was not originally designed to accommodate.
They’re high-impact because things can go quite badly if something goes wrong. If you’ve worked at a larger company, you’ve probably experienced migrations that seem to take forever, and this is one of the reasons why: there’s a lot of downside risk in doing migration work (and often not much immediate upside benefit for the people who have to do the work, but that’s a story for another day).
Migrations are bespoke in the sense that each migration is a one-off. This makes migrations even more dangerous because:
The organization doesn’t have any operational muscles around doing any particular migration, because each one is new.Because each migration is unique, it’s not worth the effort to build tooling to support doing the migration. And even if you build tools, those tools will always be new, which means they haven’t been hardened through production use.There’s a reason why you hear about continuous integration and continuous delivery but not continuous migration, even though every org past a certain age will have multiple migrations in flight.
Finally, migrations are changes that the system was not originally designed to accommodate. In my entire career, during the design of a new system, I have never heard anyone ask, “How are we going to migrate off of this new system at the end of its life?” We just don’t design for migrating off of things. I don’t even know if it’s possible to do so.
Saturation!Rogers staff removed the Access Control List policy filter from the configuration of the distribution routers. This consequently resulted in a flood of IP routing information into the core network routers, which triggered the outage. The flood of IP routing data from the distribution routers into the core routers exceeded their capacity to process the information. The core routers crashed within minutes from the time the policy filter was removed from the distribution routers configuration. When the core network routers crashed, user traffic could no longer be routed to the appropriate destination. Consequently, services such as mobile, home phone, Internet, business wireline connectivity, and 9-1-1 calling ceased functioning.
Saturation is a term from resilience engineering which refers to a system receiving being pushed to the limit of the amount of load that it can handle. It’s remarkable how many outages in distributed systems are related to some part of the system being overloaded, or hitting a rate limit, or exceeding some other limit. (For example, see Slack’s Jan 2021 outage). This incident is another textbook example of a brittle system, which falls over when it becomes saturated.
Perception of riskI mentioned earlier that migrations are risky, and everyone knows migrations are risky. Roger engineers knew that as well:
Rogers had initially assessed the risk of this seven-phased process as “High.”
Ironically, the fact that the migration had gone smoothly up until that point led them to revise their risk assessment downwards.
However, as changes in prior phases were completed successfully, the risk assessment algorithm downgraded the risk level for the sixth phase of the configuration change to “Low” risk, including the change that caused the July 2022 outage.
I wrote about this phenomenon in a previous post, Any change can break us, but we can’t treat every change the same. The engineers gained confidence as they progressed through the migration, and things went well. Which is perfectly natural. In fact, this is one of the strengths of the continuous delivery approach: you build enough confidence that you don’t have to babysit every single deploy anymore.
But the problem is that we can never perfectly assess the risk in the system. And no matter how much confidence we build up, that one change that we believe is safe can end up taking down the whole system.
I should note that the report is pretty blame-y when it comes to this part:
Downgrading the risk assessment to “Low” for changing the Access Control List filter in a routing policy contravenes industry norms, which require high scrutiny for such configuration changes, including laboratory testing before deploying in the production network.
I wish I had more context here. How did it make sense to them at the time? What sorts of constraints or pressures were they under? Hopefully the full report reveals more details.
CleanupRogers staff deleted the policy filter that prevented IP route flooding in an effort to clean up the configuration files of the distribution routers.
Cleanup work has many of the same risks as migration work: it’s high-impact and bespoke. Say “cleanup script” to an SRE and watch the reaction on their face.
But not cleaning up is also a risk! The solution can’t be “never do cleanup” in the same way it can’t be “never do migrations”. Rather, we need to recognize that this work always involve risk trade-offs. There’s no safe path here.
Failure mode makes incident response harder
At the time of the July 2022 outage, Rogers had a management network that relied on the Rogers IP core network. When the IP core network failed during the outage, remote Rogers employees were unable to access the management network. …
Rogers staff relied on the company’s own mobile and Internet services for connectivity to communicate among themselves. When both the wireless and wireline networks failed, Rogers staff, especially critical incident management staff, were not able to communicate effectively during the early hours of the outage.
When an outage affects not just your customers but also your engineers doing incident response, life gets a whole lot harder.
This brings to mind the Facebook outage from 2021:
Component substitution fallacy[A]s our engineers worked to figure out what was happening and why, they faced two large obstacles: first, it was not possible to access our data centers through our normal means because their networks were down, and second, the total loss of DNS broke many of the internal tools we’d normally use to investigate and resolve outages like this.
The authors point out that the system was not designed to handle this sort of overload:
Absence of router overload protection. The July 2022 outage exposed the absence of overload protection on the core network routers. The network failure could have been prevented had the core network routers been configured with an overload limit that specifies the maximum acceptable number of IP routing data the router can support. However, the Rogers core network routers were not configured with such overload protection mechanisms. Hence, when the policy filter was removed from the distribution router, an excessive amount of routing data flooded the core routers, which led them to crash.
This is a great example of the component substitution fallacy, which fails to acknowledge explicit trade-offs that are made within organizations about which parts of the system to work on. Note that the Rogers engineers will certainly build in router overload protection now, but it means that’s engineering effort that won’t be spent building protections against other failure modes that haven’t happened yet.
Acknowledging trade-offsTo the authors’ credit, they explicitly acknowledge the tradeoffs involved in the overall design of the system.
The Rogers network is a national Tier 1 network and is architecturally designed for reliability; it is typical of what would be expected of such a Tier 1 service provider network. The July 2022 outage was not the result of a design flaw in the Rogers core network architecture. However, with both the wireless and wireline networks sharing a common IP core network, the scope of the outage was extreme in that it resulted in a catastrophic loss of all services. Such a network architecture is common to many service providers and is an example of the trend of converged wireline and wireless telecom networks. It is a design choice by service providers, including Rogers, that seeks to balance cost with performance.
I really hope the CRTC eventually releases the full report, I’m looking forward to reading it.


July 5, 2024
Dirty writes
For databases that support transactions, there are different types of anomalies that can potentially occur: the higher the isolation level, the more classes of anomalies are eliminated (at a cost of reduced performance).
The anomaly that I always had the hardest time wrapping my head around was the one called a dirty write. This blog post is just to provide a specific example of a dirty write scenario and why it can be problematic. (For another example, see Adrian Coyler’s post).
Here’s how a dirty write is defined in the paper A Critique of ANSI SQL Isolation Levels:
Transaction T1 modifies a data item. Another transaction T2 then further modifies that data item before T1 performs a COMMIT or ROLLBACK.
Here’s an example. Imagine a bowling alley has a database where they keep track of who has checked out a pair of bowling shoes. For historical reasons, they track the left shoe borrower and the right shoe borrower as separate columns in the database:

Once upon a time, they used to let different people check out the left and the right shoe for a given pair. However, they don’t do that anymore: now both shoes must always be checked out by the same person. This is the invariant that must always be preserved in the database.
Consider the following two transactions, where both Alice and Bob are trying to borrow the pair of shoes with id=7.
-- Alice takes the id=7 pair of shoesBEGIN TRANSACTION;UPDATE shoes SET left = "alice" WHERE id=7;UPDATE shoes SET right= "alice" WHERE id=7;COMMIT TRANSACTION;-- Bob takes the id=7 pair of shoesBEGIN TRANSACTION;UPDATE shoes SET left = "bob" WHERE id=7;UPDATE shoes SET right= "bob" WHERE id=7;COMMIT TRANSACTION;Let’s assume that these two transactions run concurrently. We don’t care about whether Alice or Bob is the one who gets the shoes in the end, as long as the invariant is preserved (both left and right shoes are associated with the same person once the transactions complete).
Now imagine that the operations in these transactions happen to be scheduled so that the individual updates and commits end up running in this order:
SET left = “alice”SET left = “bob”SET right = “bob”Commit Bob’s transactionSET right = “alice”Commit Alice’s transactionsI’ve drawn that visually here, where the top part of the diagram shows the operations grouped by Alice/Bob, and the bottom part shows them grouped by left/right column writes.

If the writes actually occur in this order, then the resulting table column will be:
idleftright7“bob”“alice”Row 7 after the two transactions completeAfter these transactions complete, this row violates our invariant! The dirty write is indicated in red: Bob’s write has clobbered Alice’s write.
Note that dirty writes don’t require any reads to occur during the transactions, nor are they only problematic for rollbacks.
Efficiency and bad outcomes
Yossi Kreinin has a new blog post out about how the push for greater efficiency in organizations leads to negative outcomes, because it leads to teams pursuing local efficiency goals rather than doing what’s genuinely best for the business.
A concrete example of this phenomenon in action is Mihail Eric’s first-hand account on how Amazon fell behind in the AI race, despite having a significant head start. There’s a ton of great detail there, I’ll excerpt just one example from the piece:
I remember on one occasion our team did an analysis demonstrating that the annotation scheme for some subset of utterance data was completely wrong, leading to incorrect data labels.
That meant for months our internal annotation team had been mislabeling thousands of data points every single day. When we attempted to get the team to change their annotation taxonomy, we discovered it would require a herculean effort to get even the smallest thing modified.
We had to get the team’s PM onboard, then their manager’s buy-in, then submit a preliminary change request, then get that approved (a multi-month-long process end-to-end).
And most importantly, there was no immediate story for the team’s PM to make a promotion case through fixing this issue other than “it’s scientifically the right thing to do and could lead to better models for some other team.” No incentive meant no action taken.
Since that wasn’t our responsibility and the lift from our side wasn’t worth the effort, we closed that chapter and moved on.
For all I know, they could still be mislabeling those utterances to this day.
And now, back to Kreinin’s original post. This bit jumped out at me, where he contrasts the pathologies of human organizational systems with the non-pathologies of biological ones:
Your legs don’t fight your heart, brain and each other for the oxygen budget; every organ only uses what it needs, and is optimized for efficiency.
It’s actually more interesting than that. Our organs don’t use only what they need: they have some surplus capacity, which they are able to lend to other organs when your body anticipates that those other organs will need the additional resources. This phenomenon is called allostasis. I find myself turning back to Peter Sterling’s paper Allostasis: A Model of Predictive Regulation:
Efficiency requires organs to trade-off resources, that is, to grant each other short-term loans. For example, resting skeletal muscle uses ~1.2 liters of oxygenated blood per minute, but peak effort requires ~22 l/min, nearly 20-fold more. Cardiac output increases, but that is insufficient, and although muscle can store fuel (glycogen and fatty acids), it cannot store much oxygen. Nor would it help to maintain a reservoir of de-oxygenated blood because at peak demand the lungs operate at full capacity. So a reservoir of de-oxygenated blood would require a reservoir of lung and heart. In turn, these would require increased capacities for digestion, absorption, excretion, and cooling. Consequently, for a non-storable resource subject to variable demand, it is most efficient to borrow.
What Kreinin points out is a real risk of what David Woods refers to as brittleness in organizations. As he points out in his theory of graceful extensibility, resilient systems require that agents within a system lend out resources to each other in times of need. But the natural inclination of management to incentivize efficiency pushes the system in the exact opposite direction. This leads to behaviors that Woods and Branlat refer to as locally adaptive but globally maladaptive.
Kreinin believes that this type of behavior is inevitable in competently managed organizations, where goals set out by management are clear, and so he argues for the potential virtues of an incompetently managed organization, where individuals are left to come up with their own goals.
If someone invites you to work for a company that’s run very badly, there might well be a good story there – this is far from guaranteed, but you might want to hear the details. And by “a good story”, I don’t mean “yay, here’s a place to slack off at,” but “maybe I can finally get some work done that I hardly ever get the chance to do.”
Ouch.
July 4, 2024
Modeling B-trees in TLA+
I’ve been reading Alex Petrov’s Database Internals to learn more about how databases are implemented. One of the topics covered in the book is a data structure known as the B-tree. Relational databases like Postgres, MySQL, and sqlite use B-trees as the data structure for storing the data on disk.
I was reading along with the book as Petrov explained how B-trees work, and nodding my head. But there’s a difference between feeling like you understand something (what the philosopher C. Thi Nguyen calls clarity) and actually understanding it. So I decided to model B-trees using TLA+ as an exercise in understanding it better.
TLA+ is traditionally used for modeling concurrent systems: Leslie Lamport originally developed it to help him reason about the correctness of concurrent algorithms. However, TLA+ works just fine for sequential algorithms as well, and I’m going to use it here to model sequential operations on B-trees.
What should it do? Modeling a key-value storeBefore I model the B-tree itself, I wanted to create a description of its input/output behavior. Here I’m going to use B-trees to implement a key-value store, where the key must be unique, and the key type must be sortable.
The key-value store will have four operations:
Get a value by key (key must be present)Insert a new key-value pair (key must not be present)Update the value of an existing pair (key must be present)Delete a key-value pair by key. (It is safe to delete a key that already exists).In traditional programming languages, you can define interfaces with signatures where you specify the types of the input and the types of the output for each signature. For example, here’s how we can specify an interface for the key-value store in Java.
interface KVStore,V> { V get(K key) throws MissingKeyException; void insert(K key, V val) throws DuplicateKeyException; void update(K key, V val) throws MissingKeyException; void delete(K key);}However, Java interfaces are structural, not behavioral: they constrain the shape of the inputs and outputs. What we want is to fully specify what the outputs are based on the history of all previous calls to the interface. Let’s do that in TLA+.
Note that TLA+ has no built-in concept of a function call. If you want to model a function call, you have to decide on your own how you want to model it, using the TLA+ building blocks of variables.
I’m going to model function calls using three variables: op, args, and ret:
op – the name of the operation (function) to execute (e.g., get, insert, update, delete)args – a sequence (list) of arguments to pass to the functionret – the return value of the functionWe’ll model a function call by setting the op and args variables. We’ll also set the ret variable to a null-like value (I like to call this NIL).
Modeling an insertion requestFor example, here’s how we’ll model making an “insert” call (I’m using ellipsis … to indicate that this isn’t the full definition), using a definition called InsertReq (the “Req” is short for request).
InsertReq(key, val) == /\ op' = "insert" /\ args' = <> /\ ret' = NIL /\ ...Here’s a graphical depiction of InsertReq, when passed the argument 5 for the key and X for the value. (assume X is a constant defined somewhere else).

The diagram above shows two different states. In the first state, op, args, and ret are all set to NIL. In the second state, the values of op and args have changed. In TLA+, a definition like InsertReq is called an action.
Modeling a response: tracking stores keys and valuesWe’re going to define an action that completes the insert operation, which I’ll call InsertResp. Before we do that, we need to cover some additional variables that we need to track. The op, args, ret model the inputs and outputs, but there are some additional internal state we need to track.
The insert function only succeeds when the key isn’t already present. This means we need to track which keys have been stored. We’re also going to need to track which values have been stored, since the get operation will need to retrieve those values.
I’m going to use a TLA+ function to model which keys have been inserted into the store, and their corresponding values. I’m going to call that function dict, for dictionary, since that’s effectively what it is.
I’m going to model this so that the function is defined for all possible keys, and if the key is not in the store, then I’ll use a special constant called MISSING.
We need to define the set of all possible keys and values as constants, as well as our special constant MISSING, and our other special constant, NIL.
This is also a good time to talk about how we need to initialize all of our variables. We use a definition called Init to define the initial values of all of the variables. We initialize op, args, and ret to NIL, and we initialize dict so that all of the keys map to the special value MISSING.
CONSTANTS Keys, Vals, MISSING, NILASSUME MISSING \notin ValsInit == /\ op = NIL /\ args = NIL /\ ret = NIL /\ dict = [k \in Keys |-> MISSING] /\ ...We can now define the InsertResp action, which updates the dict variable and the return variable.
I’ve also defined a couple of helpers called Present and Absent to check whether a key is present/absent in the store.
Present(key) == dict[key] \in ValsAbsent(key) == dict[key] = MISSINGInsertResp == LET key == args[1] val == args[2] IN /\ op = "insert" /\ dict' = IF Absent(key) THEN [dict EXCEPT ![key] = val] ELSE dict /\ ret' = IF Absent(key) THEN "ok" ELSE "error" /\ ...The TLA+ syntax around functions is a bit odd:
[dict EXCEPT ![key] = val]The above means “a function that is identical to dict, except that dict[key]=val“.
Here’s a diagram of a complete entire insert operation. I represented a function in my diagram as a set of ordered pairs, where I only explicitly show the one that changes in the diagram.
 What action can come next?
As shown in the previous section, the TLA+ model I’ve written requires two state transitions to implement a function call. In addition, My model is sequential, which means that I’m not allowing a new function call to start until the previous one is completed. This means I need to track whether or not a function call is currently in progress.
I use a variable called state, which I set to “ready” when there are no function calls currently in progress. This means that we need to restriction actions that initiate a call, like InsertReq, to when the state is ready:
InsertReq(key, val) == /\ state = "ready" /\ op' = "insert" /\ args' = <> /\ ret' = NIL /\ state' = "working" /\ ...Similarly, we don’t want a response action like InsertResp to fire unless the corresponding request has fired first, so we need to ensure both the op and the state match what we expect:
Present(key) == dict[key] \in ValsAbsent(key) == dict[key] = MISSINGInsertResp == LET key == args[1] val == args[2] IN /\ op = "insert" /\ state = "working" /\ dict' = IF Absent(key) THEN [dict EXCEPT ![key] = val] ELSE dict /\ ret' = IF Absent(key) THEN "ok" ELSE "error" /\ state' = "ready"You can find the complete behavioral spec for my key-value store, kvstore.tla, on github.
Modeling a B-treeA B-tree is similar to a binary search tree, except that each non-leaf (inner) node has many children, not just two. In addition, the values of are only stored in the leaves, not in the inner nodes. (This is technically a B+ tree, but everyone just calls it a B-tree).
Here’s a diagram that shows part of a B-tree

There are two types of nodes, inner nodes and leaf nodes. The inner nodes hold keys and pointers to other nodes. The leaf nodes hold keys and values.
For an inner node, each key, k points to a tree that contains keys that are strictly less than k. In the example above, the node 57 at the root points to a tree that contains keys less than 57, the node 116 points to keys between 57 (inclusive) and 116 exclusive, and so on.
Each inner node also has an extra pointer, which points to a tree that contains keys larger than the largest key. In the example above, the root’s extra pointer points to a tree that contains keys greater than or equal to 853.
The leaf nodes contain key-value pairs. One leaf node is shown in the example above, where key 19 corresponds to value A, key 21 corresponds to value B, etc.
Modeling the nodes and relationsIf I was implementing a B-tree in a traditional programming language, I’d represent the nodes as structs. Now, while TLA+ does have structs, I didn’t use them for modeling a B tree. Instead, following Hillel Wayne’s decompose functions of structs tip, I used TLA+ functions instead.
(I actually started with trying to model it with structs, then I switched to functions, and then later found Hillel Wayne’s advice.)
I also chose to model the nodes and keys as natural numbers, so I could easily control the size of the model by specifying maximum values for keys and nodes. I didn’t really care about changing the size of the set of values as much, so I just modeled them as a set of model values.
In TLA+. that looks like this:
CONSTANTS Vals, MaxKey,MaxNode, ...Keys == 1..MaxKeyNodes == 1..MaxNodeHere are the functions I defined:
isLeaf[node] – true if a node is a leafkeysOf[node] – the set of keys associated with a node (works for both inner and leaf nodes)childOf[node, key] – given a node and a key, return the child node it points to (or NIL if it doesn’t point to one)lastOf[Node] – the extra pointer that an inner node points tovalOf[node, key] – the value associated with a key inside a leaf nodeI also had a separate variable for tracking the root, unimaginatively called root.
When modeling in TLA+, it’s helpful to define a type invariant. Here’s the relevant part of the type invariant for these functions.
TypeOk == /\ root \in Nodes /\ isLeaf \in [Nodes -> BOOLEAN] /\ keysOf \in [Nodes -> SUBSET Keys] /\ childOf \in [Nodes \X Keys -> Nodes \union {NIL}] /\ lastOf \in [Nodes -> Nodes \union {NIL}] /\ valOf \in [Nodes \X Keys -> Vals \union {NIL}] /\ ...Modeling insertsWhen inserting an element into a B-tree, you need to find which leaf it should go into. However, nodes are allocated a fixed amount of space, and as you add more data to a node, the amount of occupied space, known as occupancy, increases. Once the occupancy reaches a limit (max occupancy), then the node has to be split into two nodes, with half of the data copied into the second node.
When a node splits, its parent node needs a new entry to point to the new node. This increases the occupancy of the parent node. If the parent is at max occupancy, it needs to split as well. Splitting can potentially propagate all of the way up to the root. If the root splits, then a new root node needs to be created on top of it.
This means there are a lot of different cases we need to handle on insert:
Is the target leaf at maximum occupancy?If so, is its parent at maximum occupancy? (And on, and on)Is its parent pointer associated with a key, or is its parent pointer that extra (last) pointer?After the node splits, should the key/value pair be inserted into the original node, or the new one?In our kvstore model, the execution of an insertion was modeled in a single step. For modeling the insertion behavior, I used multiple steps. To accomplish this, I defined a state variable, that can take on the following values during insertion:
FIND_LEAF_TO_ADD – identify which leaf the key/value pair should be inserted inWHICH_TO_SPLIT – identify which nodes require splittingSPLIT_LEAF – split a leaf nodeSPLIT_INNER – split an inner nodeSPLIT_ROOT_LEAF – split the root (when it is a leaf node)SPLIT_ROOT_INNER – split the root (when it is an inner node)I also defined two new variables:
focus – stores the target leaf to add the data totoSplit – a sequence (list) of the nodes in the chain from the leaf upwards that are at max occupancy and so require splitting.I’ll show two of the actions, the one associated with FIND_LEAF_TO_ADD and WHICH_TO_SPLIT states.
FindLeafToAdd == LET key == args[1] leaf == FindLeafNode(root, key) IN /\ state = FIND_LEAF_TO_ADD /\ focus' = leaf /\ toSplit' = IF AtMaxOccupancy(leaf) THEN <> ELSE <<>> /\ state' = IF AtMaxOccupancy(leaf) THEN WHICH_TO_SPLIT ELSE ADD_TO_LEAF /\ UNCHANGED <>WhichToSplit == LET node == Head(toSplit) parent == ParentOf(node) splitParent == AtMaxOccupancy(parent) noMoreSplits == ~splitParent \* if the parent doesn't need splitting, we don't need to consider more nodes for splitting IN /\ state = WHICH_TO_SPLIT /\ toSplit' = CASE node = root -> toSplit [] splitParent -> <> \o toSplit [] OTHER -> toSplit /\ state' = CASE node # root /\ noMoreSplits /\ isLeaf[node] -> SPLIT_LEAF [] node # root /\ noMoreSplits /\ ~isLeaf[node] -> SPLIT_INNER [] node = root /\ isLeaf[node] -> SPLIT_ROOT_LEAF [] node = root /\ ~isLeaf[node] -> SPLIT_ROOT_INNER [] OTHER -> WHICH_TO_SPLIT /\ UNCHANGED <>You can see that the WhichToSplit action starts to get a bit hairy because of the different cases.
Allocating new nodesWhen implementing a B-tree, we need to dynamically allocate a new node when an existing node gets split, and when the root splits and we need a new root.
The way I modeled this was to through the concept of a free node. I modeled the set of Nodes as a constant, and I treated some nodes as part of the existing tree, and other nodes as free nodes. When I needed a new node, I used one of the free ones.
I could have defined an isFree function, but instead I considered a node to be free if it was a leaf (which all nodes are set at initialized to in Init) without any keys (since all leaves that are part of the tree.
\* We model a "free" (not yet part of the tree) node as one as a leaf with no keysIsFree(node) == isLeaf[node] /\ keysOf[node] = {}Sanity checking with invariantsI defined a few invariants to check that the btree specification was behaving as expected. These caught some errors in my model as I went along. I also had an invariant that checks if there are any free nodes left. If not, it meant I needed to increase the number of nodes in the model relative to the number of keys.
\*\* Invariants\*Inners == {n \in Nodes: ~isLeaf[n]}InnersMustHaveLast == \A n \in Inners : lastOf[n] # NILKeyOrderPreserved == \A n \in Inners : (\A k \in keysOf[n] : (\A kc \in keysOf[childOf[n, k]]: kc < k))LeavesCantHaveLast == \A n \in Leaves : lastOf[n] = NILKeysInLeavesAreUnique == \A n1, n2 \in Leaves : ((keysOf[n1] \intersect keysOf[n2]) # {}) => n1=n2FreeNodesRemain == \E n \in Nodes : IsFree(n)Partially complete model (no deletions)You can find the full model in the btree.tla file in the GitHub repo. Note that I didn’t get around to modeling deletions. I was happy with just get/insert/update, and I figured that it would be about as much work as modeling inserts, which was quite a bit.
Does our model match the behavioral spec?Recall that we stored by defining a behavioral specification for a key-value store. We can check that the B-Tree implements this behavioral specification by defining a refinement mapping.
My btree model uses many of the same variables as the kvstore model, but there are two exceptions:
the kvstore model has a dict variable (a function that maps keys to values) which the btree model doesn’t.Both models have a variable named state, but in the kvstore model this variable only take the values “ready” and “working”, whereas in the btree model it take on other values, because the btree model has finer-grained states.This means we need to define mappings from the variables in the btree model to the variables in the kvstore model. Here’s how I did it:
Mapping == INSTANCE kvstore WITH dict IF \E leaf \in Leaves : key \in keysOf[leaf] THEN LET leaf == CHOOSE leaf \in Leaves : key \in keysOf[leaf] IN valOf[leaf, key] ELSE MISSING], stateFor the other variables (op, args, ret), the default mapping works just fine.
We can then use the model checker (TLC) to check the Refinement property. I’m using the , which drives the model checker using config files. I added this to my btree.cfg to tell it to check the “Refinement” temporal property defined above.
PROPERTYRefinementBy doing this, the model checker will verify that:
every valid initial state for the btree model is also a valid initial state for the kvstore modelevery valid state transition for the btree model is also a valid state transition for the kvstore model.And, indeed, the model checker succeeds!
Hey, why did the model checker succeed when you didn’t implement delete?You’ll note that the original kvstore model handles a delete operation, but my btree model doesn’t. The reason that checking the refinement property didn’t pick up in this is that it’s valid behavior under the definition of the kvstore model for it to never actually call delete.
In the formal methods jargon, the btree spec does not violate any of the safety properties of the kvstore spec (i.e., the btree spec never makes a state transition that would be disallowed by the kvstore spec). But to check that btree implements the delete function, we need what’s called a liveness property.
We can define a liveness property by altering the kvstore model to require that delete operations be performed, by specifying fairness in our kvstore model.
Here’s the general form of a TLA+ specification, where you define an initial state predicate (Init) and a next-state predict (Next). It looks like this.
Spec == Init /\ [][Next]_varsFor the kvstore model, I added an additional fairness clause.
Spec == Init /\ [][Next]_vars /\ WF_op(\E k \in Keys: DeleteReq(k))Informally, that extra clause says, “if the model ever reaches a state where it can run a delete operation, it should eventually perform the operation”. (More formally, it says that: If the predicate \E k \in Keys: DeleteReq(k) becomes forever enabled, then there must be a step (state transition) where the op variable changes state.)
Effectively, it’s now part of the kvstore specification that it perform delete operations. When I then run the model checker, I get the error: “Temporal properties were violated.“
Choosing the grain of abstractionOne of the nice things about TLA+ is that you can choose how granular you want your model to be. For example, in my model, I assumed that both inner and leaf nodes had occupancy determined by the number of elements. In a real B-tree, that isn’t true. The data stored in the inner nodes is a list of (key, pointer) pairs, which are fixed size. But the actual values, the data stored, is variable size (for example, consider variable-sized database records like varchars and blobs).
Managing the storage is more complex within the leaves than in the inner nodes, and Petrov goes into quite a bit of detail on the structure of a B-tree leaf in his book. I chose not to model these details in my btree spec: The behavior of adding and deleting the data within a leaf node is complex enough that, if I were to model the internal behavior of leaves, I’d use a separate model that was specific to leaf behavior.
Formal modeling as a tool of thoughtI found this a useful exercise for understanding how B-trees work. It was also helpful to practice my TLA+ skills. TLA+ allows you to abstract away all of the details that you consider irrelevant. However, for whatever remains, you need to specify things exhaustively: precisely how every variable changes, in every possible transition. This can be tedious, but it also forces you to think through each case.
You can find the TLA+ files at github.com/lorin/btree-tla.
June 2, 2024
Action item template
We’re thrilled that you want to contribute to improving the system in the wake of an incident! For each post-incident action that you are proposing, we would appreciate it if you would fill out the following template.
Please estimate the expected benefits associated with implementing the action item. For example, if this reduces risk, by how much? Please document your risk model. How will you validate this estimate?
Please estimate the costs associated with implementing the proposed action items. In particular:
What are the costs in engineering effort (person-days of work) to do the initial implementation? What are the ongoing maintenance costs in terms of engineering effort?What are the additional infrastructure costs?In addition, please estimate the opportunity costs associated with this action item: if this action item is prioritized, what other important work will be deprioritized as a result? What were the expected benefits of the deprioritized work? How do these unrealized benefits translate into additional costs or risks?
Given that we know we can never implement things perfectly (otherwise the incident wouldn’t have happened, right?), what are the risks associated with a bug or other error when implementing the proposed action item?
Even if the action item is implemented flawlessly, the resulting change in behavior can lead to unforeseen interactions with other parts of the system. Please generate a list of potential harmful interactions that could arise when this action item is implemented. Please be sure to track these and refer back to them if a future incident occurs that involves this action item, to check how well we are able to reason about such interactions.
More generally: will the proposed action item increase or decrease the overall complexity of the system? If it will increase complexity, compare what the costs and/or risks are of the resulting increase in complexity, and compare these to the proposed benefits of the implemented action item.
Will the proposed action item increase or decrease the overall cognitive load on people? If it will increase cognitive load, please estimate the expected magnitude of this increase, and document a plan for evaluating the actual increase after the action item has been implemented.
Beyond cognitive load, is this action going to prevent or otherwise make more difficult any work that goes on today? How will you identify whether this is the case or not? Please document your plan for measuring the resultant increase in difficulty due to the action item.
More generally: will the implementation of this action item lead to people changing the way they do they work? What sort of workarounds or other adaptations may occur as a result, and what are the associated risks of these? What are all of the different types of work that go on in the organization that will be impacted by this change? How will you verify that your list is complete? Please document your plan for studying how the work has actually changed in response to this action item, and how you will contrast the findings with your expectations.
Once the action item has been completed, how are you going to track it unexpectedly contributes to an incident in the future? Please outline your plan for how we will maintain accountability for the impact of completed action items.
May 26, 2024
You can’t judge risk in hindsight
A while back, the good folks at Google SRE posted an article titled Lessons Learned from Twenty Years of Site Reliability Engineering. There’s some great stuff in here, but I wanted to pick on the first lesson: The riskiness of a mitigation should scale with the severity of the outage. Here are some excerpts from the article (emphasis mine)
Let’s start back in 2016, when YouTube was offering your favorite videos such as “Carpool Karaoke with Adele” and the ever-catchy “Pen-Pineapple-Apple-Pen.” YouTube experienced a fifteen-minute global outage, due to a bug in YouTube’s distributed memory caching system, disrupting YouTube’s ability to serve videos.
…
We, here in SRE, have had some interesting experiences in choosing a mitigation with more risks than the outage it’s meant to resolve. During the aforementioned YouTube outage, a risky load-shedding process didn’t fix the outage… it instead created a cascading failure.
We learned the hard way that during an incident, we should monitor and evaluate the severity of the situation and choose a mitigation path whose riskiness is appropriate for that severity.
The question I had reading this was: how did the authors make the judgment that the load-shedding mitigation was risky? In particular, how was the risk of the mitigation perceived in the moment? Note: this question is still relevant, even if the authors/contributors were the actual responders!
When a bad outcome happens, it’s easy to say with hindsight that the action was risky. But we can really only judge the riskiness based on what was understood by the operators at the time they had to make the call. As the good Dr. Cook noted in the endlessly quotable How Complex Systems Fail, all practitioner actions are gambles:
After accidents, the overt failure often appears to have been inevitable and the
practitioner’s actions as blunders or deliberate willful disregard of certain impending
failure. But all practitioner actions are actually gambles, that is, acts that take place in the
face of uncertain outcomes. The degree of uncertainty may change from moment to moment. That practitioner actions are gambles appears clear after accidents; in general, post hoc analysis regards these gambles as poor ones. But the converse: that successful
outcomes are also the result of gambles; is not widely appreciated.
I have no firsthand knowledge of this particular incident. But, just as nobody ever wakes up and says “I’m going to do a bad job today”, nobody wakes up and says “I’m going to take unnecessary risks today.” Doing operations work means making risk trade-offs under uncertainty. We generally don’t know in advance how risky a particular mitigation will be. I think the real lessons is to recognize the inherent challenge that operators face in these scenarios.
The problem with a root cause is that it explains too much
The recent performance of the stock market brings to mind the comment of a noted economist who was once asked whether the market is a good leading indicator of general economic activity. Wonderful, he replied sarcastically, it has predicted nine of the last four recessions. – Alfred L. Malabre Jr., 1968 March 4, The Wall Street Journal
In response to my previous post, Peter Ludemann made the following observation on Mastodon:

This post makes the case for why I would still call these contributors rather than root causes, even though they certainly sound root-cause-y. (They’re also fantastic examples of risks that are very common in the types of systems we work in, but that’s not the topic of this particular post).
Let’s take the first one, “a configuration system that makes mistakes easy.” I’d ask the question, “does an incident occur every single time somebody uses the configuration system?” I don’t know the details of the particular incident(s) that Peter is alluding to, but I’m willing to bet that this isn’t true. Rather, I assume what he is saying is that the configuration system is fundamentally unsafe in some way (e.g., it’s too easy to unintentionally take a dangerous action), and every once in a while a dangerous mistake would happen and an incident would occur.
What this means is that the unsafe configuration system by itself isn’t sufficient for the incident to occur! The config system enables incidents to occur, but it doesn’t, by itself, create the incident. Rather, it’s a combination of the configuration system, and some other factors, that trigger incidents. Maybe incidents only manifests when there is a particular action a user is trying to take, or maybe some people know how to work around the sharp edges and others don’t, or other things.
This may sound like sophistry. After all, the configuration system is an unsafe operator interface. The lesson from an incident is that we should fix it! However, here’s the problem with that line of thinking. The truth is that there are many types of these sorts of problems in a system. I like to call these problems vulnerabilities, even though people usually reserve that term in a security context. Peter gives three examples, but our systems are really shot through with these sorts of vulnerabilities. There are all sorts of unsafe operator interfaces, assumptions that have become invalidated with change, dangerous potential interactions between components, and so on. These vulnerabilities are the sorts of issues that the safety researcher James Reason referred to as latent pathogens. Reason is the one who proposed the Swiss cheese model, with the latent pathogens being the holes in the cheese.
My problem with labeling these vulnerabilities as root causes is that this obscures how our systems actually spend most of their time up, even though these vulnerabilities are always present. Let’s say you were able to identify every vulnerability you had in a system. If you each one as a root cause of an outage, then your system should be down all of the time, because these vulnerabilities are all present in your system!
But your system isn’t down all of the time: in fact, it’s up more often than it’s down, even though these vulnerabilities are omnipresent. And the reason your system is up more than it’s down is that these vulnerabilities are not, by themselves, sufficient to take down a system. If you label these vulnerabilities as root causes, you make it impossible to understand to how your system actually succeeds. And if you don’t know how it succeeds, you can’t understand how it fails. You’re like the economist predicting recessions that don’t happen.
Now, whether we label these vulnerabilities as root causes or not, they clearly represent a risk to your system. But we have an additional problem: we live in the adaptive universe. That means we don’t actually have the resources (in particular, the time) to identify and patch all of these vulnerabilities. And, even if we could stop the world, find them all, and fix them all, and start the world again, our system keeps changing over time, and new vulnerabilities would set in. And that doesn’t even take into account how patching these vulnerabilities can create new ones. The adaptive universe also teaches us that our work will inevitably introduce new vulnerabilities because we only have a finite amount of time to actually do that work. Mistaking problems with individual components with the general problem of finite resources is the component substitution fallacy.
In short, labeling vulnerabilities as root causes is dangerous because it blinds us to the nature of how complex systems manage to stay up and running most of the time, even though vulnerabilities within the system are always with us. Now, these vulnerabilities are still risks! However, they may or may not manifest as incidents. In addition, we can’t predict which ones will bite us, and we don’t have the resources to root all of them out. We use “this just bit us so we should address it because otherwise it will bite us again” a heuristic, but it’s an implicit one. What we should be asking is “given that we have limited resources, is spending the time addressing this particular vulnerability worth the opportunity cost of delaying other work?”
May 25, 2024
The error term isn’t Pareto distributed
You’re probably familiar with the 80-20 rule: when 80% of the X stems from only 20% of the Y. For example, 80% of your revenue comes from only 20% of your customer, or 80% of the logs that you’re storing are generated from only 20% of the services. Talk to anybody who is looking to reduce cloud costs in their organization, and chances are they’re attacking the problem by looking for the 20% of services that are generating 80% of the costs, rather than trying to reduce cloud usage uniformly across all services.
Not all phenomena follow the 80-20 rule, but it’s common enough in the systems we encounter that it’s a good rule of thumb. The technical term for it is the Pareto principle, and distributions that exhibit this 80-20 phenomena are an example of Pareto distributions, also known as power law distributions.
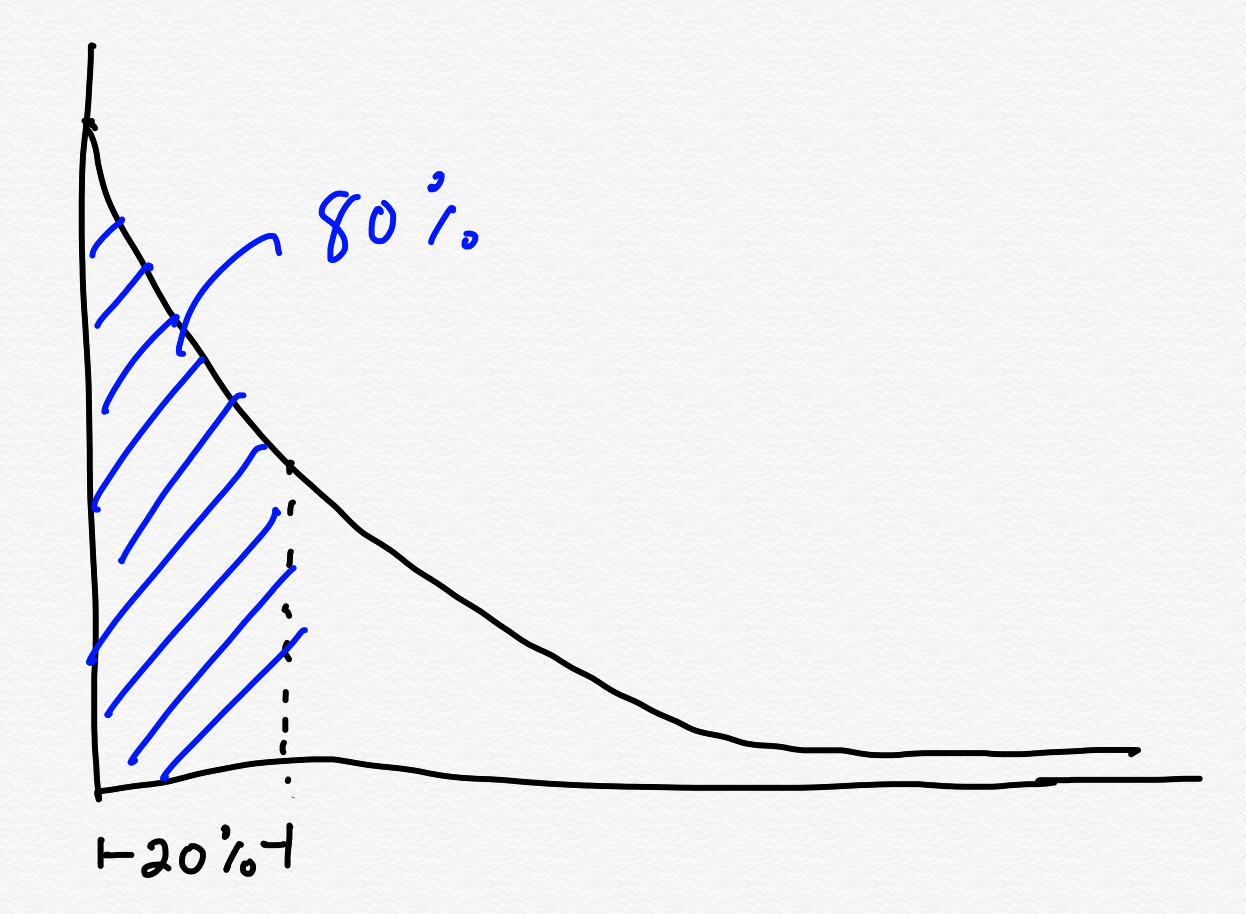
A common implicit assumption is that availability problems are Pareto-distributed. If you look at incidents and keep track of their causes, you should be able to identify a small number of causes that lead to the majority of the incidents. Because of this, we should attribute a cause to an incident, and then look to see which causes most often contribute to incident in order to identify interventions that will have the largest impact: those 20% of improvements that should yield 80% improvements. If you believe in the RCA (root cause analysis) model of incidents, that’s a reasonable assumption to make: identify the root cause of each incident, track these across incidents, and then invest in projects that attack the most expensive root causes.
 If we can identify the problematic red dots, we can achieve significant improvements
But if you’re a frequent reader of this blog, you know there’s an alternative model of how incidents come to be. I’m fond of referring to the alternative as the LFI (learning from incidents) model. However, in the safety science research community this alternative model is more commonly associated with terms such as the New View, the New Look, or Safety-II.
The contrast of the LFI model with the RCA model is captured well in Richard Cook’s famous monograph, How Complex Systems Fail:
Post-accident attribution accident to a ‘root cause’ is fundamentally wrong.
Because overt failure requires multiple faults, there is no isolated ‘cause’ of an accident.
There are multiple contributors to accidents. Each of these is necessary insufficient in
itself to create an accident. Only jointly are these causes sufficient to create an accident.
Indeed, it is the linking of these causes together that creates the circumstances required
for the accident.
In this model, incidents don’t happen because of a single cause: rather, it’s through the interaction of multiple contributors.
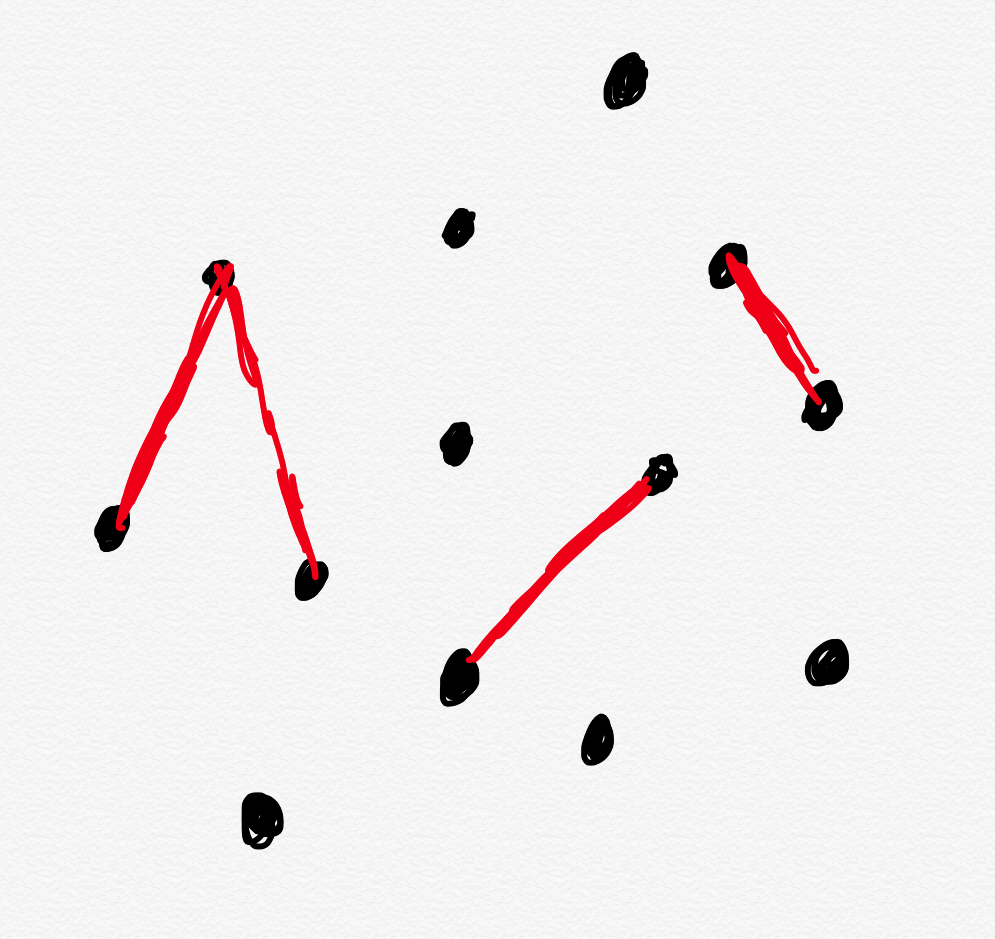 If incidents stem from problematic interactions rather than problematic components, then focusing on components will lead us astray
Under an incident model where incidents are a result of interactions, we wouldn’t expect there to be a Pareto distribution of causes. This means that if we look at a distribution of incidents by contributor (or cause, or component), we’re unlikely to see any one of these stand out as being the source of a large number of incidents. Instead, by looking at the components instead of the interactions, we’re unlikely to see much of any pattern at all.
Turning back to How Complex Systems Fail again:
Complex systems are heavily and successfully defended against failure.
The high consequences of failure lead over time to the construction of multiple layers of
defense against failure. These defenses include obvious technical components (e.g.
backup systems, ‘safety’ features of equipment) and human components (e.g. training,
knowledge) but also a variety of organizational, institutional, and regulatory defenses
(e.g. policies and procedures, certification, work rules, team training). The effect of these
measures is to provide a series of shields that normally divert operations away from
accidents.
All of these explicit and implicit components of the system work together to keep things up and running. You can think of this as a process that most of the time generates safety (or availability), but sometimes doesn’t. You can think of these failure cases as a sort of error or residual term, they’re the leftover, the weird cases at the edges of our system. I think treating incidents as an error term is a useful metaphor because we don’t fall into the trap of thinking about error terms as looking like Pareto distributions.
This doesn’t mean that there aren’t patterns of failure in our incidents: there absolutely are. But it means that the patterns we need to look for aren’t going to visible if we don’t ask the right questions. It’s the difference between asking “which services were involved?” and “what were the goal conflicts that the engineers were facing?“
May 5, 2024
Green is the color of complacency
Here are a few anecdotes about safety from the past few years.
In 2020, the world was struck by the COVID-19 pandemic. The U.S. response was… not great. Earlier in 2019, before the pandemic struck, the Johns Hopkins Center for Health Security released a pandemic preparedness assessment that ranked 195 countries on how well prepared they were to deal with a pandemic. The U.S. was ranked number one: it was identified as the most well-prepared country on earth.
With its pandemic playbook, “The U.S. was very well prepared,” said Eric Toner, senior scholar at the Johns Hopkins Center for Health Security. “What happened is that we didn’t do what we said we’d do. That’s where everything fell apart. We ended up being the best prepared and having one of the worst outcomes.”
On October 29, 2018, Lion Air Flight 610 crashed 13 minutes after takeoff, killing everyone on board. This plane was a Boeing 737 MAX, and a second 737 MAX had a fatal crash a few months later. Seven days prior to the Lion Air crash, the National Safety Council presented the Boeing Company with the Robert W. Campbell Award for leadership in safety:
“The Boeing Company is a leader in one of those most safety-centric industries in the world,” said Deborah A.P. Hersman, president and CEO of the National Safety Council. “Its innovative approaches to EHS excellence make it an ideal recipient of our most prestigious safety award. We are proud to honor them, and we appreciate their commitment to making our world safer.”
On April 20th, 2010, an explosion on the Deepwater Horizon offshore drilling rig killed eleven workers and led to the largest marine oil spill in the history of the industry. The year before, the U.S. Minerals Management Service issued its SAFE award to Deepwater Horizon:
MMS issued its SAFE award to Transocean for its performance in 2008, crediting the company’s “outstanding drilling operations” and a “perfect performance period.” Transocean spokesman Guy Cantwell told ABC News the awards recognized a spotless record during repeated MMS inspections, and should be taken as evidence of the company’s longstanding commitment to safety.
When things are going badly, everybody in the org knows it. If you go into an organization where high-severity incidents are happening on a regular basis, where everyone is constantly in firefighting mode, then you don’t need metrics to tell you how bad things are: it’s obvious to everyone, up and down the chain. The problems are all-too-visible. Everybody can feel them viscerally.
It’s when things aren’t always on fire that it can be very difficult to assess whether we need to allocate additional resources to reduce risk. As the examples above show, absence of incidents do not indicate an absence of risk. In fact, these quiet times can lull is into a sense of complacency, leading us to think that we’re in a good spot, when the truth is that there’s a significant risk that’s hidden beneath the surface.
Personally, I don’t believe it’s even possible to say with confidence that “everything is ok with right now”. As the cases above demonstrate, when things are quiet, there’s a limit to how well we can actually assess the risk based on the kinds of data we traditionally collect.
So, should you be worried about your system? If you find yourself constantly in firefighting mode, then, yes, you should be worried. And if things are running smoothly, and the availability metrics are all green? Then, also yes, you should be worried. You should always be worried. The next major incident is always just around the corner, no matter how high your ranking is, or how many awards you get.
May 4, 2024
The perils of outcome-based analysis
Imagine you wanted to understand how to get better at playing the lottery. You strike upon a research approach: study previous lottery winners! You collect a list of winners, look them up, interview them about how they go about choosing their numbers, collate this data, identify patterns, and use these to define strategies for picking numbers.
The problem with this approach is that it doesn’t tell you anything about how effective these strategies actually are. To really know how well these strategies work, you’d have to look at the entire population of people who employed them. For example, say that you find that most lottery winners use their birthdays to generate winning numbers. It may turn out, that for every winning ticket that has the ticket holder’s birthday, there are 20 million losing tickets that also have the ticket holder’s birthday. To understand a strategy’s effectiveness, you can’t just look at the winning outcomes: you have to look at the losing outcomes as well. The technical term for this type of analytic error is selecting on the dependent variable.
Here’s another example of this error in reasoning: according to the NHTSA, 32% of all traffic crash fatalities in the United States involve drunk drivers. That means that 68% of all traffic crash fatalities involve sober drivers. If you only look at scenarios that involve crash fatalities, it looks like being sober is twice as dangerous as being drunk! It’s a case of only looking at the dependent variable: crash fatalities. If we were to look at all driving scenarios, we’d see that there are a lot more sober drivers than drunk drivers, and that any given sober driver is less likely to get into a crash fatality than a given drunk driver. Being sober is safer, even though sober drivers appear more often in fatal accidents than drunk drivers.
Now, imagine an organization that holds a weekly lottery. But it’s a bizarro-world type of lottery: if someone wins, then they receive a bad outcome instead of a good one. And the bad outcome doesn’t just impact the “winner” (although they are impacted the most), it has negative consequences for the entire organization. Nobody would willingly participate in such a lottery, but everyone in the organization is required to: you can’t opt out. Every week, you have to buy a ticket, and hope the numbers you picked don’t come up.
The organization wants to avoid these negative outcomes, and so they try to identify patterns in how previous lottery “winners” picked their numbers, so that they can reduce the likelihood of future lottery wins by warning people against using these dangerous number-picking strategies.
At this point, the comparison to how we treat incidents should be obvious. If we only examine people’s actions in the wake of an incident, and not when things go well, then we fall into the trap of selecting on the dependent variable.
The real-world case is even worse than the lottery case: lotteries really are random, but that way that people do their work isn’t; rather, it’s adaptive. People do work in specific ways because they have found that it’s an effective way to get stuff done given that the constraints that they are under. The only way to really understand why people work the way they do is to understand how those adaptations usually succeed. Unless you’re really looking for it, you aren’t going to be able to learn how people develop successful adaptations if you only ever examine the adaptations when they fail. Otherwise, you’re just doing the moral equivalent of asking what lottery winners have in common.