Lorin Hochstein's Blog, page 7
August 29, 2024
You can specify even when you can’t implement
The other day, The Future of TLA+ (pdf) hit Hacker News. TLA+ is a specification language: it is intended for describing the desired behavior of a system. Because it’s a specification language, you don’t need to specify implementation details to describe desired behavior. This can be confusing to experienced programmers who are newcomers to TLA+, because when you implement something in a programming language, you can always use either a compiler or an interpreter to turn it into an executable. But specs written in a specification language aren’t executable, they’re descriptions of permitted behaviors.
Just for fun, here’s an example: a TLA+ specification for a program that solves the twin prime conjecture. According to this spec, when the program runs, it will set the answer variable to either “yes” if the twin prime conjecture is true, or “no” if the conjecture is false.
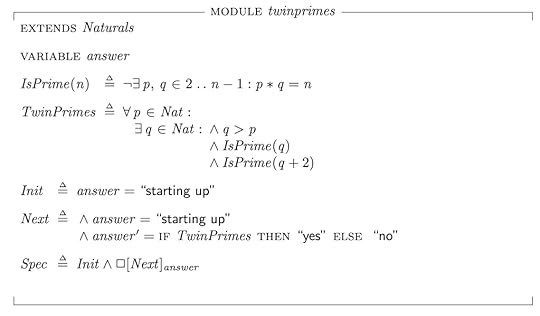
Unfortunately, if I was to try to write a program that implements this spec, I don’t know whether answer should be set to “yes” or “no”: the conjecture has yet to be proven or disproven. Despite this, have still formally specified its behavior!
August 11, 2024
The “CrowdStrike” approach to reliability work
There’s a lot we simply don’t know about how reliability work was prioritized inside of CrowdStrike, but I’m going to propose a little thought experiment about the incident where I make some assumptions.
First, let’s assume that the CrowdStrike incident was the first time they had an incident that was triggered by a Rapid Response Content update, which is a config update. We’ll assume that previous sensor issues that led to Linux crashes were related to a sensor release, which is a code update.
Next, let’s assume that CrowdStrike focuses their reliability work on addressing the identified root cause of previous incidents.
Finally, let’s assume that none of the mitigations documented in their RCA were identified as action items that addressed the root cause of any incidents they experienced before this big one.
If these three assumptions are true, then it explains why these mitigations weren’t done previously. Because they didn’t address the root causes of previous incidents, and they focus their post-incident work on identifying the root cause of previous incidents. Now, I have no idea if any of these assumptions are actually true, but they sound plausible enough for this thought experiment to hold.
This thought experiment demonstrates the danger of focusing post-incident work on addressing the root causes of previous incidents: it acts to obscure other risks in the system that don’t happen to fit into the root cause analysis. After all, issues around validation of the channel files or staging of deploys were not really the root cause of any of the incidents before this one. The risks that are still in your system don’t care about what you have labeled “the real root cause” of the previous incident, and there’s no reason to believe that whatever gets this label is the thing that is most likely to bite you in the future.
I propose (cheekily) to refer to the prioritize-identifying-and-addressing-the-root-cause–of-previous-incidents thinking as the “CrowdStrike” approach to reliability work.
I put “CrowdStrike” in quotes because, in a sense, this really isn’t about them at all: I have no idea if the assumptions in this thought experiment are true. But my motivation for using this phrase is more about using CrowdStrike as a symbol that’s become salient to our industry then about the particular details of that company.
Are you on the lookout for the many different signals of risk in your system, or are you taking the “CrowdStrike” approach to reliability work?
August 7, 2024
CrowdStrike: how did we get here?
CrowdStrike has released their final (sigh) External Root Cause Analysis doc. The writeup contains some more data on the specific failure mode. I’m not going to summarize it here, mostly because I don’t think I’d add any value in doing so: my knowledge of this system is no better than anyone else reading the report. I must admit, though, that I couldn’t helping thinking of number eleven in Alan Perlis’s epigrams in programming.
If you have a procedure with ten parameters, you probably missed some.
What I wanted to do instead with this blog is call out the last two of the “findings and mitigations” in the doc:
Template Instance validation should expand to include testing within the Content Interpreter Template Instances should have staged deploymentThis echos the chorus of responses I heard online in the aftermath of the outage. “Why didn’t they test these configs before deployment? How could they not stage their deploys?”
And this is my biggest disappointment with this writeup: it doesn’t provide us with insight into how the system got to this point.
Here are the types of questions I like to ask to try to get at this.
Had a rapid response content update ever triggered a crash before in the history of the company? If not, why do you think this type of failure (crash related to rapid response content) has never bitten the company before? If so, what happened last time?
Was there something novel about the IPC template type? (e.g., was this the first time the reading of one field was controlled by the value of another?)
How is generation of the test template instances typically done? Was the test template instance generation here a typical case or an exceptional one? If exceptional, what was different? If typical, how come it has never led to problems before?
Before the incident, had customers ever asked for the ability to do staged rollouts? If so, how was that ask prioritized relative to other work?
Was there any planned work to improve reliability before the incident happened? What type of work was planned? How far along was it? How did you prioritize this work?
I know I’m a broken record here, but I’ll say it again. Systems reach the current state that they’re in because, in the past, people within the system made rational decisions based on the information they had at the time, and the constraints that they were operating under. The only way to understand how incidents happen is to try and reconstruct the path that the system took to get here, and that means trying to as best as you can to recreate the context that people were operating under when they made those decisions.
In particular, availability work tends to go to the areas where there was previously evidence of problems. That tends to be where I try to pick at things. Did we see problems in this area before? If we never had problems in this area before, what was different this time?
If we did see problems in the past, and those problems weren’t addressed, then that leads to a different set of questions. There are always more problems than resources, which means that orgs have to figure out what they’re going to prioritize (say “quarterly planning” to any software engineer and watch the light fade from their eyes). How does prioritization happen at the org?
It’s too much to hope for a public writeup to ever give that sort of insight, but I was hoping for something more about the story of “How we got here” in their final writeup. Unfortunately, it looks like this is all we get.
August 4, 2024
Modeling a CLH lock in TLA+
The last post I wrote mentioned in passing how Java’s ReentrantLock class is implemented as a modified version of something called a CLH lock. I’d never heard of a CLH lock before, and so I thought it would be fun to learn more about it by trying to model it. My model here is based on the implementation described in section 3.1 of the paper Building FIFO and Priority-Queueing Spin Locks from Atomic Swap by Travis Craig.
This type of lock is a first-in-first-out (FIFO) spin lock. FIFO means that processes acquire the lock in order in which they requested it, also known as first-come-first-served. A spin lock is a type of lock where the thread runs in a loop continually checking the state of a variable to determine whether it can take the lock. (Note that Java’s ReentrantLock is not a spin lock, despite being based on CLH).
Also note that I’m going to use the terms process and thread interchangeably in this post. The literature generally uses the term process, but I prefer thread because of the shared-memory nature of the lock.
Visualizing the state of a CLH lockI thought I’d start off by showing you what a CLH data structure looks like under lock contention. Below is a visualization of the state of a CLH lock when:
There are three processes (P1, P2, P3)P1 has the lockP2 and P3 are waiting on the lockThe order that the lock was requested in is: P1, P2, P3
The paper uses the term requests to refer to the shared variables that hold the granted/pending state of the lock, those are the boxes with the sharp corners. The head of the line is at the left, and the end of the line is at the right, with a tail pointer pointing to the final request in line.
Each process owns two pointers: watch and myreq. These pointers each point to a request variable.
If I am a process, then my watch pointer points to a request that’s owned by the process that’s ahead of me in line. The myreq pointer points to the request that I own, which is the request that the process behind in me line will wait on. Over time, you can imagine the granted value propagating to the right as the processes release the lock.
This structure behaves like a queue, where P1 is at the head and P3 is at the tail. But it isn’t a conventional linked list: the pointers don’t form a chain.
Requesting the lockWhen a new process requests the lock, it:
points its watch pointer to the current tailcreates a new pending request object and points to it with its myreq pointerupdates the tail to point to this new objectReleasing the lockTo release the lock, a process sets the value of its myreq request to granted. (It also takes ownership of the watch request, setting myreq to that request, for future use).
Modeling desired high-level behaviorBefore we build our CLH model, let’s think about how we’ll verify if our model is correct. One way to do this is to start off with a description of the desired behavior of our lock without regard to the particular implementation details of CLH.
What we want out of a CLH lock is a lock that preserves the FIFO ordering of the requests. I defined a model I called FifoLock that has just the high-level behavior, namely:
it implements mutual exclusionthreads are granted the lock in first-come-first-served orderExecution pathHere’s the state transition diagram for each thread in my model. The arrows are annotated with the name of the TLA+ sub-actions in the model.
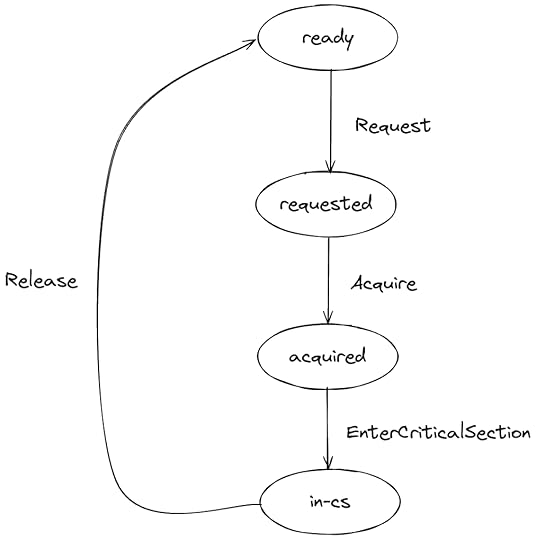 FIFO behavior
To model the FIFO behavior, I used a TLA+ sequence to implement a queue. The Request action appends the thread id to a sequence, and the Acquire action only grants the lock to the thread at the head of the sequence:
Request(thread) == /\ queue' = Append(queue, thread) ...Acquire(thread) == /\ Head(queue) = thread ...The FifoLock behavior model can be found at https://github.com/lorin/clh-tla/blob/main/FifoLock.tla.
The CLH modelNow let’s build an actual model of the CLH algorithm. Note that I called these processes instead of threads because that’s what the original paper does, and I wanted to stay close to the paper in terminology to help readers.
The CLH model relies on pointers. I used a TLA+ function to model pointers. I defined a variable named requests that maps a request id to the value of the request variable. This way, I can model pointers by having processes interact with request values using request ids as a layer of indirection.
---- MODULE CLH ----...CONSTANTS NProc, GRANTED, PENDING, Xfirst == 0 \* Initial request on the queue, not owned by any processProcesses == 1..NProcRequestIDs == Processes \union {first}VARIABLES requests, \* map request ids to request state ...TypeOk == /\ requests \in [RequestIDs -> {PENDING, GRANTED, X}] ...(I used “X” to mean “don’t care”, which is what Craig uses in his paper).
The way the algorithm works, there needs to be an initial request which is not owned by any of the process. I used 0 as the Request id for this initial request and called it first.
The myreq and watch pointers are modeled as functions that map from a process id to a request id. I used -1 to model a null pointer.
NIL == -1TypeOk == /\ myreq \in [Processes -> RequestIDs] /\ watch \in [Processes -> RequestIDs \union {NIL}] ...Execution pathThe state-transition diagram for each process in our CLH model is similar to the one in our abstract (FifoLock) model. The only real difference is that requesting the lock is done in two steps:
Update the request variable to pending (MarkPending)Append the request to the tail of the queue (EnqueueRequest)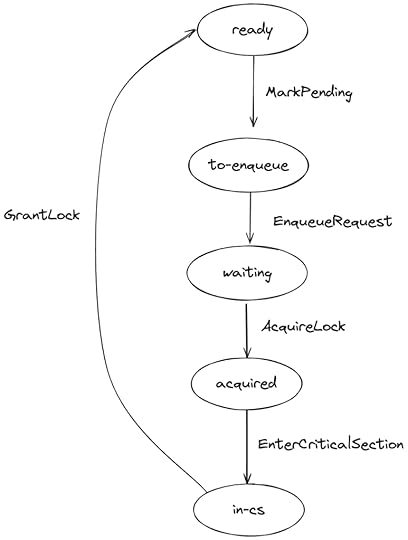
The CLH model can be found at https://github.com/lorin/clh-tla/blob/main/CLH.tla.
Checking our CLH model’s behaviorWe want to verify that our CLH model always behaves in a way consistent with our FifoLock model. We can check this in using the model checker by specifying what’s called a refinement mapping. We need to show that:
We can create a mapping from the CLH model’s variables to the FifoLock model’s variables.Every valid behavior of the CLH model satisfies the FifoLock specification under this mapping.The mappingThe FifoLock model has two variables, state and queue.
---- MODULE FifoLock ----...VARIABLES state, queueTypeOK == /\ state \in [Threads -> {"ready", "requested", "acquired", "in-cs"}] /\ queue \in Seq(Threads)The state variable is a function that maps each thread id to the state of that thread in its state machine. The dashed arrows show how I defined the state refinement mapping:
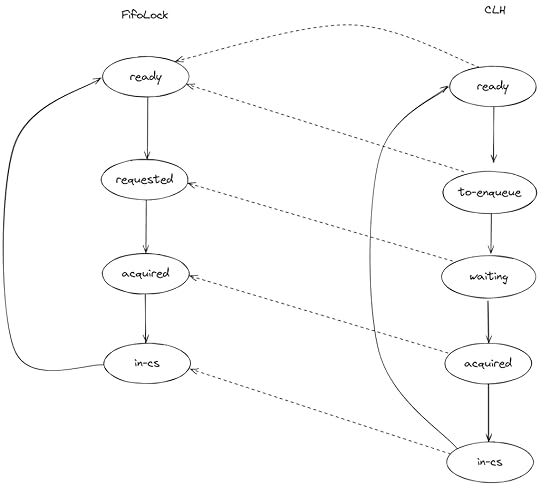
Note that two states in the CLH model (ready, to-enqueue) map to one state in FifoLock (ready).
For the queue mapping, I need to take the CLH representation (recall it looks like this)…

…and define a transformation so that I end up with a sequence that looks like this, which represents the queue in the FifoLock model:
<>To do that, I defined a helper operator called QueueFromTail that, given a tail pointer in CLH, constructs a sequence of ids in the right order.
Unowned(request) == ~ \E p \in Processes : myreq[p] = request\* Need to reconstruct the queue to do our mappingRECURSIVE QueueFromTail(_)QueueFromTail(rid) == IF Unowned(rid) THEN <<>> ELSE LET tl == CHOOSE p \in Processes : myreq[p] = rid r == watch[tl] IN Append(QueueFromTail(r), tl)Then I can define the mapping like this:
Mapping == INSTANCE FifoLock WITH queue CASE state[p]="ready" -> "ready" [] state[p]="to-enqueue" -> "ready" [] state[p]="waiting" -> "requested" [] state[p]="acquired" -> "acquired" [] state[p]="in-cs" -> "in-cs"]Refinement == Mapping!SpecIn my CLH.cfg file, I added this line to check the refinement mapping:
PROPERTY RefinementNote again what we’re doing here for validation: we’re checking if our more detailed model faithfully implements the behavior of a simpler model (under a given mapping). Note that we’re using TLA+ to serve two different purposes.
To specify the high-level behavior that we consider correct (our behavioral contract)To model a specific algorithm (our implementation)Because TLA+ allows us to choose the granularity of our model, we can use it for both high-level specs of desired behavior and low-level specifications of an algorithm.
You can find my model at https://github.com/lorin/clh-tla
August 1, 2024
Reproducing a Java 21 virtual threads deadlock scenario with TLA+
Recently, some of my former colleagues wrote a blog post on the Netflix Tech Blog about a particularly challenging performance issue they ran into in production when using the new virtual threads feature of Java 21. Their post goes into a lot of detail on how they conducted their investigation and finally figured out what the issue was, and I highly recommend it. They also include a link to a simple Java program that reproduces the issue.
I thought it would be fun to see if I could model the system in enough detail in TLA+ to be able to reproduce the problem. Ultimately, this was a deadlock issue, and one of the things that TLA+ is good at is detecting deadlocks. While reproducing a known problem won’t find any new bugs, I still found the exercise useful because it helped me get a better understanding of the behavior of the technologies that are involved. There’s nothing like trying to model an existing system to teach you that you don’t actually understand the implementation details as well as you thought you did.
This problem only manifested when the following conditions were all present in the execution:
virtual threadsplatform threadsAll threads contending on a locksome virtual threads trying to acquire the lock when inside a synchronized blocksome virtual threads trying to acquire the lock when not inside a synchronized blockTo be able to model this, we need to understand some details about:
virtual threadssynchronized blocks and how they interact with virtual threadsJava lock behavior when there are multiple threads waiting for the lockVirtual threadsVirtual threads are very well-explained in JEP 444, and I don’t think I can really improve upon that description. I’ll provide just enough detail here so that my TLA+ model makes sense, but I recommend that you read the original source. (Side note: Ron Pressler, one of the authors of JEP 444, just so happens to be a TLA+ expert).
If you want to write a request-response style application that can handle multiple concurrent requests, then programming in a thread-per-request style is very appealing, because the style of programming is easy to reason about.
The problem with thread-per-request is that each individual thread consumes a non-trivial amount of system resources (most notably, dedicated memory for the call stack of each thread). If you have too many threads, then you can start to see performance issues. But in thread-per-request model, the number of concurrent requests your application service is capped by the number of threads. The number of threads your system can run can become the bottleneck.
You can avoid the thread bottleneck by writing in an asynchronous style instead of thread-per-request. However, async code is generally regarded as more difficult for programmers to write than thread-per-request.
Virtual threads are an attempt to keep the thread-per-request programming model while reducing the resource cost of individual threads, so that programs can run comfortably with many more threads.
The general approach of virtual threads is referred to as user-mode threads. Traditionally, threads in Java are wrappers around operating-system (OS) level threads, which means there is a 1:1 relationship between a thread from the Java programmer’s perspective and the operating system’s perspective. With user-mode threads, this is no longer true, which means that virtual threads are much “cheaper”: they consume fewer resources, so you can have many more of them. They still have the same API as OS level threads, which makes them easy to use by programmers who are familiar with threads.
However, you still need the OS level threads (which JEP 444 refers to as platform threads), as we’ll discuss in the next session.
How virtual threads actually run: carriersFor a virtual thread to execute, the scheduler needs to assign a platform thread to it. This platform thread is called the carrier thread, and JEP 444 uses the term mounting to refer to assigning a virtual thread to a carrier thread. The way you set up your Java application to use virtual threads is that you configure a pool of platform threads that will back your virtual threads. The scheduler will assign virtual threads to carrier threads to the pool.
A virtual thread may be assigned to different platform threads throughout the virtual thread’s lifetime: the scheduler is free to unmount a virtual thread from one platform thread and then later mount the virtual thread onto a different platform thread.
Importantly, a virtual thread needs to be mounted to a platform thread in order to run. If it isn’t mounted to a carrier thread, the virtual thread can’t run.
SynchronizedWhile virtual threads are new to Java, the synchronized statement has been in the language for a long time. From the Java docs:
A synchronized statement acquires a mutual-exclusion lock (§17.1) on behalf of the executing thread, executes a block, then releases the lock. While the executing thread owns the lock, no other thread may acquire the lock.
Here’s an example of a synchronized statement used by the Brave distributed tracing instrumentation library, which is referenced in the original post:
final class RealSpan extends Span { ... final PendingSpans pendingSpans; final MutableSpan state; @Override public void finish(long timestamp) { synchronized (state) { pendingSpans.finish(context, timestamp); } }In the example method above, the effect of the synchronized statement is to:
Acquire the lock associated with the state objectExecute the code inside of the blockRelease the lock(Note that in Java, every object is associated with a lock). This type of synchronization API is sometimes referred to as a monitor.
Synchronized blocks are relevant here because they interact with virtual threads, as described below.
Virtual threads, synchronized blocks, and pinningSynchronized blocks guarantee mutual exclusion: only one thread can execute inside of the synchronized block. In order to enforce this guarantee, the Java engineers made the decision that, when a virtual thread enters a synchronized block, it must be pinned to its carrier thread. This means that the scheduler is not permitted to unmount a virtual thread from a carrier as long as the virtual thread until the virtual thread exits the synchronized block.
ReentrantLock as FIFOThe last piece of the puzzle is related to the implementation details of a particular Java synchronization primitive: the ReentrantLock class. What’s important here is how this class behaves when there are multiple threads contending for the lock, and the thread that currently holds the lock releases it.
The ReentrantLock class delegates the acquire and release logic behavior to the AbstractQueuedSynchronizer class. As noted in the source code comments, this class is a variation of a type of lock called a CLH lock, which was developed independently by Travis Craig in his paper Building FIFO and Priority-Queueing Spin Locks from Atomic Swap, and by Erik Hagersten and Anders Landin in their paper Queue locks on cache coherent multiprocessors, where they refer to it as an LH lock. (Note that the Java implementation is not a spin lock).
The relevant implementation detail is that this lock is a FIFO: it maintains a queue with the identity of the threads that are waiting on the lock, ordered by arrival. As you can see in the code, after a thread releases a lock, the next thread in line gets notified that the lock is free.
Modeling in TLA+The sets of threadsI modeled the threads using three constant sets:
CONSTANTS VirtualThreads, CarrierThreads, FreePlatformThreadsVirtualThreads is the set of virtual threads that execute the application logic. CarrierThreads is the set of platform threads that will act as carriers for the virtual threads. To model the failure mode that was originally observed in the blog post, I also needed to have platform threads that will execute the application logic. I called these FreePlatformThreads, because these platform threads are never bound to virtual threads.
I called the threads that directly execute the application logic, whether virtual or (free) platform, “work threads”:
PlatformThreads == CarrierThreads \union FreePlatformThreadsWorkThreads == VirtualThreads \union FreePlatformThreadsHere’s a Venn diagram:
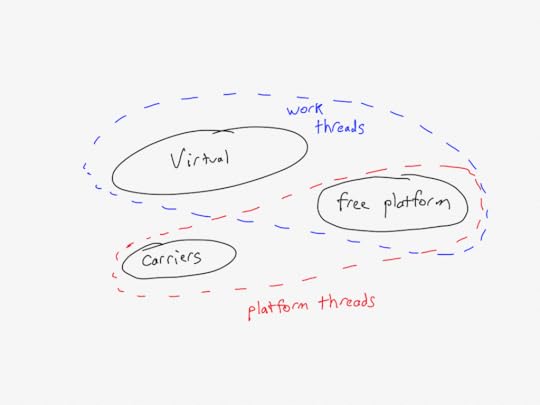 The state variables
My model has five variables:
VARIABLES pc, schedule, inSyncBlock, pinned, lockQueue TypeOk == /\ pc \in [WorkThreads -> {"ready", "to-enter-sync", "requested", "locked", "in-critical-section", "to-exit-sync", "done"}] /\ schedule \in [WorkThreads -> PlatformThreads \union {NULL}] /\ inSyncBlock \subseteq VirtualThreads /\ pinned \subseteq CarrierThreads /\ lockQueue \in Seq(WorkThreads)pc – program counter for each work thread schedule – function that describe how work threads are mounted to platform threadsinSyncBlock – the set of virtual threads that are currently inside a synchronized blockpinned – the set of carrier threads that are currently pinned to a virtual threadlockQueue – a queue of work threads that are currently waiting for the lockMy model only models a single lock, which I believe is this lock in the original scenario. Note that I don’t model the locks associated with the synchronization blocks, because there was no contention associated with those locks in the scenario I’m modeling: I’m only modeling synchronization for the pinning behavior.
Program countersEach worker thread can take one of two execution paths through the code. Here’s a simplified view of the two different code possible paths: the left code path is when a thread enters a synchronized block before it tries to acquire the lock, and the right code path is when a thread does not enter a synchronized block before it tries to acquire the lock.
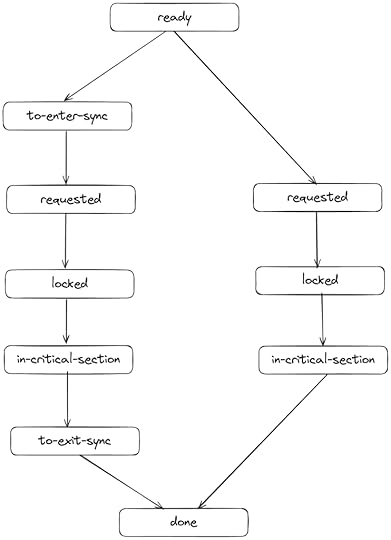
This is conceptually how my model works, but I modeled the left-hand path a little differently than this diagram. The program counters in my model actually transition back from “to-enter-sync” to “ready”, and they use a separate state variable (inSyncBlock) to determine whether to transition to the to-exit-sync state at the end. The other difference is that the program counters in my model also will jump directly from “ready” to “locked” if the lock is currently free. But showing those state transitions directly would make the above diagram harder to read.
The lockThe FIFO lock is modeled as a TLA+ sequence of work threads. Note that I don’t need to actually model whether the lock is held or not. My model just checks that the thread that wants to enter the critical section is at the head of the queue, and when it leaves the critical section, it gets removed from the head. The relevant actions look like this:
AcquireLock(thread) == /\ pc[thread] = "requested" /\ Head(lockQueue) = thread ...ReleaseLock(thread) == /\ pc[thread] = "in-critical-section" /\ lockQueue' = Tail(lockQueue) ...To check if a thread has the lock, I just check if it’s in a state that requires the lock:
\* A thread has the lock if it's in one of the pc that requires the lockHasTheLock(thread) == pc[thread] \in {"locked", "in-critical-section"}I also defined this invariant that I checked with TLC to ensure that only the thread at the head of the lock queue can be in any of these states.
HeadHasTheLock == \A t \in WorkThreads : HasTheLock(t) => t = Head(lockQueue)Pinning in synchronized blocksWhen a virtual thread enters a synchronized block, the corresponding carrier thread gets marked as pinned. When it leaves a synchronized block, it gets unmarked as pinned.
\* We only care about virtual threads entering synchronized blocksEnterSynchronizedBlock(virtual) == /\ pc[virtual] = "to-enter-sync" /\ pinned' = pinned \union {schedule[virtual]} ...ExitSynchronizedBlock(virtual) == /\ pc[virtual] = "to-exit-sync" /\ pinned' = pinned \ {schedule[virtual]}The schedulerMy model has an action named Mount that mounts a virtual thread to a carrier thread. In my model, this action can fire at any time, whereas in the actual implementation of virtual threads, I believe that thread scheduling only happens at blocking calls. Here’s what it looks like:
\* Mount a virtual thread to a carrier thread, bumping the other thread\* We can only do this when the carrier is not pinned, and when the virtual threads is not already pinned\* We need to unschedule the previous threadMount(virtual, carrier) == LET carrierInUse == \E t \in VirtualThreads : schedule[t] = carrier prev == CHOOSE t \in VirtualThreads : schedule[t] = carrier IN /\ carrier \notin pinned /\ \/ schedule[virtual] = NULL \/ schedule[virtual] \notin pinned \* If a virtual thread has the lock already, then don't pre-empt it. /\ carrierInUse => ~HasTheLock(prev) /\ schedule' = IF carrierInUse THEN [schedule EXCEPT ![virtual]=carrier, ![prev]=NULL] ELSE [schedule EXCEPT ![virtual]=carrier] /\ UNCHANGED <>My scheduler also won’t pre-empt a thread that is holding the lock. That’s because, in the original blog post, nobody was holding the lock during deadlock, and I wanted to reproduce that specific scenario. So, if a thread gets a lock, the scheduler won’t stop it from releasing the lock. And, yet, we can still get a deadlock!
Only executing while scheduledEvery action is only allowed to fire if the thread is scheduled. I implemented it like this:
IsScheduled(thread) == schedule[thread] # NULL\* Every action has this pattern:Action(thread) == /\ IsScheduled(thread) ....Finding the deadlockHere’s the config file I used to run a simulation. I had defined three virtual threads, two carrier threads, and one free platform threads.
INIT InitNEXT NextCONSTANTS NULL = NULL VirtualThreads = {V1, V2, V3} CarrierThreads = {C1, C2} FreePlatformThreads = {T1}CHECK_DEADLOCK TRUEINVARIANTS TypeOk MutualExclusion PlatformThreadsAreSelfScheduled VirtualThreadsCantShareCarriers HeadHasTheLockAnd, indeed, the model checker finds a deadlock! Here’s what the trace looks like in the Visual Studio Code plugin.
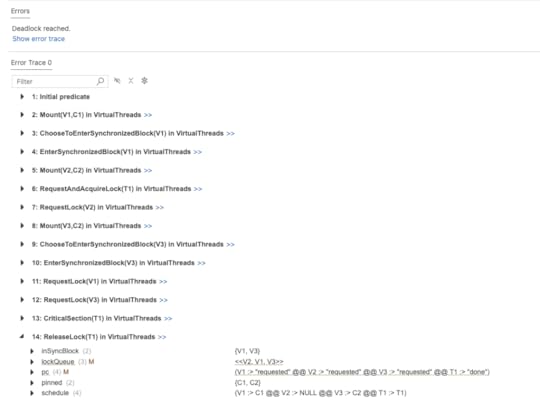
Note how virtual thread V2 is in the “requested” state according to its program counter, and V2 is at the head of the lockQueue, which means that it is able to take the lock, but the schedule shows “V2 :> NULL”, which means that the thread is not scheduled to run on any carrier threads.
And we can see in the “pinned” set that all of the carrier threads {C1,C2} are pinned. We also see that the threads V1 and V3 are behind V2 in the lock queue. They’re blocked waiting for the lock, and they’re holding on to the carrier threads, so V2 will never get a chance to execute.
There’s our deadlock!
You can find my complete model on GitHub at: https://github.com/lorin/virtual-threads-tla/
July 27, 2024
Incidents as keys to a lot of value
One of the workhorses of the modern software world is the key-value store. there are key-value services such as Redis or Dynamo, and some languages build key-value data structures right in to the language (examples include Go, Python and Clojure). Even relational databases, which are not themselves key-value stores, are frequently built on top of a data structure that exposes a key-value interface.
Key-value data structures are often referred to as maps or dictionaries, but here I want to call attention to the less-frequently-used term associative array. This term evokes the associative nature of the store: the value that we store is associated with the key.
When I work on an incident writeup, I try to capture details and links to the various artifacts that the incident responders used in order to diagnose and mitigate the incident. Examples of such details include:
dashboards (with screenshots that illustrate the problem and links to the dashboard)names of feature flags that were used or considered for remediationrelevant Slack channels where there was coordination (other than the incident channel)Why bother with these details? I see it as a strategy to tackle the problem that Woods and Cook refer to in Perspectives on Human Error: Hindsight Biases and Local Rationality as the problem of inert knowledge. There may be information about that we learned at some point, but we can’t bring it to bear when an incident is happening. However, we humans are good at remembering other incidents! And so, my hope is that when an operational surprise happens, someone will remember “Oh yeah, I remember reading about something like this when incident XYZ happened”, and then they can go look up the incident writeup to incident XYZ and see the details that they need to help them respond.
In other words, the previous incidents act as keys, and the content of the incident write-ups act as the value. If you make the incident write-ups memorable, then people may just remember enough about them to look up the write-ups and page in details about the relevant tools right when they need them.
Second-class interactions are a first-class risk
Below is a screenshot of Vizceral, a tool that was built by a former teammate of mine at Netflix. It provides a visualization of the interactions between the various microservices.
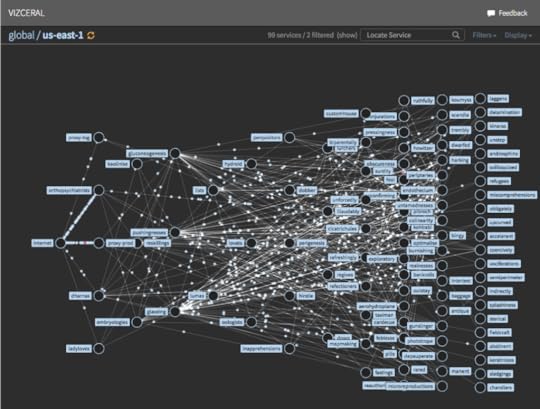
Vizceral uses moving dots to depict how requests are currently flowing through the Netflix microservice architecture. Vizceral is able to do its thing because of the platform tooling, which provides support for generating a visualization like this by exporting a standard set of inter-process communication (IPC) metrics.
What you don’t see depicted here are the interactions between those microservices and the telemetry platform that ingest these metrics. There’s also logging and tracing data, and those get shipped off-box via different channels, but none of those channels show up in this diagram.
In fact, this visualization doesn’t represent interactions with any of the platform services. You won’t see bubbles that represent the compute platform or the CI/CD platform represented in a diagram like this, even though those platform services all interact with these application services in important ways.
I call the first category of interactions, the ones between the application services, as first-class, and the second category, the ones where the interactions involve platform services, as second-class. It’s those second-class interactions that I want to say more about.
These second-class interactions tend to have a large blast radius, because successful platforms by their nature have a large blast radius. There’s a reason why there’s so much havoc out in the world when AWS’s us-east-1 region has a problem: because so many services out there are using us-east-1 as a platform. Similarly, if you have a successful platform within your organization, then by definition it’s going to see a lot of use, which means that if it experiences a problem, it can do a lot of damage.
These platforms are generally more reliable than the applications that run atop them, because they have to be: platforms naturally have higher reliability requirements than the applications that run atop them. They have these requirements because they have a large blast radius. A flaky platform is a platform that contributes to multiple high-severity outages, and systems that contribute to multiple high-severity outages are the systems were reliability work gets prioritized.
And a reliable system is a system whose details you aren’t aware of, because you don’t need to be. If my car is very reliable, then I’m not going to build an accurate mental model of how my car works, because I don’t need to: it just works. In her book Human-Machine Reconfigurations: Plans and Situated Actions, the anthropologist Lucy Suchman used the term representation to describe the activity of explicitly constructing a mental model of how a piece of technology works, and she noted that this type of cognitive work only happens when we run into trouble. As Suchman puts it:
[R]epresentation occurs when otherwise transparent activity becomes in some way problematic
Hence the irony: these second-class interactions tend not to be represented in our system models when we talk about reliability, because they are generally not problematic.
And so we are lulled into a false sense of security. We don’t think about how the plumbing works, because the plumbing just works. Until the plumbing breaks. And then we’re in big trouble.
July 24, 2024
Expect it most when you expect it least
 Homer Simpson: philosopher
Yesterday, CrowdStrike released a Preliminary Post-Incident Review of the major outage that happened last week. I’m going to wait until the full post-incident review is released before I do any significant commentary, and I expect we’ll have to wait at least a month for that. But I did want to highlight one section of the doc from the section titled What Happened on July 19, 2024, emphasis mine
On July 19, 2024, two additional IPC Template Instances were deployed. Due to a bug in the Content Validator, one of the two Template Instances passed validation despite containing problematic content data.
Based on the testing performed before the initial deployment of the Template Type (on March 05, 2024), trust in the checks performed in the Content Validator, and previous successful IPC Template Instance deployments, these instances were deployed into production.
And now, let’s reach way back into the distant past of three weeks ago, when the The Canadian Radio-television and Telecommunications Commission (CRTC) posted an executive summary of a major outage, which I blogged about at the time. Here’s the part I want to call attention to, once again, emphasis mine.
Rogers had initially assessed the risk of this seven-phased process as “High.” However, as changes in prior phases were completed successfully, the risk assessment algorithm downgraded the risk level for the sixth phase of the configuration change to “Low” risk, including the change that caused the July 2022 outage.
In both cases, the engineers had built up confidence over time that the types of production changes they were making were low risk.
When we’re doing something new with a technology, we tend to be much more careful with it, it’s riskier, we’re shaking things out. But, over time, after there haven’t been any issues, we start to gain more trust in the tech, confident that it’s a reliable technology. Our internal perception of the risk adjusts based on our experience, and we come to believe that the risks of these sorts of changes are low. Any organization who concentrates their reliability efforts on action items in the wake of an incident, rather than focusing on the normal work that doesn’t result in incidents, is implicit making this type of claim. The squeaky incident gets the reliability grease. And, indeed, it’s rational to allocate your reliability effort based on your perception of risk. Any change can break us, but we can’t treat every change the same. How could it be otherwise?
The challenge for us is that large incidents are not always preceded by smaller ones, which means that there may be risks in your system that haven’t manifested as minor outages. I think these types of risks are the most dangerous ones of all, precisely because they’re much harder for the organization to see. How are you going to prioritize doing the availability work for a problem that hasn’t bitten you yet, when your smaller incidents demonstrate that you have been bitten by so many other problems?
This means that someone has to hunt for weak signals of risk and advocate for doing the kind of reliability work where there isn’t a pattern of incidents you can point to as justification. The big ones often don’t look like the small ones, and sometimes the only signal you get in advance is a still, small sound.
July 23, 2024
A still, small sound
One of the benefits of having attended a religious elementary school (despite being a fairly secular one as religious schools go) is exposure to the text of the Bible. There are two verses from the first book of Kings that have always stuck with me. They are from I Kings 19:11–13, where God is speaking to the prophet Elijah. I’ve taken the text below from the English translation that was done by A.J. Rosenberg:
And He said: Go out and stand in the mountain before the Lord, behold!
The Lord passes, and a great and strong wind splitting mountains and shattering boulders before the Lord, but the Lord was not in the wind.
And after the wind an earthquake-not in the earthquake was the Lord.
After the earthquake fire, not in the fire was the Lord,
and after the fire a still small sound.
I was thinking of these passages when listening to an episode of Todd Conklin’s Pre-accident Investigation podcast, with the episode title Safety Moment – Embracing the Yellow: Rethinking Safety Indicators.
It’s in the aftermath of the big incidents where most of the attention is focused when it comes to investing in reliability: the great and strong winds, the earthquakes, the fires. But I think it’s the subtler signals, what Conklin refers to as the yellow (as opposed to the glaring signals of the red or the absence of signal of the green) that are the ones that communicate to us about the risk of the major outage that has not happened yet.
It’s these still small sounds we need to able to hear in order to see the risks that could eventually lead to catastrophe. But to hear these sounds, we need to listen for them.
July 7, 2024
Book review: How Life Works

In the 1980s, the anthropologist Lucy Suchman studied how office workers interacted with sophisticated photocopiers. What she found was that people’s actions were not determined by predefined plans. Instead, people decided what act to take based on the details of the particular situation they found themselves in. They used predefined plans as resources for helping them choose which action to take, rather than as a set of instructions to follow.
I couldn’t help thinking of Suchman when reading How Life Works. In it, the British science writer Philip Ball presents a new view of the role of DNA, genes, and the cell in the field of biology. Just as Suchman argued that people use plans as resources rather than explicit instructions, Ball discusses how the cell uses DNA as resources. Our genetic code is a toolbox, not a blueprint.
Imagine you’re on a software team that owns a service, and an academic researcher who is interested in software but doesn’t really know anything about it comes to and asks, “What function does redis play in your service? What would happen if it got knocked out?”. This is a reasonable question, and you explain the role that redis plays in improving performance through caching. And then he asks another question: “What function does your IDE’s debugger play in your service?” He notices the confused look on your face and tries to clarify the question by asking, “Imagine another team had to build the same service, but they didn’t have the IDE debugger? How would the behavior of the service be different? Which functions would be impaired” And you try to explain that you don’t actually know how it would be different. That the debugger, unlike redis, is a tool, which is sometimes used to help diagnose problems. But there are multiple ways to debug (for example, using log statements). It might not make any difference at all if that new team doesn’t happen to use the debugger. There’s no direct mapping of the debugger’s presence to the service’s functionality: the debugger doesn’t play a functional role in the service the way that redis does. In fact, the next team that builds a service might not end up needing to use the debugger at all, so removing it might have no observable effect on the next service.
The old view sees these DNA segments like redis, having an explicit functional role, and the new view sees them more like a debugger, as tools to support the cell in performing functions. As Ball puts it, “The old view of genes as distinct segments of DNA strung along the chromosomes like beads, interspersed with junk, and each controlling some aspect of phenotype, was basically a kind of genetic phrenology.” The research has shown that the story is more complex than that, and that there is no simple mapping between DNA segments in our chromosomes and observed traits, or phenotypes. Instead, these DNA segments are yet another input in a complex web of dynamic, interacting components. Instead of focusing on these DNA strands of our genome, Ball directs our attention on the cell as a more useful unit of analysis. A genome, he points out, is not capable of constructing a cell. Rather, a cell is always the context that must exist for the genome to be able to do anything.
The problem space that evolution works in is very different from the one that human engineers deal with, and, consequently, the solution space can appear quite alien to us. The watch has long been a metaphor for biological organisms (for example, Dawkins’s book “The Blind Watchmaker”), but biological systems are not like watches with their well-machined gears. The micro-world of the cell contains machinery at the scale of molecules, which is a very noisy place. Because biological systems must be energy efficient, they function close to the limits of thermal noise. That requires a very different types of machines than the ones we interact with at our human scales. Biology can’t use specialized parts with high tolerances, but must instead make do with more generic parts that can be used to solve many different kinds of problems. And because the cells can use the same parts of the genome to solve different problems, asking questions like “what does that protein do” becomes much harder to answer: the function of a protein depends on the context in which the cell uses it, and the cell can use it in multiple contexts. Proteins are not like keys designed to fit specifically into unique locks, but bind promiscuously to different sites.
This book takes a very systems-thinking approach, as opposed to a mechanistic one, and consequently I find it very appealing. This is a complex, messy world of signaling networks, where behavior emerges from the interaction of genome and environment. There are many connections here to the field of resilience engineering, which has long viewed biology as a model (for example, see Richard Cook’s talk on the resilience of bone). In this model, the genome acts as a set of resources which the cell can leverage to adapt to different challenges. The genome is an example, possible the paradigmatic example, of adaptive capacity. Or, as the biologists Michael Levin and Rafael Yuste put it, whom Ball quotes: “Evolution, it seems, doesn’t come up with answers so much as generate flexible problem-solving agents that can rise to new challenges and figure things out on their own.”


