
Nate Silver's Blog, page 89
March 15, 2018
What’s The Right Way To Interpret The Pennsylvania Special Election?
Welcome to FiveThirtyEight’s weekly politics chat. The transcript below has been lightly edited.
micah (Micah Cohen, politics editor): HEYO! When this chat publishes, we’ll be about 36 hours removed from the special election in Pennsylvania’s 18th Congressional District (apparently won by Democrat Conor Lamb). That’s been more than enough time for narratives and lessons and takeaways to take hold. I’ve chosen what seem to be the most ubiquitous or interesting ones, and we’re going to play a game of buy/sell/hold with PA 18 


March 14, 2018
The GOP Should Be Freaking Out, Pennsylvania Edition
More: Apple Podcasts |
ESPN App |
RSS
| Embed
Embed Code
Democrat Conor Lamb appears to be the winner of Tuesday’s special U.S. House election in a district that voted for President Trump by 20 percentage points. The FiveThirtyEight Politics podcast team discusses what the results in Pennsylvania’s 18th District mean for Republicans in the 2018 midterms. Spoiler: Not great, Bob!
You can listen to the episode by clicking the “play” button above or by downloading it in iTunes , the ESPN App or your favorite podcast platform. If you are new to podcasts, learn how to listen .
The FiveThirtyEight Politics podcast publishes Monday evenings, with occasional special episodes throughout the week. Help new listeners discover the show by leaving us a rating and review on iTunes . Have a comment, question or suggestion for “good polling vs. bad polling”? Get in touch by email, on Twitter or in the comments.
The ‘Enthusiasm Gap’ Could Turn A Democratic Wave Into A Tsunami
It’s a busy time of year, so we’ll keep this relatively short. But I wanted to echo and underscore a point made by FiveThirtyEight contributor Nathaniel Rakich in his article on Tuesday’s special election in Pennsylvania’s 18th Congressional District. One reason that the results are especially scary for Republicans — Democrat Conor Lamb is the apparent winner1 in a district that President Trump won by 20 percentage points — is because it came on reasonably high turnout, the sort of turnout one might expect in this year’s midterms.
As of early Wednesday morning, about 228,000 votes had been counted in the special election. That equals 62 percent of the 370,000 votes cast for the presidential candidates in the district in November 2016, according to data from Daily Kos Elections. That’s right in line with midterm turnout, which is typically 60 percent to 70 percent as high as turnout in presidential years.
Turnout was similarly high in December’s special Senate election in Alabama — 64 percent of presidential-year turnout in the state. That was also an impressive win for Democrats, albeit one with more mitigating circumstances.
The high-turnout wins in Pennsylvania and Alabama ought to reassure Democrats — and worry Republicans — because there had previously seemed to be a pattern in which Democratic results were most impressive in low-turnout special elections. For instance, Democrat Archie Parnell surprisingly came within 3 percentage points of defeating Republican Ralph Norman in the special election in South Carolina’s 5th Congressional District, which represented a 16-point blue swing relative to the district’s partisan lean.2 But that result came on minuscule turnout — only about 88,000 votes, or 29 percent of the district’s 2016 presidential turnout. By contrast, Democrat Jon Ossoff’s underwhelming performance in the Georgia 6 runoff that same evening — which represented only a 6-point Democratic swing from the district’s partisan baseline — had come on exceptionally high turnout, equalling 79 percent of the district’s presidential vote.
After nine federal special elections that pitted the two parties against one another, however — including both the open primary3 and the runoff in Georgia 6 — there’s no overall pattern between turnout levels and how Democrats perform:4
Democrats are performing strongly in both high-turnout and low-turnout special elections
Since the 2016 presidential election
Special Elections
2016 pres. vote count
Vote count
as SHARE of pres. votes
Dem. Swing
Georgia 6th runoff
331,246
260,316
79%
6
Montana At-Large
501,822
381,416
76
16
Alabama U.S. Senate
2,123,372
1,348,720
64
31
Pennsylvania 18th
370,497
228,378
62
22
Georgia 6th open primary*
331,246
192,569
58
7
Utah 3rd
289,923
147,741
51
3
Kansas 4th
274,547
122,594
45
23
South Carolina 5th
306,200
88,316
29
16
California 34th open primary*
184,601
42,308
23
18
Democratic swing is the difference between the special election result and the district’s partisan lean. Partisan lean is the average difference between how the constituency voted and how the country voted overall in the last two presidential elections, with 2016 weighted 75 percent and 2012 weighted 25 percent.
* Primary potentially included multiple candidates from each party, and results show vote share for all candidates from each party combined.
Sources: State websites, Daily Kos, New York Times, dave leip’s atlas of U.S. presidential Elections
Thus, Republicans have one less excuse for their string of really awful special election performances. It’s true that other measures aren’t as bad for Republicans as these special elections — for instance, they trail Democrats by “only” 8 or 9 percentage points on the generic congressional ballot, which suggests a close race for control of the House this year that only narrowly favors Democrats. By contrast, the 16- or 17-point5 average Democratic overperformance in special elections so far suggests a Democratic mega-tsunami.
But those special election results consist of actual people voting, whereas generic ballot polls are mostly conducted among registered voters — or sometimes all adults. (Very few pollsters will apply their likely voter models until later this year.) In midterm years, polls of likely voters sometimes show a substantial gap from those of registered voters — there was about a 6-point enthusiasm gap favoring Republicans in 2010, for instance, which took that year from being mildly problematic for Democrats into a massive Republican wave that saw them pick up 63 House seats.
Related:
And there were signs of an enthusiasm gap even within Pennsylvania 18 on Tuesday night. According to the Cook Political Report’s David Wasserman, turnout in Democratic-leaning Allegheny County equaled 67 percent of presidential-year turnout, but voters turned out at only 60 percent of presidential levels in Republican-leaning Westmoreland County. That sort of turnout gap suggests that registered-voter polls could be underrating Democrats in this year’s midterms — and could turn a challenging year for Republicans into a catastrophic one.
March 13, 2018
Emergency Politics Podcast: Tillerson’s Out. What Now?
More: Apple Podcasts |
ESPN App |
RSS
| Embed
Embed Code
With Rex Tillerson out at the State Department and CIA Director Mike Pompeo in line to replace him, President Trump’s Cabinet is undergoing its fifth major change. The FiveThirtyEight Politics podcast team reacts to Trump’s historic turnover levels, debates what the departure means and discusses what comes next.
You can listen to the episode by clicking the “play” button above or by downloading it in iTunes , the ESPN App or your favorite podcast platform. If you are new to podcasts, learn how to listen .
The FiveThirtyEight Politics podcast publishes Monday evenings, with occasional special episodes throughout the week. Help new listeners discover the show by leaving us a rating and review on iTunes . Have a comment, question or suggestion for “good polling vs. bad polling”? Get in touch by email, on Twitter or in the comments.
March 12, 2018
Politics Podcast: The Most Special Special Election Yet
More: Apple Podcasts |
ESPN App |
RSS
| Embed
Embed Code
The special election on Tuesday in Pennsylvania’s 18th Congressional District, in the western part of the state, will put Republicans to the test in a part of the country that President Trump has made central to his message. The FiveThirtyEight Politics podcast crew discusses the candidates, expectations and political environment in what looks to be a close race. The team also debates the political implications of the “Trump economy” after a positive jobs report, increased popular support for the GOP tax law and the administration’s move to levy tariffs on steel and aluminum.
You can listen to the episode by clicking the “play” button above or by downloading it in iTunes , the ESPN App or your favorite podcast platform. If you are new to podcasts, learn how to listen .
The FiveThirtyEight Politics podcast publishes Monday evenings, with occasional special episodes throughout the week. Help new listeners discover the show by leaving us a rating and review on iTunes . Have a comment, question or suggestion for “good polling vs. bad polling”? Get in touch by email, on Twitter or in the comments.
March 11, 2018
2018 March Madness Predictions
2018 March Madness PredictionsIn-game win probabilities and chances of advancing, updating live. | ESPN coverageMenWomenMarch 14 (Play-in)March 15 (Play-in)March 16 (1st Round)March 17 (1st Round)March 18 (2nd Round)March 19 (2nd Round)March 23 (Sweet 16)March 24 (Sweet 16)March 25 (Elite Eight)March 26 (Elite Eight)April 1 (Final Four)April 3 (Championship)
6:40 pm EDT | truTV
SCORE
WIN PROB
‘
M. St. Mary’s16
—
56%
‘
New Orleans16
—
44%
9:10 pm EDT | truTV
SCORE
WIN PROB
‘
Wake Forest11
—
52%
‘
Kansas State11
—
48%
Round-by-round probabilitiesBracketTableHover to see each team’s path to the championship.EASTMIDWESTWESTSOUTH1ST ROUND1ST ROUND2ND ROUND2ND ROUNDSWEET 16SWEET 16ELITE EIGHTELITE EIGHTFINAL FOURFINAL FOURCHAMPIONSHIPNew Orleans 16M. St. Mary’s 1656%Kansas State 11Wake Forest 1152%NC Central 16UC-Davis 1663%Providence 11USC 1158%17%CHANCE OFWINNINGTOURNAMENT21%38%56%Kansas 1NCCU/UCD 16Miami 8Michigan St. 9Iowa State 5Nevada 12Purdue 4Vermont 13Creighton 6Rhode Island 11Oregon 3Iona 14Michigan 7Okla. State 10Louisville 2Jax. State 1530%UNC 1TXSO 16Arkansas 8Seton Hall 9Minnesota 5Mid. Tenn. 12Butler 4Winthrop 1347%Cincinnati 6KSU/WAKE 11UCLA 3Kent St. 1468%Dayton 7Wichita St. 1097%Kentucky 2N. Kentucky 1527%46%63%1 Villanova16 UNO/MSM8 Wisconsin9 Virginia Tech5 Virginia12 UNC-Wilm.4 Florida13 E. Tenn. St.6 SMU11 PROV/USC3 Baylor14 NM State7 S. Carolina10 Marquette2 Duke15 Troy41%60%1 Gonzaga16 S. Dakota St.8 N’western9 Vanderbilt5 Notre Dame12 Princeton4 W. Virginia13 Bucknell6 Maryland11 Xavier3 Florida State14 FGCU7 St. Mary’s10 VCU2 Arizona15 N. DakotaForecastCurrentPre-tournamentMarch 14 (Play-in)March 15 (Play-in)March 16 (1st Round)March 17 (1st Round)March 18 (2nd Round)March 19 (2nd Round)March 23 (Sweet 16)March 24 (Sweet 16)March 25 (Elite Eight)March 26 (Elite Eight)April 1 (Final Four)
Originally published March 11. Download forecast data.
By Jay Boice and Nate Silver
COMMENTS
Get more FiveThirtyEight
Newsletter
Videos
Podcasts
GitHub
RSS
Contact
Jobs
Masthead
Privacy and Terms of Service
About Nielsen Measurement
How Our March Madness Predictions Work
Editor’s note: This article is adapted from articles about how our March Madness predictions work.
We’ve been issuing probabilistic March Madness forecasts in some form since 2011, when FiveThirtyEight was just a couple of people writing for The New York Times. Initially, we focused on the men’s NCAA Tournament, publishing a table that gave each team’s probability of advancing deep (or not-so-deep) into the tournament. Over the years, we expanded to forecasting the women’s tournament as well. And since 2016, our forecasts have updated live, as games are played. Below are the details on each step that we take — including calculating power ratings for teams, win probabilities for each game and the chance that each remaining team will make it to any given stage of the bracket.
March Madness Predictions:
FiveThirtyEight’s men’s and women’s NCAA Tournament forecasting models calculate the chance of each team reaching each round. See our predictions for 2018 »
Men’s team ratings
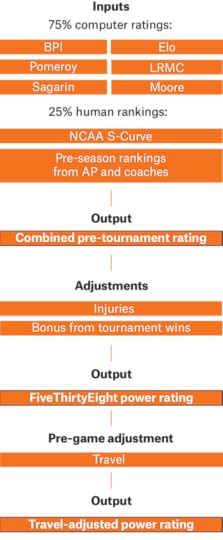
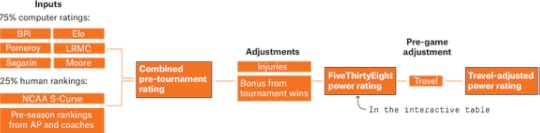
Our men’s model is principally based on a composite of six computer power ratings:
Ken Pomeroy’s ratings
Jeff Sagarin’s “predictor” ratings
Sonny Moore’s ratings
Joel Sokol’s LRMC ratings
ESPN’s Basketball Power Index
FiveThirtyEight’s Elo ratings (described below)
Each of these ratings has a strong track record in picking tournament games. We shouldn’t make too much of the differences among them: They are all based on the same basic information — wins and losses, strength of schedule, margin of victory — computed in slightly different ways. We use six systems instead of one, however, because each system has different features and bugs, and blending them helps to smooth out any rough edges. (Those rough edges matter because even small differences can compound over the course of a single-elimination tournament that requires six or seven games to win.)
To produce a pre-tournament rating for each team, we combine those computer ratings with a couple of human rankings:
The NCAA selection committee’s 68-team “S-curve”
Preseason rankings from The Associated Press and the coaches
These rankings have some predictive power — if used in moderation. They make up one-fourth of the rating for each team; the computer systems are three-fourths.
It’s not a typo, by the way, to say that we look at preseason rankings. The reason is that a 30- to 35-game regular season isn’t all that large a sample. Preseason rankings provide some estimate of each team’s underlying player and coaching talent. It’s a subjective estimate, but it nevertheless adds some value, based on our research. If a team wasn’t ranked in either the Associated Press or Coaches polls, we estimate its strength using the previous season’s final Sagarin rating, reverted to the mean.
To arrive at our FiveThirtyEight power ratings, which are a measure of teams’ current strength on a neutral court and are displayed on our March Madness predictions interactive graphic, we make two adjustments to our pre-tournament ratings.
The first is for injuries and player suspensions. We review injury reports and deduct points from teams that have key players out of the lineup. (This process might sound arbitrary, but it isn’t: The adjustment is based on Sports-Reference.com’s Win Shares, which estimates the contribution of each player to his team’s record while also adjusting for a team’s strength of schedule. So our program won’t assume a player was a monster just because he was scoring 20 points a game against the likes of Abilene Christian and Austin Peay. The injury adjustment also works in reverse: We review each team to see which are healthier going into the tournament than they were during the regular season.
The second adjustment takes place only once the tournament is underway. The FiveThirtyEight model gives a bonus to teams’ ratings as they win games, based on the score of each game and the quality of their opponent. A No. 12 seed that waltzes through its play-in game and then crushes a No. 5 seed may be much more dangerous than it initially appeared; our model accounts for this. On the flip side, a highly rated team that wins but looks wobbly against a lower seed often struggles in the next round, we’ve found.
When we forecast individual games, we apply a third and final adjustment to our ratings, for travel distance. Are you not at your best when you fly in from LAX to take an 8 a.m. meeting in Boston? The same is true of college basketball players. In extreme cases (a team playing very near its campus or traveling across the country to play a game), the effect of travel can be tantamount to playing a home or road game, despite being on an ostensibly neutral court. This final adjustment gives us a team’s travel-adjusted power rating, which is then used to calculate their chance of winning that game.
Women’s team ratings

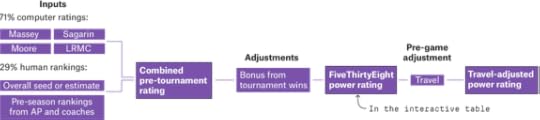
We calculate power ratings for the women’s tournament in much the same way as we do for the men’s. However, because of the relative lack of data for women’s college basketball — a persistent problem when it comes to women’s sports — the process has a few differences:
Three of the six power ratings that we use for the men’s tournament aren’t available for women. Fortunately, that means three of them are: Sagarin’s “predictor” ratings, Sokol’s LRMC ratings and Moore’s ratings. We also use a fourth system, the Massey Ratings.
The NCAA doesn’t publish the 68-team S-curve data for the women. So we use the teams’ seeds instead, with the exception of the four No. 1 seeds, which the selection committee does list in order.
For the women’s tournament, there isn’t much in the way of injury reports or advanced individual statistics, so we don’t include injury adjustments.
Turning power ratings into a forecast
Once we have power ratings for every team, we need to turn them into a forecast — that is, the chance of every team reaching any round of the tournament.
Most of our sports forecasts rely on Monte Carlo simulations, but March Madness is different; because the structure of the tournament is a single-elimination bracket, we’re able to directly calculate the chance of teams advancing to a given round.
We calculate the chance of any team beating another with the following Elo-derived formula, which is based on the difference between the two teams’ travel-adjusted power ratings:
\(\Large \frac{1.0}{1.0+10^{-travel\_adjusted\_power\_rating\_diff*30.464/400}}\)
Because a team needs to win only a single game to advance, this formula gives us the chance of a team reaching the next round in the bracket. The probability of a team reaching a future round in the bracket is based on a system of conditional probabilities. In other words, the chance of a team reaching a given round is the chance they reach the previous round, multiplied by their chance of beating any possible opponent in the previous round, weighted by their likelihood of meeting each of those opponents.
Live win probabilities
While games are being played, our interactive graphic displays a box for each one that shows updating win probabilities for both teams, as well as the score and the time remaining. These probabilities are derived using logistic regression analysis, which lets us plug the current state of a game into a model to produce the probability that either team will win the game. Specifically, we used play-by-play data from the past five seasons of Division I NCAA basketball to fit a model that incorporates:
Time remaining in the game
Score difference
Pregame win probabilities
Which team has possession, with a special adjustment if the team is shooting free throws
The model doesn’t account for everything, however. If a key player has fouled out of a game, for example, the model doesn’t know, and his or her team’s win probability is probably a bit lower than what we have listed. There are also a few places where the model experiences momentary uncertainty: In the handful of seconds between the moment when a player is fouled and the free throws that follow, for example, we use the team’s average free-throw percentage to adjust its win probability. Still, these probabilities ought to do a reasonably good job of showing which games are competitive and which are essentially over.
Also displayed in the box for each game is our “excitement index” (check out the lower-right corner) — that number also updates throughout a game and can give you a sense of when it’ll be most fun to tune in. Loosely based on Brian Burke’s NFL work, the index is a measure of how much each team’s chances of winning have changed over the course of the game.
The calculation behind this feature is the average change in win probability per basket scored, weighted by the amount of time remaining in the game. This means that a basket made late in the game has more influence on a game’s excitement index than a basket made near the start of the game. We give additional weight to changes in win probability in overtime. Values range from 0 to 10, although they can exceed 10 in extreme cases.
FiveThirtyEight’s Elo ratings
If you’ve been a FiveThirtyEight reader for really any length of time, you probably know that we’re big fans of Elo ratings. We’ve introduced versions for the NBA and the NFL, among other sports. Using game data from ESPN, Sports-Reference.com and other sources, we’ve also calculated Elo ratings for men’s college basketball teams dating back to the 1950s. Our Elo ratings are one of the six computer rating systems used in each team’s pre-tournament rating.
Our methodology for calculating these Elo ratings is very similar to the one we use for the NBA. Elo is a measure of a team’s strength that is based on game-by-game results. The information that Elo relies on to adjust a team’s rating after every game is relatively simple — including the final score and the location of the game. (As we noted earlier, college basketball teams perform significantly worse when they travel a long distance to play a game.)
It also takes into account whether the game was played in the NCAA Tournament. We’ve found that historically, there are actually fewer upsets in the tournament than you’d expect from the difference in teams’ Elo ratings, perhaps because the games are played under better and fairer conditions in the tournament than in the regular season. Our Elo ratings account for this and weight tournament games slightly higher than regular-season ones.
Because Elo is a running assessment of a team’s talent, at the beginning of each season, a team gets to keep its rating from the end of the previous one, except that we also revert it to the mean. The wrinkle here, compared with our NFL Elo ratings, is that we revert college basketball team ratings to the mean of the conference.
And that’s about it! (Congratulations if you made it this far.) While we make no guarantee that you’ll win your pool if you use our system, we think it’s done a pretty job over the years. Hopefully, you’ll have fun using it to make your picks, and it will add to your enjoyment of both NCAA tournaments.
March 7, 2018
Why Do Americans Hate The Media?
Welcome to FiveThirtyEight’s weekly politics chat. The transcript below has been lightly edited.
micah (Micah Cohen, politics editor): Our question for today: Why do Americans hate/distrust the press so much?
I’m thinking we’ll break this down into three parts:
Who hates what? What do we know about which groups of Americans distrust which media outlets/types? How has that changed?
Why? What do we know about what’s causing trust to sink?
The Trump factor. How does coverage of the Trump administration — in particular, the Russia investigation — fit into all of this?
Does that work for everyone? Everyone ready?
natesilver (Nate Silver, editor in chief): Here. But … on a plane!
micah: Do it, Clare!
clare.malone (Clare Malone, senior political writer): Nate’s on a plaaaannnnne!!
micah: lol. That’ll never not be funny.
OK, first up: Who hates what?
Let’s start broad and then get as specific as we can.
clare.malone: Well, Micah, Americans in general have not loved the press for decades and decades! According to Gallup, the most trust we had in newspapers was in 1979, when 51 percent of Americans said they had a “great deal” or “quite a lot” of confidence in newspapers. Downhill since then!
I wrote about it in this story from 2016, post-election. Only 20 percent of Americans trusted newspapers in 2016. Yoikes.
natesilver: Republicans hate the media a lot, and Democrats hate the media a little.
perry (Perry Bacon Jr., senior writer): According to a December 2017 Poynter report:
The survey found that 74% of respondents who identify as Democrats, or who lean Democratic, have “a great deal” (19%) or “a fair amount” (55%) of confidence in the media. A poll taken in September 2016 asked the same question and found that 51% of Democrats expressed the same level of support, meaning that their confidence has increased 23 percentage points in just one year.
Seventy-four percent confidence in the press is the highest level registered for Democrats since 1997, the earliest date for which similar data is available.
Meanwhile, the numbers among Republicans are declining.
micah: Holy moly, look at President Trump’s effect:

clare.malone: Anyhow. Yes, Republicans trust the media less. And it started well before this election cycle. A couple of people I’ve talked to about this — Republicans, expert and non — have cited the misreporting about George W. Bush’s military service as one of the first times they can remember an inflection point, a feeling that the media was partisan.
So this is a theme that goes back a ways.
micah: But Democrats gaining trust is new, right? And seems Trump-related? The enemy of my enemy, I guess.
clare.malone: I mean, I’m old enough to remember when Democratic primary voters — in particular, Bernie Sanders supporters — were berating the media about coverage during the 2016 election.
micah: That was then, Clare. Now we have President Trump.
natesilver: Yeah. It’s all about Trump, and saying you like the media is a way to say you’re not on Team Trump.
clare.malone: Indeed. Just wanted to cite this, so that readers know that this elephant never forgets.

Why Does Everyone Hate The Media?
Welcome to FiveThirtyEight’s weekly politics chat. The transcript below has been lightly edited.
micah (Micah Cohen, politics editor): Our question for today: Why do Americans hate/distrust the press so much?
I’m thinking we’ll break this down into three parts:
Who hates what? What do we know about which groups of Americans distrust which media outlets/types? How has that changed?
Why? What do we know about what’s causing trust to sink?
The Trump factor. How does coverage of the Trump administration — in particular, the Russia investigation — fit into all of this?
Does that work for everyone? Everyone ready?
natesilver (Nate Silver, editor in chief): Here. But … on a plane!
micah: Do it, Clare!
clare.malone (Clare Malone, senior political writer): Nate’s on a plaaaannnnne!!
micah: lol. That’ll never not be funny.
OK, first up: Who hates what?
Let’s start broad and then get as specific as we can.
clare.malone: Well, Micah, Americans in general have not loved the press for decades and decades! According to Gallup, the most trust we had in newspapers was in 1979, when 51 percent of Americans said they had a “great deal” or “quite a lot” of confidence in newspapers. Downhill since then!
I wrote about it in this story from 2016, post-election. Only 20 percent of Americans trusted newspapers in 2016. Yoikes.
natesilver: Republicans hate the media a lot, and Democrats hate the media a little.
perry (Perry Bacon Jr., senior writer): According to a December 2017 Poynter report:
The survey found that 74% of respondents who identify as Democrats, or who lean Democratic, have “a great deal” (19%) or “a fair amount” (55%) of confidence in the media. A poll taken in September 2016 asked the same question and found that 51% of Democrats expressed the same level of support, meaning that their confidence has increased 23 percentage points in just one year.
Seventy-four percent confidence in the press is the highest level registered for Democrats since 1997, the earliest date for which similar data is available.
Meanwhile, the numbers among Republicans are declining.
micah: Holy moly, look at President Trump’s effect:
clare.malone: Anyhow. Yes, Republicans trust the media less. And it started well before this election cycle. A couple of people I’ve talked to about this — Republicans, expert and non — have cited the misreporting about George W. Bush’s military service as one of the first times they can remember an inflection point, a feeling that the media was partisan.
So this is a theme that goes back a ways.
micah: But Democrats gaining trust is new, right? And seems Trump-related? The enemy of my enemy, I guess.
clare.malone: I mean, I’m old enough to remember when Democratic primary voters — in particular, Bernie Sanders supporters — were berating the media about coverage during the 2016 election.
micah: That was then, Clare. Now we have President Trump.
natesilver: Yeah. It’s all about Trump, and saying you like the media is a way to say you’re not on Team Trump.
clare.malone: Indeed. Just wanted to cite this, so that readers know that this elephant never forgets.
March 5, 2018
We Talk Curling And Stats With The Guys Who Won The Gold
It all started as a predawn tweet:
No spoilers but I think we're gonna have to have an emergency curling podcast @jodyavirgan @Neil_Paine
— Nate Silver (@NateSilver538) February 21, 2018
But after the U.S. men’s Olympic curling team won gold in Pyeongchang, we knew it had to become reality. So, on Friday, despite bad weather in the Northeast — which left Nate calling in from an airport tarmac after his flight was diverted — I was joined in the FiveThirtyEight podcast studio by Olympic champion curlers John Shuster, Tyler George and Matt Hamilton.
We talked about curling analytics, the team’s new celebrity fans and where the sport goes from here. You can listen to it on your phone by subscribing to our NBA podcast, “The Lab,”1 or by clicking the play button below.
By Neil Paine
More: Apple Podcasts |
ESPN App |
RSS
| Embed
Embed Code
Here are some excerpts from the conversation.
On advice for first-time curlers:
Hamilton: “My best advice would be, don’t fall. In my first game at the Olympics, I fell. So don’t go down — it’s still hard ice. But in seriousness, if you go in with an open mind and are really curious about the sport itself — not just the throwing aspects, but actually immersing yourself in what curling is about — you’ll find all these people who are so willing to help and teach and get you into the strategy, which is really the draw. … Making shots is great, and it felt good when you made your first couple of shots in curling when you tried it, but when you finally learn why you’re throwing that shot, why making that shot set you up later in the game to win, it’s just a remarkable feeling. It really is like chess on ice, just that mental game mixed with a finesse game, mixed with the brute force of sweeping. It has all the aspects of a really fun game.”
On preparing with analytics guru Gerry Geurts of CurlingZone.com :
Hamilton: “He sat us down at our summer camp and explained to us where we sat [among] elite players at certain things, like with the hammer/without the hammer, up by one with the hammer/down by one with the hammer … and it went on for all of the potential scoring scenarios. And he gave us feedback [on] which positions we could be better at, which ones we’re really good at, where we need to keep doing what we’re doing. Then he gave us some info on other teams in those same kind of numbers. … I’d be lying if I said that didn’t come into play at all.”
On the flaws of using curling percentage to judge players and teams:
George: “It’s incredibly subjective because it depends on what types of shots you’re playing. And the way that they do stats for the television events [is] really simplistic because they’re only going on make/miss or how close you were to making the shot [but] not factoring in the difficulty of the shot. … So for the viewer at home, looking at our percentages, they probably thought that we weren’t playing nearly as well as our record would imply. … But a lot of that is because we’re playing with a lot more rocks in play. We’re making a lot more difficult shots, but the viewers are not seeing that.”
On the role analytics might have in the game in the future:
George: “There’s a major change coming up next season where they’re literally changing the rules in the game, where stats are going to have to be applied to figure out what the best strategies are … (Editor’s note: The change involves being able to add one extra protected stone to the area in front of the house.) It doesn’t seem like much — it’s only one more rock that you can’t take out to play — but it completely changes the strategy of how you start ends out, and they’ve been using it in Grand Slam events so far. So you see it maybe six or seven times a year, and teams are still kind of tinkering with strategy on how to defend, especially [because] it’s a way more offensive game. … Stats are going to be huge in figuring out the best ways to go about defending with this new strategy because we just haven’t done it that much.”
On whether curling will be able to capitalize on its newfound popularity:
Shuster: “I think you’re going to see it because [of] the ratings that we were getting during the Olympics and the ratings we’ve been getting with “Curling Night in America” the last couple of years. What happens is, we haven’t had national television coverage between Olympic cycles, and then every Olympics we get more and more coverage and the ratings get better and better. And then all of a sudden, NBC Sports Network ran “Curling Night in America,” so we had a weekly show going on. After we won the gold, they’re going to show one live game every single day during the world [championships] that are coming up in Vegas. … I think curling right now could be on [the same] trajectory as something like poker was 10 years ago. If the world championships are high-quality, entertaining TV this year, people are going to demand it more, and we’re going to start seeing it on more of a regular basis moving forward.”
Nate Silver's Blog

- Nate Silver's profile
- 730 followers

