
Nate Silver's Blog, page 77
November 9, 2018
Live: Watch The FiveThirtyEight Politics Podcast
The FiveThirtyEight Politics podcast is at the 92nd Street Y in New York for a live show. The crew plans to reflect on the 2018 midterm elections and play a fourth round of the 2020 presidential primary draft.
The live stream will begin at 7 p.m. Eastern on Friday, and the edited podcast will make it into your normal feed on Monday.
You can listen to our podcasts by downloading it in iTunes , the ESPN App or your favorite podcast platform. If you are new to podcasts, learn how to listen .
The FiveThirtyEight Politics podcast publishes Monday evenings, with occasional special episodes throughout the week. Help new listeners discover the show by leaving us a rating and review on iTunes . Have a comment, question or suggestion for “good polling vs. bad polling”? Get in touch by email, on Twitter or in the comments.


November 8, 2018
Politics Podcast: What The Midterms Taught Us About America
More: Apple Podcasts |
ESPN App |
RSS
| Embed
Embed Code
After a day or so of dissecting the data, the FiveThirtyEight Politics podcast team discuss the trends they saw in the 2018 midterm elections. Democrats did very well in the suburbs, particularly in Romney-Clinton districts. While Democrats did poorly in the Senate, it had largely to do with the partisanship of the states in play. Meanwhile, Sen. Ted Cruz’s victory of only 2.6 percentage points over Beto O’Rourke shows that Texas is becoming a peripheral battleground state.
You can listen to the episode by clicking the “play” button in the audio player above or by downloading it in iTunes , the ESPN App or your favorite podcast platform. If you are new to podcasts, learn how to listen .
The FiveThirtyEight Politics podcast publishes Monday evenings, with occasional special episodes throughout the week. Help new listeners discover the show by leaving us a rating and review on iTunes . Have a comment, question or suggestion for “good polling vs. bad polling”? Get in touch by email, on Twitter or in the comments.
The 2018 Map Looked A Lot Like 2012 … And That Got Me Thinking About 2020
With Democrats having won the House but not the Senate on Tuesday — and with President Trump still in the White House — we’re headed for two years of divided government. That doesn’t mean there won’t be news, like … oh, say, the president firing the attorney general the day after the election.
But it does mean that pretty much every political battle is going to be pitched with an eye toward 2020. And 2020 will be a unique year in that the House, Senate and presidency are all potentially in play.1 How the presidency goes is anybody’s guess. But Trump took advantage of the Electoral College last time around, winning the tipping-point state (Wisconsin) by about 1 percentage point even though he lost the popular vote by 2 percentage points. If Trump has the same edge in 2020, that could go a long way toward winning him a second term.
The thing is, though, that the Electoral College advantage is historically pretty ephemeral. Relatively subtle changes in political conditions can make the Electoral College go from helping you to hurting you. In 2008 and 2012, for example, the Electoral College worked toward Democrats’ benefit, as Barack Obama would likely have won it in the event of a popular vote tie.
So here’s some slightly scary news for Trump: The 2018 map looked more like 2012 than 2016, with Democrats performing quite well in Wisconsin, Michigan and Pennsylvania, the three states that essentially won Trump the election two years ago.
As a “fun,” day-after-the-election experiment, I decided to add up the total popular vote for the U.S. House in each state, based on ABC News’s tally of votes as of Wednesday afternoon. This isn’t a perfect exercise, by any means. The vote is still being counted in many states; there are a few dozen congressional districts where one of the parties (usually Republicans) didn’t nominate a candidate. I did make one adjustment for a slightly different problem, which is that Florida doesn’t bother to count votes in uncontested races, something that cost Democrats in the neighborhood of 720,000 votes off their popular-vote tally in that state.2
With those caveats aside, here’s the map you come up with if you count up the popular vote. It ought to look familiar. In fact, it’s the same exact map by which Obama defeated Mitt Romney in 2012, except with Ohio going to Republicans. It would have equated to 314 electoral votes for Democrats and 224 for the GOP.

States shaded in light blue were won by Democrats, but by fewer than 5 percentage points. So it’s noteworthy which states are not in light blue but are solid blue instead. Democrats won the popular vote in Michigan by 7 percentage points, in Wisconsin by 8 points, in Pennsylvania by 10 points, and in Minnesota by 11 points. In other parts of the country, they won Nevada and Colorado by 6 points each, New Hampshire by 12, Virginia by 15 and New Mexico by 19.
The pink states — where Republicans won by fewer than 5 percentage points — are also interesting, mostly because they include Texas, where Democrats lost the popular vote for the House by only 3.6 percentage points and Democrat Beto O’Rourke lost his race for the Senate by just 2.6 points. It’s not as though Texas is exactly at the tipping point yet: Democrats came close to winning it, but they didn’t get over the top, even in a pretty blue year. But it probably deserves to be included in a group of Sun Belt states with North Carolina, Arizona and perhaps Georgia (where Democrats lost the popular vote by 6 points) as places where Democrats can compete in a good year. Among these, Arizona was the best one for Democrats on Tuesday night; they currently trail in the popular vote for the House there by 1.7 points and could make up further ground, as a lot of ballots from Maricopa County are still left to be counted.
In less favorable developments for Democrats, they had very disappointing results in Ohio, where they lost the gubernatorial race and where their candidates lost the popular vote for the House by 5.5 percentage points. Ohio hasn’t gone the way of Missouri yet, where Democratic congressional candidates lost by 13 points on Tuesday night, but it may be getting there.
But all of this is a bit tautological: Of course the map looks good for you when you’ve had a good night. How about in an average year instead, when the overall vote is fairly close? Democrats currently lead in the national popular vote for the House by around 6 percentage points, and they’re likely to run that total up to 7 or perhaps 8 percentage points as additional votes are counted, mostly from the West Coast mail-balloting states (California, Oregon, Washington). On the other hand, the Democratic margin is a bit inflated because Republicans let quite a few districts go uncontested. So let’s go ahead and subtract 6 points from the Democrat’s 2018 margin in every state; this is a benchmark for what things might have looked like in a roughly neutral year:
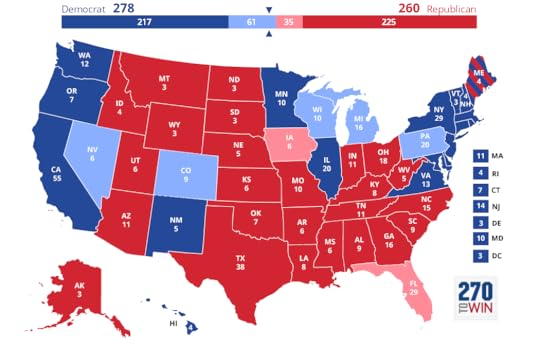
This is certainly not a great map for Democrats, but it’s not a bad one either. There are 217 solid Democratic electoral votes on this map, as compared to 225 solid Republican ones; the other 96 are tightly contested, but Democrats trail in Florida while narrowly leading in Wisconsin, Michigan and Pennsylvania. If 2020 were contested on this basis, you wouldn’t say that either side had a clear Electoral College advantage.
What is clear, though, is the importance of Pennsylvania, Wisconsin and Michigan (although you could also add Minnesota to the mix). Win all three of them — let’s call them the Northern Path — and Democrats don’t need Florida, assuming that they hold the other states. Lose all three, and even Florida wouldn’t be enough. Instead, they’d have to win Florida plus at least one of North Carolina, Arizona, Texas and Georgia as part of what you might call a Sun Belt Strategy.
Hillary Clinton’s problem was that Trump performed well in the Northern Path states — and she didn’t campaign in them enough — but at the same time, the Sun Belt Strategy wasn’t really ripe yet. She did much better than a typical Democratic candidate in Arizona and Texas, but not well enough to actually pull off wins there.
Getting stuck in between the Northern Path and the Sun Belt Strategy is a big risk for Democrats: where their Electoral College problems become most acute. And although the potential addition of Texas to the Sun Belt Strategy group of states makes it more intriguing, Tuesday night’s results suggest that the Northern Path is still the path of least resistance for a Democrat hoping to win the Electoral College. If Trump has lost the benefit of the doubt from voters in Pennsylvania, Wisconsin and Michigan, he may not have so much of an Electoral College advantage in 2020.
November 5, 2018
Final Election Update: Democrats Aren’t Certain To Take The House, But They’re Pretty Clear Favorites
This is a difficult article to write. Not for any deeply personal reason, but just because I’m not quite sure what I’m supposed to lead with — the most likely outcome or the uncertainty around that outcome.
Either way, there’s the potential for misunderstanding. People can mentally “round up” high probabilities to certainties. An 86 percent chance might seem like a sure thing, but it isn’t — would you board a plane that had a 14 percent chance of crashing?
But an 86 percent chance (or around 6 in 7) — which is the chance that Democrats have of winning the House, give or take a bit in the various versions of the FiveThirtyEight forecast model — is nonetheless a pretty good chance. (Republican odds of keeping the Senate are also just north of 80 percent in a nice bit of symmetry.) To say that the range of plausible outcomes is broad and includes Republicans keeping the House does not mean that all such outcomes are equally likely — a point on which some people may be confused too.
Here’s some perspective: An 86 percent chance is closer to Barack Obama’s odds of winning in 2012 than Hillary Clinton’s in 2016. The difference is basically this: Clinton, who had a 71 percent chance of winning the Electoral College in our final forecast — much lower than most journalists and most other statistical models assumed, as I’m annoyingly obligated to point out — lost the Electoral College on the basis of one thing going wrong: She underperformed her polls among white-working class voters in the MIdwest and the Rust Belt. That alone was enough to cost her Michigan, Wisconsin and Pennsylvania and therefore the Electoral College.1 Obama, by contrast, because he tended to overperform in the Midwest and in other key swing states, would have needed multiple things to go wrong to lose to Mitt Romney. Even if Romney had a systematic polling error in his favor, Obama might still have won by holding on to narrow victories in the key Electoral College states.
Likewise, Democrats need a couple of things to go wrong to lose tomorrow because not very much is going right for Republicans. (At least not when it comes to the House; it’s all going quite swimmingly for the GOP in the Senate.) At a macro level — based on national indicators and the historical tendency of the president’s party to lose seats at the midterm elections — the situation looks bad for Republicans. But at the local level — when you evaluate factors one district at a time, as our model does — it looks worse. The polling is bad for Republicans, the fundraising numbers are awful, and the slate of potential Democratic pickups runs deep into Republican territory. The data is uncertain, because it contains a margin-of-real-world-error. But I don’t think the data is ambiguous. It says Democrats are over the threshold they’d need to win the House.
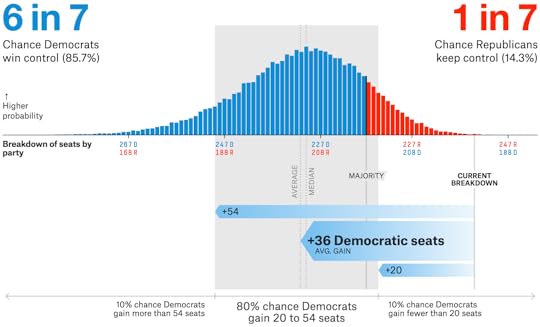
I’ll return to the micro vs. macro theme in a moment, but in case you aren’t reading any further, I want to leave you with this graphic. It shows the range of possible outcomes from the Deluxe version of our forecast, which is the version we expect to be most accurate and the one that will be the basis for our live-updating election night forecast. It’s all derived from how accurate polls and forecasts have been in the past, considering real-world uncertainties. And it conveys several important themes for how to think about our forecast:
The range of possible outcomes is wide. The shaded area, which covers the middle 80 percent of the forecast, runs from a Democratic gain of only 20 House seats, fewer than the 23 they need to win the House, all the way up to a gain of 54 seats. And remember, that covers only 80 percent of outcomes. There’s a 10 percent chance that Democrats gain more than 54 House seats, and a 10 percent chance they gain fewer than 20. The ranges in the other versions of our forecast, Classic and Lite, are wider still, with the potential for Democratic gains running up to about 60 seats.
Nonetheless, the considerable majority of the range is in Democratic territory. The Deluxe forecast shows them picking up a median gain of 35 seats and a mean of 36. So they do have some margin to spare.
Finally, the range is asymmetric, with the left tail (showing Democratic gains of 50+ seats) stretching out further than the right tail (showing a “red wave”). That’s because if Democrats beat their polls by a couple of points, they could begin to plunder seats that were gerrymandered to be “safe” for the GOP.
All right: Enough philosophical talk about forecasts and probabilities. For the rest of this update, I just want to talk about the underlying factors behind the election — the micro and macro conditions that are putting Republicans in a tough position.
By “macro” and “micro,” I roughly hope to make the following distinction. Macro factors are the hands the parties were dealt, the factors that were in place months or even years ago. Micro factors are how well the parties are playing their hands as they fight to win as many seats as possible.
Although the macro factors are mostly pretty good for Democrats, there are a couple of major exceptions. If Republicans hold onto the House — which again, is well within the realm of possibility, just not the most likely outcome — these will probably be the most important reasons why.
First, the economy is good. Consumers are optimistic, the unemployment rate is very low, inflation is low and wages are increasing. The relationship between economic performance and midterm outcomes isn’t actually that strong. But it gives Republicans and Trump some kind of positive message with swing voters — if not necessarily a message that Trump has always been disciplined enough to carry out.
Second — and this is perhaps the most important factor that I’ll list — Republicans hold a huge intrinsic advantage because they dominated the redistricting process after the 2010 elections in many states. Voter self-sorting further contributes to the Democrats’ problems. Democrats will almost certainly win more votes for Congress on Tuesday — generic ballot polls put them ahead by margins of 8 or 9 percentage points, larger than the margins in the 1994 Republican wave, or Obama’s landslide victory over John McCain in 2008. But Democrats would have to win the popular vote by somewhere on the order of 5 to 7 percentage points, according to the various versions of our model, to actually win the majority of House seats.
Three other macro factors help Democrats, however:
Opposition parties typically do well at the midterms. On average since World War II, the popular vote for the House swings by 7.3 percentage points from the president’s party toward the opposition party in midterm elections. That alone is a pretty big swing and would be enough to make Democrats competitive for the House. In fact, this is one of the most robust regularities in American politics: voters’ tendency to seek balance between Congress and the White House. So as bold as it might seem to suggest that Democrats will win 30-something House seats, that’s actually only slightly above the long-term average in midterms, where “wave” elections are as much the rule as the exception.
Next, President Trump is unpopular, with an approval rating of around 42 percent (slightly higher in polls of registered and likely voters). A brief approval-rating uptick that Trump experienced late last month appears to have at least partially been reversed, perhaps because of his rhetoric about immigration and reaction to recent hate crimes and domestic terror attacks. Trump is no longer a historical outlier — other presidents have entered the midterms with approval ratings in the low 40s. But midterm losses average about 37 seats for unpopular presidents, almost exactly what we’re forecasting for Democrats.
Finally, as parties become more parliamentary and ideological and candidates less-well catered to their districts, the incumbency advantage is considerably smaller than it used to be . This helps mitigate the fact that the map wasn’t drawn to provide for very many swing districts. Note, however, that while this factor helps Democrats in the House, it hurts them in the Senate, where they have a number of vulnerable incumbents.
On balance, the macro factors are good but not great for Democrats. You’d expect them to do pretty well since they’re the opposition party facing an unpopular president, but they have to do well in order to overcome the hurdles from how districts are drawn and where they’re clustered. (If, hypothetically, the redistricting process had taken place after the 2008 elections instead of 2010, the House wouldn’t be in any doubt whatsoever.)
Models based of these macro factors alone might give Democrats somewhere on the order of a 2 in 3 chance of winning the House. Once you take local factors into account, though — and local polling — Republican chances fall considerably. District-by-district polls are quite scary for Republicans, with many Republican incumbents mired in the mid-40s in polls and competitive districts running deep into territory that would have been considered “likely Republican” at the start of the cycle. Moreover, these polls seem to be getting worse for Republicans in the closing days of the campaign. Not only do Republicans need to win a large majority of the toss-up districts, they need to do it while running into a headwind.
What’s behind this? Several factors are helping Democrats:
A large number of Republican incumbents retired, including House speaker Paul Ryan, perhaps because they anticipated a tough time being re-elected or don’t enjoy dealing with Trump.
Democrats have nominated “good” candidates almost everywhere. They’re competing in all but three congressional districts. And the candidates are usually good fits for their districts, not necessarily having a history in politics, but often having military or business backgrounds.
Democrats have raised a disproportionate amount of money , leading Republicans by somewhere on the order of 2-1 among individual contributions in competitive districts. We’ve never seen numbers this lopsided before and they’re producing a similar Democratic advantage in television advertising in the closing weeks of the campaign. This may be what’s behind the apparent shift toward Democrats in swing-district polling.
Democratic voters are much more enthusiastic than in past midterms, although Republicans are too. This may be more an effect (a consequence of the other factors) than a cause, but nonetheless, “The Resistance” was ready to fight back early, as evidenced by strong Democratic performances in off-year and special elections.
Finally, scandalous and/or controversial Republican candidates have added to Republican problems, putting at least three districts in play (Chris Collins’s NY-27, Duncan Hunter’s CA-50, Steve King’s IA-4) that likely wouldn’t be competitive otherwise. There’s about a 7 percent chance that Democrats win a House majority by three seats or fewer, according to the Deluxe model, so this meaningfully contributes to their chances of a majority.
That’s enough. I’m tired of writing about this election and, like the rest of you, I’m just waiting to see what happens tomorrow. But I hope you see why Republican hopes to keep the House are fairly slim. Democrats have been dealt a good hand and have done a great job of playing it, maximizing their number of opportunities to make seat gains. There’s still a chance — about a 15 percent chance — that their voters won’t turn out in the numbers they need, and they’ll fall a few seats short. But it would require polling and a lot of other data to be fairly wrong, and it would defy a lot of historical precedent as to what happens in midterm elections under unpopular presidents.
Politics Podcast: The Midterms Are Here
More: Apple Podcasts |
ESPN App |
RSS
| Embed
Embed Code
It’s the day before Election Day and the FiveThirtyEight Politics podcast crew is checking the forecasts and other indicators one last time. The crew also asks whether President Trump’s appeals on immigration in the final weeks of the campaign are helping Republicans. And they share what trends they are most interested in watching as the results roll in on Tuesday.
You can listen to the episode by clicking the “play” button in the audio player above or by downloading it in iTunes , the ESPN App or your favorite podcast platform. If you are new to podcasts, learn how to listen .
The FiveThirtyEight Politics podcast publishes Monday evenings, with occasional special episodes throughout the week. Help new listeners discover the show by leaving us a rating and review on iTunes . Have a comment, question or suggestion for “good polling vs. bad polling”? Get in touch by email, on Twitter or in the comments.
November 3, 2018
Republicans Need A Systematic Polling Error To Win The House
As I wrote earlier this week, Democrats almost certainly need a systematic polling error to win the Senate. By that I mean: They need for the polls to be off everywhere, or at least in certain key clusters of states, to win the Senate. A polling error in just one or two races (say, Beto O’Rourke wins in Texas) probably wouldn’t be enough: Democrats are defending too much territory and have too many problems elsewhere on the map just to get lucky.
That conclusion about the Senate ought to be fairly intuitive, I think. Even if you credit Democrats with wins in all the toss-up races, that wouldn’t be enough — it would only get them to 50 seats. What might be more surprising is that the same conclusion holds for Republicans in the House. They need for there to be a systematic polling error too. If the polls are about right overall but Republicans are hoping to getting lucky in the swing districts, it probably won’t happen — the odds are stacked heavily against them.
The reason it’s counterintuitive is because you can’t really identify 23 districts that are safe bets to flip to Democrats (that’s the number they need to take the House). In the Deluxe version of our model (the one I’ll be focusing on here), only 193 seats are considered to be “solid Democratic” (at least a 95 percent chance of a Democratic victory). If Democrats won only those seats and no others, they’d actually lose two seats from the 195 they control now. Another 15 seats are “likely Democratic,” where Democrats have at least a 75 chance of winning. Win those as well, and Democrats are … still up to a net gain of only 13 seats.1
The model then has 34 seats in its three most competitive categories: “lean Democratic” (eight seats), “toss-up” (16 seats) and “lean Republican” (10 seats). If Republicans win 24 of those 34 seats — assuming everything else goes to form — they’ll keep the House.
How hard is that? Because of the possibility of a systematic polling error, it isn’t really that hard at all. If there’s a typical polling error of 2 to 3 percentage points and it works in Republicans’ favor, the House would be a toss-up. We might not even know the winner for several days as everyone waits for additional mail ballots to be returned from California. Thus, the Lite forecast gives Republicans a 2 in 9, or 22 percent, chance of keeping the House based on the possibility of a systematic polling error. Their chances are 18 percent in Deluxe and 15 percent in our Classic version, meanwhile.
That isn’t a great position, but those are real, tangible chances.
Without the possibility of a systematic polling error, however, the GOP’s position is nearly hopeless. If all races were independent from one another and GOP chances in the most competitive races were approximately 50-50, the Republicans would have to do the equivalent of have a coin come up heads at least 24 times in 34 attempts. That’s really hard. The probability of ending up with at least 24 heads in 34 tries is only about 1 in 80.
We can also come up with a more sophisticated version of this coin-flip calculation. Instead of putting the races into different buckets and treating them as 50-50, we can just use the probabilities listed by the Deluxe model in each of the 435 districts — that Republicans have an 83 percent chance of winning New York 24, for example. We can run a Monte Carlo simulation to see how often Republicans wind up with at least 218 seats. The answer is that, assuming that races are independent — again, a bad assumption, but what you get in a world in which there isn’t systematic polling error — Republican chances of holding the House are only about 1 in 1,000.
What if we use the Lite version of our calculations instead? Lite is essentially a “polls-only” forecast; it uses district-level polls in districts where it has enough of them and national (generic congressional ballot) polls and polls of similar districts to make inferences in districts where it doesn’t. If you run a Monte Carlo simulation with our Lite forecast — assuming that each district is independent — Republican chances aren’t much better, about 1 in 700.
But why is it so hard for Republicans to win the House without a systematic polling miss? The short answer is because they’re defending too much territory: The House playing field is exceptionally broad this year, because of Republican retirements, an influx of Democratic cash and other factors. The decisive race won’t necessarily be in a toss-up district; it could very easily be in a “likely Republican” district where a GOP incumbent is caught sleeping at the wheel (perhaps a district where there hasn’t been much polling).
To help illustrate the breadth of the playing field, I’ve sorted every House district based on the projected margin of victory or defeat for the Democratic candidate, according to the Deluxe model, and ordered them from No. 1 (the easiest seat for Democrats to win) to No. 435. Except, I’m only going to show you the districts in the middle of the spectrum; everything from district No. 190 (if Democrats won only 190 districts, they’d lose a net of five House seats) to No. 295 (a net gain of 100 seats).2
The 105 seats that will decide the House
Net change to the current distribution of the House if Democrats win that district and every other district with a greater chance of a Democratic victory
Rank
District
Dem. Candidate
GOP Candidate
Deluxe Margin
Net Change
190
MN-7
Collin Peterson
Dave Hughes
12.7
R+5
191
PA-8
Matt Cartwright
John Chrin
11.0
R+4
192
PA-17
Conor Lamb
Keith J. Rothfus
10.7
R+3
193
AZ-2
Ann Kirkpatrick
Lea Marquez Peterson
10.4
R+2
194
CA-49
Mike Levin
Diane L. Harkey
9.9
R+1
195
IA-1
Abby Finkenauer
Rod Blum
9.8
—
196
PA-7
Susan Ellis Wild
Martin W. Nothstein
9.7
D+1
197
AZ-1
Tom O’Halleran
Wendy Rogers
9.1
D+2
198
NV-4
Steven Horsford
Cresent Hardy
7.9
D+3
199
NH-1
Chris Pappas
Eddie Edwards
7.8
D+4
200
FL-27
Donna Shalala
Maria Salazar
7.7
D+5
201
VA-10
Jennifer Wexton
Barbara Comstock
7.1
D+6
202
NJ-11
Mikie Sherrill
Jay Webber
7.1
D+7
203
CO-6
Jason Crow
Mike Coffman
7.0
D+8
204
KS-3
Sharice Davids
Kevin Yoder
6.7
D+9
205
MN-2
Angie Craig
Jason Lewis
6.2
D+10
206
MN-3
Dean Phillips
Erik Paulsen
6.1
D+11
207
MI-11
Haley Stevens
Lena Epstein
5.2
D+12
208
NV-3
Susie Lee
Danny Tarkanian
5.0
D+13
209
NJ-7
Tom Malinowski
Leonard Lance
3.4
D+14
210
CA-10
Josh Harder
Jeff Denham
3.3
D+15
211
IA-3
Cindy Axne
David Young
2.2
D+16
212
CA-45
Katie Porter
Mimi Walters
2.2
D+17
213
NY-19
Antonio Delgado
John J. Faso
2.1
D+18
214
WA-8
Kim Schrier
Dino Rossi
1.9
D+19
215
IL-6
Sean Casten
Peter J. Roskam
1.9
D+20
216
CA-48
Harley Rouda
Dana Rohrabacher
1.8
D+21
217
CA-25
Katie Hill
Stephen Knight
1.7
D+22
218*
ME-2
Jared Golden
Bruce Poliquin
1.6
D+23
219
MI-8
Elissa Slotkin
Mike Bishop
1.4
D+24
220
KS-2
Paul Davis
Steve Watkins
1.4
D+25
221
NJ-3
Andy Kim
Tom MacArthur
1.0
D+26
222
CA-39
Gilbert Cisneros
Young Kim
0.9
D+27
223
NY-22
Anthony J. Brindisi
Claudia Tenney
0.7
D+28
224
UT-4
Ben McAdams
Mia B. Love
0.6
D+29
225
MN-1
Dan Feehan
Jim Hagedorn
0.6
D+30
226
NC-9
Daniel McCready
Mark Harris
0.5
D+31
227
KY-6
Amy McGrath
Andy Barr
0.2
D+32
228
FL-26
D. Mucarsel-Powell
Carlos Curbelo
-0.1
D+33
229
TX-7
Lizzie Fletcher
John Culberson
-0.2
D+34
230
VA-7
Abigail Spanberger
David Brat
-0.3
D+35
231
NM-2
Xochitl T. Small
Yvette Herrell
-0.6
D+36
232
PA-1
Scott Wallace
Brian K. Fitzpatrick
-0.7
D+37
233
FL-15
Kristen Carlson
Ross Spano
-1.8
D+38
234
NC-13
Kathy Manning
Theodore Paul Budd
-2.2
D+39
235
OH-12
Danny O’Connor
Troy Balderson
-2.2
D+40
236
IL-14
Lauren Underwood
Randy Hultgren
-2.3
D+41
237
VA-5
Leslie Cockburn
Denver Riggleman
-2.4
D+42
238
TX-32
Colin Allred
Pete Sessions
-3.0
D+43
239
NE-2
Kara Eastman
Don Bacon
-3.1
D+44
240
GA-6
Lucy McBath
Karen Handel
-3.1
D+45
241
VA-2
Elaine G. Luria
Scott W. Taylor
-3.3
D+46
242
PA-10
George B. Scott
Scott Perry
-3.9
D+47
243
MT-1
Kathleen Williams
Greg Gianforte
-4.1
D+48
244
IL-12
Brendan F. Kelly
Mike J. Bost
-4.5
D+49
245
IL-13
Betsy Londrigan
Rodney Davis
-4.6
D+50
246
FL-6
Nancy Soderberg
Michael Waltz
-4.8
D+51
247
MI-7
Gretchen Driskell
Tim Walberg
-4.9
D+52
248
NY-27
Nate McMurray
Chris Collins
-5.0
D+53
249
CA-50
A. Campa-Najjar
Duncan Hunter
-5.1
D+54
250
NY-11
Max Rose
Dan Donovan
-5.3
D+55
251
WI-1
Randy Bryce
Bryan Steil
-5.4
D+56
252
WA-3
Carolyn Long
Jaime Herrera Beutler
-5.4
D+57
253
OH-1
Aftab Pureval
Steve Chabot
-5.8
D+58
254
WA-5
Lisa Brown
C. McMorris Rodgers
-5.9
D+59
255
NY-24
Dana Balter
John Katko
-6.3
D+60
256
AK-1
Alyse S. Galvin
Don Young
-6.3
D+61
257
TX-23
Gina Ortiz Jones
Will Hurd
-6.4
D+62
258
NC-2
Linda Coleman
George Holding
-6.4
D+63
259
MN-8
Joe Radinovich
Pete Stauber
-6.5
D+64
260
GA-7
Carolyn Bourdeaux
Rob Woodall
-6.9
D+65
261
AZ-8
Hiral Tipirneni
Debbie Lesko
-7.0
D+66
262
IA-4
J.D. Scholten
Steve King
-7.0
D+67
263
MI-6
Matt Longjohn
Fred Upton
-7.2
D+68
264
FL-16
David Shapiro
Vern Buchanan
-7.6
D+69
265
WI-6
Dan Kohl
Glenn Grothman
-7.6
D+70
266
CA-21
TJ Cox
David Valadao
-7.6
D+71
267
PA-16
Ronald A. DiNicola
Mike Kelly
-7.8
D+72
268
AR-2
Clarke Tucker
French Hill
-7.9
D+73
269
FL-18
Lauren Baer
Brian Mast
-8.0
D+74
270
NY-2
Liuba Shirley
Peter King
-8.2
D+75
271
CA-4
Jessica Morse
Tom McClintock
-8.3
D+76
272
OH-14
Betsy Rader
David Joyce
-8.3
D+77
273
FL-25
Mary Barzee Flores
Mario Diaz-Balart
-8.3
D+78
274
TX-21
Joseph Kopser
Chip Roy
-8.3
D+79
275
MO-2
Cort VanOstran
Ann Wagner
-8.8
D+80
276
TX-22
Sri Kulkarni
Pete Olson
-9.0
D+81
277
NY-23
Tracy Mitrano
Thomas Reed
-9.4
D+82
278
CO-3
Diane Mitsch Bush
Scott Tipton
-9.4
D+83
279
SC-1
Joe Cunningham
Katie Arrington
-9.6
D+84
280
WV-3
Richard Ojeda
Carol Devine Miller
-9.8
D+85
281
OK-5
Kendra Horn
Steve Russell
-10.0
D+86
282
IN-9
Liz Watson
Trey Hollingsworth
-10.2
D+87
283
CA-1
Audrey Denney
Doug LaMalfa
-10.6
D+88
284
TX-31
Mary J. Hegar
John R. Carter
-10.8
D+89
285
TX-2
Todd Litton
Dan Crenshaw
-10.9
D+90
286
NC-8
Frank McNeill
Richard Hudson
-11.0
D+91
287
NY-21
Tedra Cobb
Elise Stefanik
-11.2
D+92
288
NY-1
Perry Gershon
Lee Zeldin
-11.3
D+93
289
OH-10
Theresa Gasper
Michael R. Turner
-11.5
D+94
290
AZ-6
Anita Malik
David Schweikert
-11.6
D+95
291
MI-1
Matt Morgan
Jack Bergman
-11.9
D+96
292
NC-7
Kyle Horton
David Rouzer
-12.1
D+97
293
CA-22
Andrew Janz
Devin Nunes
-12.3
D+98
294
OH-7
Ken Harbaugh
Bob Gibbs
-12.9
D+99
295
IN-2
Mel Hall
Jackie Walorski
-13.1
D+100
* The tipping-point district (the one that would give Democrats a 218-217 majority).
This table excludes the seats least likely to change hands. Based on FiveThirtyEight Deluxe model as of 11:30 p.m. on Nov. 2
If you know these districts pretty well, you can keep scrolling down the list until you tap out and say, “No, that’s too much for me.” For me, you get pretty far down the list before that happens. The 240th district, for example, which would correspond to a Democratic gain of 45 seats, is Georgia 6 — that’s the district where Democrat Jon Ossoff lost in a special election last year but where Lucy McBath has a decent shot because of the potential for higher black turnout. Chris Collins’s district is at No. 248, and Duncan Hunter’s is at 249. Alaska’s at-large district, where Democratic candidate Alyse Galvin actually had a tiny lead in the latest poll, is at No. 256. Steve King’s district is at No. 262. It’s about at that point that we get into upsets that I’d consider really far-fetched, but even then, there are a few interesting races. West Virginia 3, where Democrat Richard Ojeda has sometimes been competitive in polls despite it having voted overwhelmingly for Trump, is No. 280.
Democrats are underdogs in most of these districts individually, but they’re overwhelming favorites to win some of these districts or others like them on the list — unless the polls were wrong all along and were exaggerating the potential for a “blue wave.”
November 2, 2018
Politics Podcast: How To Judge Our Forecasts
More: Apple Podcasts |
ESPN App |
RSS
| Embed
Embed Code
In this installment of Model Talk on the FiveThirtyEight Politics podcast, Nate Silver explains how to judge the performance of the forecast, given that we expect the less likely scenario to happen sometimes. Nate also responds to listener questions, including explaining how all of the data in the forecast is collected.
You can listen to the episode by clicking the “play” button in the audio player above or by downloading it in iTunes , the ESPN App or your favorite podcast platform. If you are new to podcasts, learn how to listen .
The FiveThirtyEight Politics podcast publishes Monday evenings, with occasional special episodes throughout the week. Help new listeners discover the show by leaving us a rating and review on iTunes . Have a comment, question or suggestion for “good polling vs. bad polling”? Get in touch by email, on Twitter or in the comments.
November 1, 2018
Election Update: Democrats Need A Systematic Polling Error To Win The Senate
The divide between the House outlook and the Senate outlook continues to widen. Democrats’ chances of winning a majority remain at or near their all-time highs in our House forecast — ranging between 78 percent (7 in 9) and 85 percent (6 in 7) in the various versions of our model. But they’re at their lowest point yet in the Senate. All three versions of our forecast give them only about 1 in 7 shot (about 15 percent) of taking over the Senate from Republicans.
This is normally the point at which you might expect us to give you a throat-clearing “well, actually” about how 1 in 7 chances happen all the time. Indeed, they do. One in seven days of the week is a Thursday. None of us woke up this morning screaming “Oh my gosh, I just can’t believe it’s a Thursday!” And nobody should really be that surprised if Democrats win the Senate next week, or if Republicans keep the House.
At the same time, Republicans have a fairly clear advantage in the Senate (as Democrats do in the House) — clearer than the edge Hillary Clinton had before the 2016 election, when President Trump had roughly a 3 in 10 chance to win the Electoral College. In 2016, a normal-sized polling error (if it worked in Trump’s favor) was probably going to be enough to give him a victory in the Electoral College. And that’s exactly what happened: The polls weren’t great in 2016, but they were about as accurate as they have been on average since 1972. Because the race was close and because Clinton was underperforming in the Electoral College, a small and routine but systematic polling error was enough to give Trump the win.
The difference this year is that a normal-sized polling error in Democrats’ direction would merely make the race for the Senate close. (Likewise, a normal-sized polling error in the GOP direction would make the House close, but Republicans would still have to fight it out on a district-by-district basis.) A sports analogy, for those so inclined: In 2016, Trump was doing the equivalent of driving for the game-winning touchdown with the odds somewhat but not overwhelmingly against him. If enough undecided voters in the Midwest broke toward him, he was going to win the Electoral College. In the Senate this year, by contrast, it’s more like Democrats are driving for the game-tying touchdown; they still have to win in overtime even if they score.
By a systematic polling error, I mean one that occurs in a correlated way across every race, or in certain groups of races — not merely errors that happen on a one-off basis. Our models account for the possibility of several different types of systematic errors, but in this article, I’m going to focus on the simplest type of systematic error, which is a uniform swing that applies to every race. In certain simulations, for example, our model will randomly simulate a 4-percentage-point uniform swing toward Republicans, in which it adds 4 points to the Republican margin in every state and district. From there, it proceeds to consider the other types of error and uncertainty.
What’s clear is that Democrats will very probably need some type of systematic polling error to win the Senate: They’ve fallen too far behind in too many races to have much of a shot at winning just by getting lucky on a case-by-case basis.
Problem No. 1 for Democrats is that they don’t have a clear path to a majority. Even if they were to win all of the “toss-up” Senate races, plus all of the races in which they’re favored, they’d wind up stuck at 50 seats, with Republicans also having 50 seats and Vice President Mike Pence casting the tie-breaking vote to preserve a GOP majority. Instead, Democrats will have to win at least one of the races that our model currently deems as “lean Republican” or “likely Republican” — namely North Dakota, Texas, Tennessee or (less plausibly) the Mississippi special election.
But in certain ways, the no-clear-path problem is overrated. Democrats aren’t favored in any of these races individually, but if you put them together collectively, they have a decent shot at winning at least one. According to the Deluxe version of our model, Democrats have a 23 percent chance to win North Dakota, a 20 percent chance to win Tennessee, an 18 percent chance to win Texas, and a 12 percent chance to win the Mississippi special election.1 Assume for a moment — this is a bad assumption but it’s useful as an illustration — that each Senate race is independent from the next one.2 Under that assumption, there’s a 55 percent chance that Democrats win at least one of those four races.
But here’s Problem No. 2: Even if Democrats manage to pull off a big upset somewhere, they also have to win a lot of other contests in which they’re somewhere between modest favorites and mild underdogs. The most problematic of these races for Democrats are Missouri, Indiana, Nevada, Arizona and Florida. There’s also a smaller but non-trivial chance of a loss in Montana, West Virginia, New Jersey and the Minnesota special election. In fact, if you assume that each Senate race is independent, Democrats’ overall chances of winding up with a majority is only 4 percent or 5 percent, according to our numbers. There are a lot of scenarios in which Beto O’Rourke beats Ted Cruz in Texas but Claire McCaskill loses her race in Missouri, or Dean Heller outlasts Jacky Rosen in Nevada — or Bob Menendez somehow blows it in New Jersey.
It’s the fact that Senate races aren’t independent from one another that gives Democrats a somewhat better chance.
Consider, for example, what would happen if there were a 2.5 percentage point uniform swing in Democrats’ favor. Why 2.5 percentage points? Because according to our model — which is based on how often systemic polling errors have occurred in congressional races since 1990 — 2.5 percentage points represents about one standard deviation’s worth of uniform swing on election night.3 About one-sixth of the time, Democrats will beat their polls by at least one standard deviation (or 2.5 points) in the average competitive Senate race. Another one-sixth of the time, Republicans will beat their polls by at least 2.5 points in the average Senate race. The remaining two-thirds of the time, we’ll wind up somewhere in between. Here’s what the eight most important Senate races would look like with a 2.5-point uniform swing in Democrats’ favor, according to the Deluxe version of our forecast:
Democrats can compete in the Senate … if there’s a uniform polling error in their favor
Forecasted vote margins in eight key Senate races, according to FiveThirtyEight’s “Deluxe” model vs. with a hypothetical uniform swing of 2.5 points toward all Democrats, as of Nov. 1 at 2 a.m.
State
“Deluxe” model
2.5 point Dem. swing
North Dakota
R+5.5
R+3.0
Texas
R+5.4
R+2.9
Tennessee
R+5.3
R+2.8
Nevada
R+0.4
D+2.1
Missouri
D+0.8
D+3.3
Arizona
D+1.2
D+3.7
Indiana
D+2.6
D+5.1
Florida
D+2.6
D+5.1
Democrats must win six of these eight races to win the Senate, assuming less-competitive races go as predicted.
Keep in mind that these projections are not meant to be deterministic. They just recalibrate the numbers in Democrats’ favor based on the hypothetical of a uniform swing in their direction. This is a good scenario for Democrats, but not a best-case scenario: They’d still have to win each race on a case-by-case basis, just under more favorable conditions than we originally expected. In fact, to take the Senate, Democrats would need to win six of the eight races on the list above.4
How easy would that be? With a polling error in their favor, Democrats would still be underdogs in Tennessee, North Dakota and Texas — but lesser underdogs than before, down by about 3 percentage points in each race. They’d be favored in the other five key races, although not by much except in Florida and Indiana. Overall, the Senate would be a lot more competitive than under the status quo, although you’d still rather be in Republicans’ position.
Of course, Democrats aren’t necessarily limited to a 2.5-percentage-point polling error. About 1 election in 40, there will be a two standard-deviation error in their favor, or 5 percentage points’ worth of uniform swing. Even then, Tennessee, North Dakota and Texas would only be toss-ups, but the overall odds would be stacked pretty heavily toward Democrats. There are also various other types of regional or demographic polling errors that could help Democrats. If they outperformed their polls in rural areas, that would be helpful to their chances in the Senate, for example.
If the polls are right, Democrats will lose the Senate. But our model’s job is to consider all these different ways in which polls and other data might be wrong, based on how often the polls have been wrong in the past, and by how much. There’s about a 1 in 7 chance that the polls are wrong enough — and wrong enough in just the right ways — that Democrats win the Senate instead of Republicans.
October 30, 2018
The Battleground In The House Is Really Big — And That Makes Life Hard For Republicans
Read different news articles, and you’d be forgiven for not being sure whether the House map is expanding or contracting. It was less than two weeks ago, for instance, that The Washington Post claimed the prospect of a Democratic wave had diminished because of “President Trump’s rising approval rating and the polarizing fight over Supreme Court Justice Brett M. Kavanaugh.” Those factors were limiting Democrats’ upside in “conservative and rural districts” where Trump was popular, the article said, probably confining their biggest gains to wealthy suburbs.
But a New York Times article published this weekend told a totally different story, one of a broader House map where, bolstered by their unprecedented fundraising advantage, Democrats had Republicans on the defensive in “more conservative, exurban areas” in addition to the suburbs, as the “field of competition” had grown “well beyond 40 seats.” Recent Republican ad buys in deeply Republican districts such as South Carolina 1 would also seem to support the map-is-broadening hypothesis.
So which case is right? Is the House playing field getting bigger or smaller? The answer is … a bit complicated. In fact, the different versions of FiveThirtyEight’s House model tell somewhat different stories about it.
The Times’s article is more recent, however, and therefore probably closer to the mark. In early October, in the aftermath of the Kavanaugh hearings, you could make a good case that the map was contracting. But after those stellar Democratic fundraising numbers were reported earlier this month, and after Democrats continued to poll well in generic ballot and district-level polls, the map now appears about as broad as ever, with at least twice as many seats “in play” as in the last midterm, 2014.
As I mentioned, this is one of those times when the different versions of our model — Lite, Classic and Deluxe — show different trajectories. And I think they can help explain why reasonable observers might come to different conclusions about the state of play in the House. But first, let me just show you what they say. The chart below tracks the number of competitive races for each day since Aug. 1 according to the three forecasts, where a competitive race is defined as one in which each party has at least a 5 percent chance of winning.
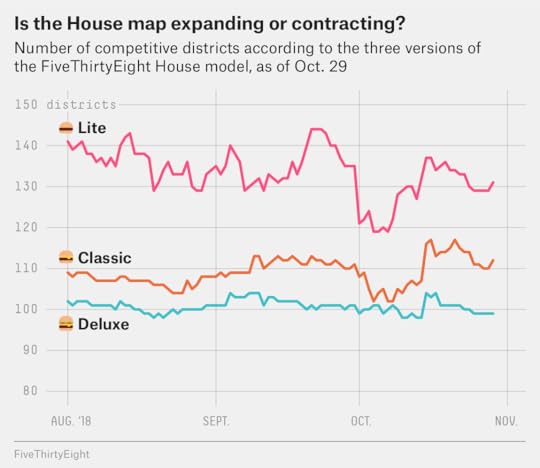
In the Lite model, which is based on district-level and generic-ballot polling only — and which uses an algorithm we call CANTOR to impute polling in districts that don’t have much of it — the number of competitive districts has gradually been decreasing over time, from about 140 (!) in August to a still-very-high 130 or so today. But that mostly reflects the increasing abundance and availability of district-level polling. Initially, Lite starts with a long list of districts that just might be competitive — races it would place in the “likely Republican” or “likely Democratic” categories (as opposed to “solid Republican” and “solid Democratic”). As polling comes in, some of these districts can be eliminated from being considered competitive, while others get promoted into the more intensely competitive categories (“lean Republican,” “lean Democratic” or “toss-up”).
There’s a big fluctuation in the Lite forecast in late September and early October, however. That reflects a period of comparatively weaker polling for Democrats in both the generic ballot and in district-level polls, which coincides with the apex of the Kavanaugh hearings. However, the Democrats pulled out of that polling slump a couple of weeks ago, with the generic ballot now back to showing an advantage for them of 8.5 percentage points and district polls showing vulnerable Republican incumbents in many different kinds of districts.
Democrats’ ceiling is sensitive to these minor changes in the political environment because there are a glut of districts that are somewhere between 10 and 20 percentage points more Republican-leaning than the country as a whole. Many of these districts were gerrymandered to be “safe” for Republican candidates. And in a medium-sized wave — say, one that featured a Democratic lead on the generic ballot of 6 to 7 percentage points — they probably would be safe. But once Democrats get up to about an 8- or 9-point lead instead, they’re really bumping up against the walls of these gerrymandered districts, and they may encounter incumbents who are underfunded and otherwise not-well-prepared for the challenge. In that sense, The Washington Post’s analysis was right: A relatively minor shift back toward Republicans, especially in conservative areas, could have really limited the Democrats’ upside potential. It was just mistimed; the shift that occurred toward Republicans in early October is no longer really evident in the polls now.1 Instead, Democratic candidates for Congress continue to poll well in some Trump-friendly districts as well as those that voted for Hillary Clinton for president.
Our Classic model incorporates “fundamentals” in addition to the polls — most importantly, including fundraising. And it shows the number of competitive districts generally having increased over time as Democrats’ fundraising numbers get better and better, especially in Republican-leaning areas where you’d ordinarily expect the incumbent to have a heavy fundraising advantage. In particular, there’s a spike in the number of competitive districts in the Classic forecast on or about Oct. 15, when third-quarter fundraising totals were reported to the FEC and incorporated into the model. The Classic model now shows around 110 competitive districts, the vast majority of which are currently held by Republicans. Since Democrats only need to win 23 of these to win the House — potentially plus a few extra to cover a couple of districts of their own they might lose — you can see why it’s become pretty bullish on Democrats’ chances.
Finally, there’s the Deluxe version of the model, which incorporates expert ratings such as those published by the Cook Political Report. That version shows the number of competitive districts as having been steady, at around 100, throughout the election cycle. Our model has its disputes with the expert ratings; in particular, based in part on Democrats’ fundraising prowess, it thinks the set of districts that Cook et al. rate as “likely Republican” are liable to be more competitive than they are ordinarily. But one thing that’s historically very rare for the expert ratings are false negatives — districts they rate as “solid” or “safe” are almost never won by the underdog. Instead, they tend to put any district where an upset is even thinkable into the “likely Republican” or “likely Democratic” categories. In general, these expert raters have shifted districts that were already deemed to be competitive leftward (e.g., from “lean Republican” to “toss-up”) over the course of the election. But they haven’t added to or subtracted much from the list of potentially competitive districts. Thus, the number of districts deemed to be competitive by Deluxe has held pretty steady.
But if the Deluxe forecast is right and “only” 100 districts are competitive, that’s still an awfully high number as compared to recent years. Just 38 House districts would have been classified as competitive by the Deluxe model at the end of the 2016 campaign, for example, or 44 of them in 2014.
The House playing field is as broad as it was in 2010
Races where each party has at least a 5 percent chance of winning based on FiveThirtyEight’s “Deluxe” model, as of Oct. 29
Year
Midterm?
number of Competitive Races
2010
✓
102
–
2012
70
–
2014
✓
44
–
2016
38
–
2018
✓
99
–
For 2010, values are derived from FiveThirtyEight’s House model as published at The New York Times. For 2012-16, it reflects backtested results from the current version of our model.
The number of competitive districts in 2010 was also around 100, by comparison, according to the House model that we published at the time.2 It was easy to see why so many districts were competitive that year, however. Democrats had pushed very deep into red territory after 2006 and 2008 and started out the 2010 midterm with a 256-179 advantage in the House. (By comparison, Republicans have “only” a 240-195 advantage now.) The shift against President Obama and the Democrats was very strong: Democrats went from winning the popular vote for the House by 11 percentage points in 2008 to losing it by 7 points in 2010. And districts back then were slightly less polarized and slightly less gerrymandered (although, there was still plenty of gerrymandering) than they are now. Republicans were reclaiming a lot of naturally red territory.
The 2018 House election is also being fought in red territory — only, it’s Democrats who have an opportunity to make big gains there. And it’s taken a whole assortment of factors to make the map as competitive as it is, somewhat despite the odds:
The large number of Republican retirements.
The massive Democratic cash advantage.
Democrats nominating competent candidates in almost every district.
The declining incumbency advantage. It used to be that all but the worst incumbents would outperform a hypothetical open-seat race in their districts. Now, that isn’t so clear, as the incumbency advantage is only about half as large as it was a couple of decades ago.
We’re now eight years removed from when maps were redrawn, and some districts (especially in the Sun Belt) have become more competitive over that period.
As mentioned, Republican gerrymanders do have a breaking point, and some of the more optimistic polling for Democrats puts them close to that breaking point.
Finally, redistricting in Pennsylvania and Republican scandals add a few additional competitive seats to the list.
All of this sets up what could be a feast-or-famine evening for Democrats next Tuesday. They have a huge number of opportunities to win Republican seats — around 100 of them! And yet, it would be hard to circle more than about 12 or 15 of these districts that can safely be predicted to wind up in Democrats’ hands. If things go roughly to form nationwide, Democrats almost certainly will get there. But even a modest pro-GOP polling error — if Republicans were to beat their polls by 2 or 3 points across the board — would revert the overall race to being a toss-up. Conversely, even a modest, pro-Democratic polling error could send their number of pickups careening into the 50s, or higher. The wide ranges in our forecast reflect the uncertain conditions on the ground.
October 29, 2018
Politics Podcast: Do Toxic Politics Lead To Violence?
More: Apple Podcasts |
ESPN App |
RSS
| Embed
Embed Code
After a week that saw attempted assassinations of Trump critics and apparent anti-Semitic and racist murders, the FiveThirtyEight Politics podcast crew discusses whether the state of American politics is contributing to the recent violent acts.
The team also looks at the narratives the two parties are telling themselves about their opportunities in the Senate and debates the best possible outcomes for each party.
You can listen to the episode by clicking the “play” button in the audio player above or by downloading it in iTunes , the ESPN App or your favorite podcast platform. If you are new to podcasts, learn how to listen .
The FiveThirtyEight Politics podcast publishes Monday evenings, with occasional special episodes throughout the week. Help new listeners discover the show by leaving us a rating and review on iTunes . Have a comment, question or suggestion for “good polling vs. bad polling”? Get in touch by email, on Twitter or in the comments.
Nate Silver's Blog

- Nate Silver's profile
- 730 followers

