
Nate Silver's Blog, page 38
September 24, 2020
What State Polls Can Tell Us About The National Race
Earlier this week, I was working on an article that claimed Joe Biden had better results in state polls than in national polls.
Then on Wednesday, the inevitable happened. Biden had some excellent results in national polls, including 10-point leads in high-quality national polls from Quinnipiac University and Marquette Law School, bringing his margin in our national polling average up to 7.3 percentage points. And he had some pretty bad state polls. ABC News/Washington Post polls showed him narrowly trailing President Trump in Florida and Arizona, for example, two states where he has usually held leads. (All numbers in this article are as of late Wednesday afternoon.)
Still, it’s worth thinking about what state polls can tell us about the national race. Suppose, for instance, that there were no national polls, and instead, we had to guess what the national popular vote would be from state polls. Actually, this wouldn’t be that hard at all!
Since we know how the states vote relative to the nation, we can use state polls to estimate national results. Florida, for instance, is typically about 3 points more Republican than the average state. So if Biden were ahead by 2 points in Florida, it would imply that he was ahead by 5 points nationally.
Why bother with this when we can just look at national polls directly?
Well, one good reason is that if used properly, state polls can actually give you a better projection of the national popular vote than national polls themselves! In 2012, for instance, our model — which then, like now, mostly uses state polls to forecast the national popular vote — showed then-President Barack Obama winning the popular vote by approximately 3 points, even though his lead in national polls was only about 1 point. Indeed, the state polls provided the better estimate of the national popular vote than the national polls did. (Obama won the popular vote that year by around 4 points.)
Keep in mind that there is a lot of information contained in those state polls. They may do a better job of estimating the preferences of demographic groups that are more common in their states — Cuban Americans in Florida, or Mormons in Utah, for example — than national polls ever could. And at least this year, the pollsters conducting state polls tend to be more highly rated than those doing national polls, especially with pollsters like New York Times/Siena College and our colleagues at ABC News1 doing more state polling this year than in the past.
So let me run you through a simplified version of how our model uses those state polls. It’s similar to the example about Florida above. In each state, our model calculates the national margin based on a state’s partisan lean, plus Biden’s current lead or deficit in our polling average. Here is that calculation for a broad group of purple states (or congressional district in the case of Nebraska) — everything on the spectrum from purple-red (maroon?) states like Texas to purple-blue (indigo?) states like New Mexico. I’ll show you the national margin based both on how a state voted in 2016 and how it voted in 2012 — in some cases, there are significant differences.
What purple state polls say about the national race
Biden’s polling lead or deficit in close states, and what that means for his national margin, based on 2016 and 2012 results
Biden national margin
State
Biden’s current lead or deficit*
Based on 2016 results
Based on 2012 results
Texas
-0.7
+10.4
+18.9
Georgia
-1.0
+6.2
+10.7
Iowa
-1.0
+10.5
-3.0
Ohio
-1.0
+9.2
-0.1
Arizona
+3.8
+9.4
+16.7
Nebraska 2nd District
+4.3
+8.6
+15.3
North Carolina
+1.2
+6.9
+7.1
Florida
+1.7
+5.0
+4.7
Pennsylvania
+4.6
+7.4
+3.1
Wisconsin
+6.8
+9.7
+3.7
New Hampshire
+6.9
+8.6
+5.2
Michigan
+7.5
+9.8
+1.9
Minnesota
+9.2
+9.8
+5.4
Nevada
+5.8
+5.5
+3.0
Virginia
+11.3
+8.1
+11.3
Colorado
+10.2
+7.4
+8.7
Maine
+13.9
+13.0
+2.5
New Mexico
+12.9
+6.8
+6.6
Average (weighted by turnout)
+3.6
+8.1
+7.2
*Based on FiveThirtyEight polling averages as of 4:10 p.m. Eastern on Sept. 23. States (or district in the case of Nebraska) are included only if they have at least five total polls or polls from at least three pollsters. Sorted from reddest to bluest.
As of late Wednesday afternoon, for example, Biden led by 6.8 percentage points in our polling average in Wisconsin. It’s clearly good news for Biden that he’s leading in Wisconsin, but what it implies about the national race depends on what year you’re comparing it with. In 2016, for instance, Wisconsin was about 2.9 points more Republican than the nation, so having a 6.8-point lead there would imply that Biden had a huge 9.7-point lead nationally. But in 2012, Wisconsin was 3.1 points more Democratic than the country overall, so a 6.8-point lead would imply only a 3.7-point national margin.
Indeed, you can see in the chart where Biden is running especially well or comparatively poorly relative to how the state usually votes. The fact that Biden is nearly tied with Trump in Texas is extremely impressive for Biden, for example. But it’s not a great sign for him that his lead in Florida is so narrow. In states like Iowa, Ohio, Michigan and Maine — which swung strongly against Hillary Clinton in 2016 — Biden’s performance is very impressive relative to four years ago, but not so much as compared with 2012.
However, averaging each state’s implied national margin and weighting it based on each state’s turnout puts Biden ahead by 8.1 points nationally if you’re using 2016 as a baseline, or 7.2 points if you’re using 2012 instead. In this case, that’s pretty similar to his current 7.3-point lead in national polls.
But what about polls in deeply red states and deeply blue states? Those states may not create much Electoral College suspense, but they do count toward the popular vote. First, Biden’s national margin in red states that have a sufficient2 amount of polling:
What red state polls say about the national race
Biden’s polling lead or deficit in traditionally Republican states, and what that means for his national margin, based on 2016 and 2012 results
Biden national margin
State
Biden’s current lead or deficit*
Based on 2016 results
Based on 2012 results
Oklahoma
-23.6
+14.9
+13.8
Kentucky
-18.6
+13.3
+7.9
Alabama
-14.9
+14.9
+11.1
Utah
-12.4
+7.6
+39.3
Tennessee
-12.3
+15.8
+11.9
Kansas
-9.3
+13.2
+16.1
Louisiana
-10.7
+11.0
+10.4
Montana
-8.0
+14.3
+9.5
Indiana
-14.4
+6.7
-0.3
Mississippi
-11.7
+8.2
+3.7
Missouri
-6.7
+13.9
+6.5
South Carolina
-6.8
+9.6
+7.5
Average (weighted by turnout)
-12.4
+12.0
+9.8
*Based on FiveThirtyEight polling averages as of 4:10 p.m. Eastern on Sept. 23. States are included only if they have at least five total polls or polls from at least three pollsters. Sorted from reddest to bluest.
Biden’s actually polling comparatively well in many of these red states. He’s not much of a threat to win them, but in a fair number of them, his deficit is in the single digits when Democrats usually lose them by the double digits. Whether this is real or reflects dubious polling is harder to say, however.
In very blue and very red states, it’s not uncommon for polls to underestimate the winning candidate’s margin. But maybe Biden, who isn’t as easily typecast as a liberal as Democrats like Clinton, Obama and John Kerry, has a bit more red-state appeal than other recent Democratic nominees have. Overall, the red state polls imply that Biden has a 12-point national lead (!) if you’re using 2016 as a baseline, or a 9.8 lead if you’re using 2012 instead.
How about polls in deeply blue states? Most of these states actually haven’t been polled very much, but of the ones that have, California stands out:
What blue state polls say about the national race
Biden’s polling lead or deficit in traditionally Democratic states, and what that means for his national margin, based on 2016 and 2012 results
Biden national margin
State
Biden’s current lead or deficit*
Based on 2016 results
Based on 2012 results
Connecticut
+20.7
+9.2
+7.2
New Jersey
+19.1
+7.2
+5.2
Washington
+24.4
+10.8
+13.5
New York
+26.8
+6.4
+2.5
Massachusetts
+34.1
+9.0
+14.8
California
+29.3
+1.4
+10.1
Average (weighted by turnout)
+27.1
+5.2
+8.5
*Based on FiveThirtyEight polling averages as of 4:10 p.m. Eastern on Sept. 23. States are included only if they have at least five total polls or polls from at least three pollsters. Sorted from reddest to bluest.
Biden is leading by “only” 29.3 percentage points there, which, of course, is a very large lead, but he is actually slightly down from Clinton’s 30.1-point win there in 2016. It makes some sense, though. Biden’s strength relative to Clinton is with older white voters, whereas California voters are majority-minority and young. Then again, that 29.3-point margin would still be higher than Obama’s margins there in 2012 — or in 2008. In total, the blue states imply a 5.2-point national lead for Biden using 2016 as a baseline, or 8.5 points using 2012.
Add it all up, and the state polls are a tiny bit better for Biden than his national polls show — but only a tiny bit.
The results from red, purple and blue states combined3 imply that Biden is ahead by 8.0 percentage points nationally (you get the same results whether using 2012 or 2016 as a baseline) as compared with his current 7.3-point lead in national polls.
Perhaps the broader lesson here is that we don’t really need national polls for all that much.
In fact, our model uses them fairly sparingly.4 The election is contested at the state level. Although it can be useful to know where the national popular vote stands for various reasons, you don’t actually need national polls to forecast it — you can come up with pretty good (indeed, often better) estimates of the national popular vote by using state polls instead.


September 23, 2020
Think The Electoral College Is Unfair To Democrats? Try The Senate.
FiveThirtyEight editor-in-chief Nate Silver explains how the Senate’s rural skew makes it hard for Democrats to win a majority.
For more insights into the race for the Senate, check out our 2020 Senate forecast.
September 22, 2020
The Potential Pitfalls In Rushing To Confirm A New Supreme Court Justice
In this installment of the FiveThirtyEight Politics podcast, the crew discusses the political calculations for both Republicans and Democrats over how to proceed in replacing Supreme Court Justice Ruth Bader Ginsburg.
September 21, 2020
Politics Podcast: What Comes Next In The Fight To Fill Ginsburg’s Seat
More: Apple Podcasts |
ESPN App |
RSS
So far, two Republican senators — Susan Collins and Lisa Murkowski — have announced their opposition to filling the Supreme Court seat that once belonged to Justice Ruth Bader Ginsburg before the 2020 election takes place. In this installment of the FiveThirtyEight Politics podcast, the crew discusses the political calculations for both Republicans and Democrats over how to proceed in replacing Ginsburg. They also look at the dynamics at play in key Senate races in Maine, Iowa and Arizona.
You can listen to the episode by clicking the “play” button in the audio player above or by downloading it in iTunes , the ESPN App or your favorite podcast platform. If you are new to podcasts, learn how to listen .
The FiveThirtyEight Politics podcast is recorded Mondays and Thursdays. Help new listeners discover the show by leaving us a rating and review on iTunes . Have a comment, question or suggestion for “good polling vs. bad polling”? Get in touch by email, on Twitter or in the comments.
September 20, 2020
The Senate’s Rural Skew Makes It Very Hard For Democrats To Win The Supreme Court
I don’t have a particularly strong take on how the death of Ruth Bader Ginsburg will affect either the presidential election or the race for control of the U.S. Senate. And I’d encourage you to avoid putting too much stock in anybody else’s take for now, too. The very earliest indication is that President Trump’s desire to move full-speed ahead toward naming Ginsburg’s replacement could be unpopular, but that’s based on only one poll.
But here’s what I do know: the Senate is an enormous problem for Democrats given the current political coalitions, in which Democrats are dominant in cities while Republicans triumph in rural areas. And because the Senate is responsible for confirming Supreme Court picks, that means the Supreme Court is a huge problem for Democrats too. Sure, Democrats might win back the Senate this year — indeed, they were slight favorites to do so before the Ginsburg news. But in the long run, they’re likely to lose it more often than not.
You can probably grasp intuitively that a legislative body which provides as much representation to Wyoming (population: 580,000) as California (population: 39.5 million) will tend to favor rural areas. But it’s a bigger effect than you might realize, so let’s run some numbers. At FiveThirtyEight, our favorite way to distinguish between urban and rural areas is based on using census tracts to estimate how many people live within a 5-mile radius of you. Based on this, we can break every person in the country down into four buckets:
Rural: Less than 25,000 people live within a 5-mile radius of you;
Exurban or small town: Between 25,000 and 100,000 people within a 5-mile radius;
Suburban or small city: Between 100,000 and 250,000 people within a 5-mile radius;
Urban core or large city: More than 250,000 people within a 5-mile radius.
As it happens, the overall U.S. population (including Washington D.C. and Puerto Rico) is split almost exactly evenly between these buckets: 25 percent rural, 23 percent exurban/small town, 27 percent suruban/small city, and 25 percent urban core/large city.
But what does representation look like in the Senate? Since each state has the same number of senators, this is simple to calculate. We can take the urban/rural breakdown for each state and average the 50 states together, as in the table below:
The Senate has a major skew towards rural voters
Proportion of population by area across the U.S. as a whole, in each individual state and in the average state (i.e. as reflected in the Senate)
State
Rural
Exurban /Small Town
Suburban /Small City
Urban Core /Big City
U.S. population total*
25%
23%
27%
25%
Average state
35
26
25
14
State
Rural
Exurban /Small Town
Suburban /Small City
Urban Core /Big City
Alaska
53%
18%
28%
0%
Alabama
51
33
16
0
Arkansas
58
36
6
0
Arizona
17
19
29
35
California
8
13
26
54
Colorado
21
18
30
31
Connecticut
8
35
45
11
Delaware
24
27
49
0
Florida
13
27
35
26
Georgia
31
29
32
7
Hawaii
23
22
35
19
Iowa
52
29
19
0
Idaho
42
36
22
0
Illinois
19
15
28
38
Indiana
37
27
33
2
Kansas
41
25
31
3
Kentucky
52
20
23
5
Louisiana
41
30
20
9
Massachusetts
6
32
35
27
Maryland
13
22
29
36
Maine
69
25
6
0
Michigan
30
23
28
19
Minnesota
36
19
25
20
Missouri
41
19
31
9
Mississippi
65
29
6
0
Montana
59
41
1
0
North Carolina
37
36
25
1
North Dakota
49
39
12
0
Nebraska
36
17
39
8
New Hampshire
39
42
18
0
New Jersey
5
18
33
44
New Mexico
41
28
26
5
Nevada
13
9
25
53
New York
14
14
15
57
Ohio
26
29
33
12
Oklahoma
44
23
32
1
Oregon
29
21
24
26
Pennsylvania
23
31
25
21
Rhode Island
8
31
22
39
South Carolina
40
41
18
0
South Dakota
65
19
16
0
Tennessee
41
31
28
0
Texas
21
17
34
27
Utah
21
19
41
19
Virginia
28
22
34
17
Vermont
79
21
0
0
Washington
20
22
39
19
Wisconsin
41
27
19
13
West Virginia
64
36
0
0
Wyoming
66
34
0
0
*Totals for the U.S. as a whole include Washington, D.C. and Puerto Rico
Because there are a lot of largely rural, low-population states, the average state — which reflects the composition of the Senate — has 35 percent of its population in rural areas and only 14 percent in urban core areas, even though the country as a whole — including dense, high-population states like New York, Texas and California — has about 25 percent of the population in each group. That’s a pretty serious skew. It means that the Senate, de facto, has two or three times as much rural representation as urban core representation … even though there are actually about an equal number of voters in each bucket nationwide.
And of course, this has all sorts of other downstream consequences. Since rural areas tend to be whiter, it means the Senate represents a whiter population, too. In the U.S. as a whole, 60 percent of the population is non-Hispanic white and 40 percent of the population is nonwhite.1 But in the average state, 68 percent of people are white and 32 percent are nonwhite. It’s almost as if the Senate has turned the clock back by 20 years as far as the racial demographics of the country goes. (In 2000, around 69 percent of the U.S. population consisted of non-Hispanic whites.)
It also means that the median states — the ones that would be decisive in the event of a 50-50 tie in the Senate — are considerably redder than the country as a whole. In the next table, I’ve arranged the states from top to bottom based on how much more or less Republican they were than the national average in the presidential elections in 2016 and 2012.2
A red state is most likely to decide the Senate
Republican margin or deficit in the last two presidential elections relative to national average by state and a blended average (representing current partisan lean)
Rank
State
2016
2012
Blended*
1
Wyoming
48.4
44.7
47.5
2
West Virginia
43.8
30.5
40.5
3
Oklahoma
38.5
37.4
38.2
4
Idaho
33.9
35.5
34.3
5
North Dakota
37.8
23.5
34.2
6
Kentucky
31.9
26.5
30.6
7
South Dakota
31.9
21.9
29.4
8
Alabama
29.8
26.0
28.9
9
Arkansas
29.0
27.5
28.6
10
Utah
20.0
51.7
27.9
11
Tennessee
28.1
24.2
27.1
12
Nebraska
27.1
25.6
26.8
13
Kansas
22.5
25.4
23.2
14
Louisiana
21.7
21.1
21.6
15
Montana
22.3
17.5
21.1
16
Indiana
21.1
14.1
19.3
17
Mississippi
19.9
15.4
18.8
18
Missouri
20.6
13.2
18.8
19
Alaska
16.8
17.8
17.1
20
South Carolina
16.4
14.3
15.9
21
Texas
11.1
19.6
13.2
22
Georgia
7.2
11.7
8.3
23
Iowa
11.5
-2.0
8.1
24
Ohio
10.2
0.9
7.8
25
Arizona
5.6
12.9
7.4
MEDIAN
6.6
26
North Carolina
5.7
5.9
5.8
27
Florida
3.3
3.0
3.2
28
Pennsylvania
2.8
-1.5
1.7
29
Wisconsin
2.9
-3.1
1.4
30
New Hampshire
1.7
-1.7
0.9
31
Michigan
2.3
-5.6
0.3
32
Minnesota
0.6
-3.8
-0.5
33
Nevada
-0.3
-2.8
-1.0
34
Virginia
-3.2
-0.0
-2.4
35
Colorado
-2.8
-1.5
-2.5
36
Maine
-0.9
-11.4
-3.5
37
New Mexico
-6.1
-6.3
-6.2
38
Oregon
-8.9
-8.2
-8.7
39
Delaware
-9.3
-14.8
-10.7
40
Connecticut
-11.5
-13.5
-12.0
41
New Jersey
-11.9
-13.9
-12.4
42
Washington
-13.6
-10.9
-12.9
43
Illinois
-14.8
-13.0
-14.3
44
Rhode Island
-13.4
-23.6
-16.0
45
New York
-20.4
-24.3
-21.4
46
Massachusetts
-25.1
-19.3
-23.7
47
Maryland
-24.3
-22.2
-23.8
48
California
-27.9
-19.2
-25.7
49
Vermont
-24.3
-31.7
-26.2
50
Hawaii
-30.1
-38.8
-32.3
* Based on a combination of 75 percent 2016 and 25 percent 2012. This is a simplified version of how FiveThirtyEight’s partisan lean index is calculated.
The median falls in between Arizona and North Carolina, which are, on average, 6.6 percentage points more Republican than the country as a whole. Democrats can compete in these states and are doing so this year, but they’re doing so in an overall political environment which leans Democratic by 6 to 7 percentage points based on the generic congressional ballot and national polls of the presidential race.
In a strong national environment for Democrats, in other words, the Senate can be competitive. Generally speaking, at least. A Democratic-leaning environment wasn’t enough to overcome the Senate’s baseline GOP-lean and a bad map in 2018. Democrats lost seats. And in an average year — and certainly in a year like 2014 where Republicans have the advantage — Democrats face dire prospects in the Senate.
Indeed, despite their current 47-53 deficit in the Senate, Democratic senators actually represent slightly more people than Republicans. If you divide the U.S. population by which party represents it in the Senate — splitting credit 50-50 in the case of states such as Ohio that have one senator from each party — you wind up with 167 million Americans represented by Democratic senators and 160 million by Republicans.
Could the emerging electoral map — with states such as Texas, Arizona and Georgia becoming more purple — help Democrats in the Senate? Actually, while the shifting politics in those states could massively affect the Electoral College, they don’t help Democrats in the Senate that much because they still have only two senators each.3
Rather, what Democrats really need to negate their disadvantage in the Senate is to find some small-population states that move toward them. Other than Nevada, they haven’t really had any of these recently. (Montana and Alaska are probably the least-implausible candidates, although Montana’s presidential voting has actually been getting redder.) There’s also the chance that the small, predominantly white working-class states of New England — such as Maine, New Hampshire and even Rhode Island — could move against Democrats, which could make their Senate problems even worse, although Maine is polling strongly for Joe Biden this year.
Democrats could also consider adding states to the union. If both Washington D.C. and Puerto Rico became solidly Democratic states (not necessarily a safe assumption in the case of Puerto Rico), the Senate’s Republican lean would be reduced from 6.6 points to 4.5 points. If D.C. and Puerto Rico joined and that ranged from Democratic-leaning to solidly blue, it would deplete further to 2.5 points. But that also goes to show you how robust the Republicans’ advantage is. You could add four Democartic states (D.C., Puerto Rico, California/A and California/B) and the Senate would still have a slight Republican tilt.
Obviously, political coalitions can change over time. Maybe you’re reading this article in 2036 and it seems incredibly silly because Mormons have become a super Democratic group and Montana, Utah and Idaho are all blue states … who knows. But for the time being, the Senate is effectively 6 to 7 percentage points redder than the country as a whole, which means that Democrats are likely to win it only in the event of a near-landslide in their favor nationally. That’s likely to make the Republican majority on the Supreme Court pretty durable.
September 19, 2020
Will The Supreme Court Be The Most Important Issue For Voters In 2020?
In this emergency installment of the FiveThirtyEight Politics podcast, the crew discusses the implications of Supreme Court Justice Ruth Bader Ginsburg’s death and what that might mean for the election and the future of the court.
Politics Podcast: How A Supreme Court Vacancy Will Shape The Election
More: Apple Podcasts |
ESPN App |
RSS
In this emergency installment of the FiveThirtyEight Politics podcast, the crew discusses Supreme Court Justice Ruth Bader Ginsburg’s death and how the political fight over the court’s new vacancy might unfold.
You can listen to the episode by clicking the “play” button in the audio player above or by downloading it in iTunes , the ESPN App or your favorite podcast platform. If you are new to podcasts, learn how to listen .
The FiveThirtyEight Politics podcast is recorded Mondays and Thursdays. Help new listeners discover the show by leaving us a rating and review on iTunes . Have a comment, question or suggestion for “good polling vs. bad polling”? Get in touch by email, on Twitter or in the comments.
September 18, 2020
Politics Podcast: Our 2020 Senate Forecast Is Live!
More: Apple Podcasts |
ESPN App |
RSS
We’ve launched our 2020 Senate forecast, and it shows that the Democrats are slightly favored to win control. In this episode of “Model Talk” on the FiveThirtyEight Politics podcast, Nate Silver and Galen Druke discuss the various considerations the forecast model makes as well as which races are worth watching.
You can listen to the episode by clicking the “play” button in the audio player above or by downloading it in iTunes , the ESPN App or your favorite podcast platform. If you are new to podcasts, learn how to listen .
The FiveThirtyEight Politics podcast is recorded Mondays and Thursdays. Help new listeners discover the show by leaving us a rating and review on iTunes . Have a comment, question or suggestion for “good polling vs. bad polling”? Get in touch by email, on Twitter or in the comments.
Why Our Forecast Says Democrats Are Slightly Favored To Win The Senate
In this episode of Model Talk, Nate Silver and Galen Druke introduce our 2020 Senate forecast — and answer some listener questions.
Democrats Are Slight Favorites To Take Back The Senate

Democrats are slight favorites to regain control of the Senate, according to the FiveThirtyEight Senate forecast, which launched today. But the map is wide open, with at least a dozen competitive races — none of which are certain pickups for Democrats — including some states where Democrats are playing defense.
In fact, while it’s possible that Democrats will wind up controlling 54 seats or perhaps even more, the most likely outcome is a much more closely divided chamber, including the possibility of a 50/50 split in which control of the Senate would be determined by whether the vice president is Kamala Harris or Mike Pence. (Joe Biden and Harris currently have a 76 percent chance of winning the presidential race, according to our forecast.1)
Our Congressional model (our forecast for House races will be released soon) is largely the same as the version we built in 2018, which was quite accurate in predicting the number of Senate and House seats that each party would win. We’ve made a handful of changes since 2018, most of which were designed to create more consistency with our presidential forecast, including assuming that uncertainty is slightly higher this year because of an increase in mail voting under COVID-19. But these adjustments don’t greatly change the outlook. For a complete list of changes, see our methodology guide.
As in 2018, there are three versions of the model, which build on one another and become increasingly complex:
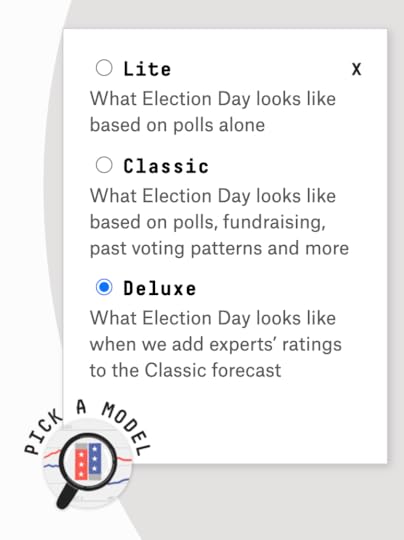
The Lite version of the model relies as much as possible on polling. In races that don’t have much or any polling, it calculates the candidates’ standing from other races that have been polled.
The Classic version relies on polling but also incorporates “fundamentals” such as fundraising, incumbency and a state’s partisan lean relative to the rest of the country.
Finally, the Deluxe version takes all of the above and adds in expert ratings from The Cook Political Report, Inside Elections and Sabato’s Crystal Ball.
By default, we’re showing you the “Deluxe” version of the model this year. It’s supposed to be the most accurate one and — given everything going on — we’re inclined to cut to the chase. But you can toggle between the versions using the magnifying glass icon at the bottom of the page.
You might want to get in the habit of doing this, too, because there are some fairly large differences between the model versions this year. This reflects the fact that the polling in individual Senate races is generally quite good for Democrats, while other indicators and expert ratings are more equivocal. For instance, the poll-centric Lite version of the model currently gives Democrats a 68 percent chance of winning the Senate, as compared to a 64 percent chance in the Classic version and a 58 percent chance in the Deluxe version.2
These differences stem from the fact that despite their strong polling, conditions for Democrats are inherently a little challenging in the Senate. They need to gain a net of three or four seats to win control, depending on if they also win the presidency. More likely, though, they will need to flip four or five Republican-held seats, because chances are good that one seat will flip from blue to red: Democrat Doug Jones is an underdog to keep his seat in Alabama, which he won against a very bad opponent in a special election in 2017.
Furthermore, while there are a great many Republicans up for re-election this year, only two of them (Colorado’s Sen. Cory Gardner and Maine’s Sen. Susan Collins) are in states that Hillary Clinton won in 2016. Thus, Democrats will have to pick up seats in states that have traditionally been Republican-leaning, such as Georgia and North Carolina. They also have some more ambitious (but redder) targets in races in Kansas, South Carolina and Alaska.
National conditions are pretty good for Democrats — they lead on the generic congressional ballot by 6.4 percentage points, and President Trump is fairly unpopular and an underdog for reelection — but they are not spectacular. (Democrats won the popular vote for the House by nearly 9 points in 2018, for example, a bigger margin than their current generic-ballot lead.) Moreover, Democrats are mostly aiming to defeat Republican incumbents, and even though the incumbency advantage has diminished in recent years, it’s rare that you can take much for granted in races featuring incumbents.
Still, the sheer number of plausible Democratic pickup opportunities is surprising — and favorable for the party — given that the conventional wisdom in 2019 was that Democrats might have trouble finding enough targets to take the Senate. The table below is a list of Republican-held seats where Democrats have at least a 5 percent chance of winning in at least one version of our model. There are 16 (!) of these. In some cases, the model is being exceptionally conservative because of a lack of polling in the state, but the first dozen on the list are realistic pickup opportunities for Democrats.
Where Democrats are most likely to pick up Senate seats
Republican-held seats where Democrats have at least a 5 percent chance of winning in at least one version of FiveThirtyEight’s model, as of 5 p.m on Sept. 17
Chance a Democrat wins
State
Incumbent
Lite
Classic
Deluxe
Arizona (special)
McSally
86%
80%
78%
Colorado
Gardner
78
71
68
North Carolina
Tillis
70
70
61
Maine
Collins
75
54
51
Iowa
Ernst
48
41
42
Montana
Daines
40
32
32
Georgia
Perdue
31
27
25
Kansas
—
33
28
22
Georgia (special)
Loeffler
17
19
17
South Carolina
Graham
26
19
15
Alaska
Sullivan
22
17
13
Texas
Cornyn
15
13
11
Mississippi
Hyde-Smith
14
11
5
Kentucky
McConnell
7
6
5
Louisiana
Cassidy
6
5
3
Tennessee
—
11
Democrats’ single best pickup opportunity is probably in Arizona, where Republican Sen. Martha McSally — who lost to Democrat Kyrsten Sinema in the race for Arizona’s other Senate seat two years ago — badly trails Democrat Mark Kelly in polls. Nor is McSally, who was appointed to the seat following the death of Sen. John McCain, likely to benefit much from incumbency, as appointed incumbents typically perform much worse than elected ones.3
Meanwhile, the two Republicans in Clinton-won states, Gardner and Collins, are also behind in polls. Still, it may be premature to write their political obituaries, especially for Collins. She won her last race by a large margin, she has a fairly moderate voting record, Maine only barely voted for Clinton in 2016, and experts continue to rate the race as a toss-up, all factors that help keep her afloat in our Classic and Deluxe models.
The fourth state where Democrats are currently favored for a pickup is in North Carolina, where Democrat Cal Cunningham, a former state senator, leads Republican incumbent Sen. Thom Tillis in polls and is also a slight favorite according to the “fundamentals” our model evaluates. And troubling for Tillis is that he has some of the hallmarks of a weak incumbent: He only barely won his seat in 2014, which was a much better political environment than the one Republicans face now, and he badly lags Cunningham in fundraising.
Indeed, many Republican incumbents, such as Sens. Joni Ernst of Iowa, David Perdue of Georgia and Dan Sullivan of Alaska, face some version of this problem, as many of them won by single-digit margins in 2014, a year when Republicans won the popular vote for the U.S. House by about 6 points. But this year, the national environment favors Democrats by 6 or 7 points, so that’s around a 12-point swing, putting Republicans who won by narrow margins last time in the danger zone.
Other Demoratic opportunities are more idiosyncratic. In Montana, they’re hoping to benefit from the personal popularity of Steve Bullock, who is currently the governor there (although the Republican incumbent is favored in our forecast at the moment). And in South Carolina, Democrat Jaime Harrison has run a surprisingly competitive race against incumbent Sen. Linsday Graham, who once had a reputation for moderation but has now become a major defender of Trump, a shift that may mean he’s now not satisfying voters in either camp. In addition to Perdue’s seat, there is also a second seat open in Georgia, currently held by the appointed incumbent Sen. Kelly Loeffler. (This special election is unusual, though, in that multiple candidates from both parties will face off on Election Day, and if no one gets a majority, two candidates will move to a runoff in January.)
In an average simulation, our forecast has Democrats picking up about six Republican-held seats in the Lite model, around five in the Classic model and about four and a half in the Deluxe model.4 And that would be enough for them to win control of the Senate — even if they fail to capture the presidency.
However, Democrats also have some seats of their own to defend. Most notably, there is Jones’s seat in Alabama. Running for reelection as a Democrat in one of the reddest states in the country puts him at a disadvantage, and this time around he doesn’t have the benefit of running against Roy Moore, who multiple women accused of pursuing sexual relationships with them while they were in their teens. (Instead, his opponent is the former Auburn football coach Tommy Tuberville.) But like Collins in Maine, whose chances shift significantly depending on which version of the model you look at, Jones might not be completely done for. The polls do make it look like Jones is a goner (hence his low chances in the Lite forecast), but the fundamentals — including the fact that he’s raised a lot of money and has a track record of moderation — give Jones an uphill chance at victory.
Where Republicans are most likely to pick up Senate seats
Democrat-held seats where Republicans have at least a 5 percent chance of winning in at least one version of FiveThirtyEight’s model, as of 5 p.m. on Sept. 17
Chance a Republican wins
State
Incumbent
Lite
Classic
Deluxe
Alabama
Jones
90%
64%
72%
Michigan
Peters
15
15
17
Minnesota
Smith
15
14
7
New Mexico
—
13
8
5
New Hampshire
Shaheen
5
1
2
After Alabama, there is a big drop-off in the likelihood of possible Republican pickups, but their next best chance is probably in Michigan, where John James, who ran a surprisingly vigorous race against Demoratic Sen. Debbie Stabenow in 2018, is within striking distance of Michigan’s other Democratic senator, Gary Peters. Minnesota, New Mexico and New Hampshire also represent long-shot opportunities for Republicans, although those seats will likely change hands only if the night is going very badly for Democrats.
So while we know you’re tired of hearing this … the outcome is, at this point, uncertain.
There are plausible upside scenarios for Democrats where tight polling margins against incumbents like Graham prove to be the canary in the coal mine for widespread Republican problems, and Biden and Harris get to craft an agenda with as many as 54 or 55 Democratic senators.
At the same time, though, the Senate is probably a heavier lift for Democrats than the presidency. Let’s imagine, for example, that Biden flipped Wisconsin, Michigan, Pennsylvania and Arizona and retained all the states Clinton won, which would imply a solid but not overwhelming margin in the presidential race. In that scenario, even if every Senate race went the same way as the presidential election, Democrats would still come up one seat short, picking up Maine, Colorado and Arizona but losing Jones’s seat in Alabama.
And while it’s certainly possible that most of the toss-up races will break in the same direction as the presidential race, Senate races can be quirky. Democrats got a mixed set of results in 2018, for example, picking up seats in Arizona and Nevada — but also seeing four of their incumbents lose.
One thing Democrats don’t have to worry about: If they pick up the Senate, it’s very likely that they’ll have retained the House, too; Republicans are starting out with a big deficit there and are playing at least as much defense as offense. There are scenarios where Republicans could win the House, but they involve the national climate unexpectedly turning into a Republcian landslide, in which case Democrats won’t be competitive in the Senate anyway. But we’ll discuss that more when we release our House forecast. In the meantime, please drop us a line if you have any questions about the Senate.
Nate Silver's Blog

- Nate Silver's profile
- 730 followers

