
Conor Jordan's Blog
June 20, 2023
Is learning Microsoft Excel worth it?
 What is Excel?
Excel is a spreadsheet application used to calculate figures, format numbers, and represent data visually. The application can make working with large amounts of information easier and more efficient.
Information is displayed in horizontal rows and vertical columns in a worksheet. Workbooks contain several worksheets in a spreadsheet file. Formulas are often used to produce answers from otherwise difficult calculations. You can organise vast amounts of data and show it in an easily identifiable way making collaboration between you and others more effective.
Excel is used for budgets, cash flows and accounting. This spreadsheet app can update figures without you having to make repeated calculations. Its usability and versatility makes performing repetitive tasks simpler. Excel can also convey information visually in the form of charts, graphs and tables.

What can Excel do for me?
This useful application can help you:
Organise information and data in a user friendly way Calculate budgets using financial and mathematical formulas Display data using visually appealing charts and graphs Apply formatting to information making data easier to view Summarise information using scenarios, outlines, and pivot tablesThese are just some of the ways Excel can make working with data easier.

How can I learn Excel?
There are many ways you can learn how to use Excel.
Here are a few suggestions:
Try out a course that teaches Excel. There are many available in-person and online Get a guide book to help you along the way Learn from how-to videos that show you learn using step-by-step instructions Practice with spreadsheet practice filesWho may find Excel useful?
 Students Self-employed Employees ICT Professionals
What are some of the benefits of learning Excel?
Higher earning potential for learners who gain a qualification such as ICDL or ICDL Professional Improved career prospects in a range of fields such as administration, finance, and accounting Learn how to manage finances using household budgeting
Workplace Advantages of Excel
Here are some potential workplace advantages of using Excel: Improved efficiency in day-to-day tasks Enhanced collaboration with others Makes calculating large amounts of data easier Presents information in an easy to understand waySummary
Excel is a versatile application that can improve productivity, perform complex calculations quickly, and presents information in an easily identifiable way. Many people can benefit from mastering spreadsheets and learning techniques to calculate and display information in a visually appealing way There are many advantages when it comes to learning Excel for employees, the self-employed, students and ICT specialists People can learn Excel in different ways such as through doing courses, getting a guide book, follow how-to videos, and learning online Gaining an accredited qualification in Excel can help improve career prospects and potentially have a higher earning potentialSubscribe to my newsletter to find out more hints, tips, and tricks about Excel and other Microsoft applications.


March 20, 2023
What is ICDL and ICDL Professional?
What is ICDL?
International Computer Driving License (ICDL) is the new name for European Computer Driving License (ECDL). ICDL Workforce is the qualification that includes modules such as Word Processing, Spreadsheets, and Presentations using Microsoft Word, Excel, and PowerPoint. It is a globally recognised qualification that can help you learn Microsoft 365 office applications.
What is ICDL Professional?
The ICDL Professional qualification is a range of digital skills modules allowing you to progress to a more advanced level of understanding using Microsoft 365 office applications. It follows on from the ICDL Workforce modules and improves on your existing knowledge of Microsoft Word, Excel, PowerPoint and Access. Participants build a learner profile using any combination of topics covered including Advanced Word Processing, Spreadsheets, Presentations, and Databases.
Is it Advanced ECDL?
The modules, formerly known as Advanced European Computer Driving Licence (Advanced ECDL), which used Microsoft Word, Excel, PowerPoint, and Access, have now become part of the ICDL Professional series of computer modules. At the time of writing, there are fifteen separate modules, with a new e-commerce module soon to become available.
What can it lead to?
You can develop skills that apply to a wide range of positions in the financial services industry, manufacturing, healthcare and legal firms for example. Whether you are working in areas such as accountancy, administration, or other office-based roles, you can benefit from an ICDL Professional qualification.
Who can use the books?
You can use the ICDL Professional books to learn more advanced features of the Microsoft 365 applications. It is advisable that you learn ICDL Workforce modules before going on to learn about ICDL Professional modules.
What can you do with the books?
You can use the books as a user-friendly, unofficial companion guide to ICDL Professional modules. Learn advanced Microsoft Word, Excel, PowerPoint and Access techniques at home, in your own time, at your own pace, or use them as a reference guide at home, college, or work.
June 14, 2022
What is ICDL?

What is ICDL?
International Computer Driving License (ICDL) is the new name for European Computer Driving License (ECDL). ICDL Workforce is the qualification that includes modules for such as Word Processing, Spreadsheets, and Presentations using Microsoft Word, Excel, and PowerPoint. It is a globally recognised qualification that can help you learn computer office applications.
What are the ICDL books for?
The books are unofficial companion guides you can use to learn Microsoft Word, Excel & PowerPoint. They provide step-by-step lessons in separate sections with revision exercises after each part. They can be used to prepare for ICDL Workforce exams as a reference book.
What are the downloads for?
They save time with prepared files for each lesson and revision sections. Accompanying practice files are available to download from www.conorjordanbooks.com/downloads. Click on the book cover image you have to download the associated work files.
What can it lead to?
You can use the books to enhance career prospects in roles such as receptionist, secretary, office-based positions, and accountancy. You can progress to more advanced modules as part of the ICDL Professional qualification explained below.
Who can use the books?
Anyone who wants to learn the basics of Word, Excel, and PowerPoint can get ICDL Workforce book modules.
What can you do with the books?
You can use the books to learn how to use Microsoft Word, Excel and PowerPoint at home, in your own time, at your own pace, or use them as a reference guide.
What is ICDL Professional?
ICDL Professional is a collection of digital skills modules for anyone who wants to improve their career prospects by learning advanced features of office applications on computers. Participants build a learner profile using any combination of topics covered including Advanced Word Processing, Management Spreadsheets, Presentations, and Databases.
Is it Advanced ECDL?
The modules, formerly known as Advanced European Computer Driving Licence (ECDL), which covered Microsoft Word, Excel, PowerPoint, and Access, have now become part of the ICDL Professional series of computer modules. At the time of writing, there are fifteen separate modules, with a new e-commerce module soon to become available.
What can it lead to?
You can develop skills that apply to a wide range of positions in the financial services industry, manufacturing, healthcare and legal firms for example. Roles in accountancy, administration, information clerks, business analysts, receptionists, secretaries and marketing personnel can benefit from ICDL Professional qualifications.
Who can use the books?
Anyone who wants to learn advanced features of office applications including Microsoft Word, Excel, PowerPoint and Access.
What can you do with the books?
Readers can use the books as a user-friendly, companion guide to ICDL Professional modules, learn how to use Microsoft Word, Excel, PowerPoint and Access in their own time, at their own pace, or use them as a reference guide at home, college, or work. Accompanying practice files are available to download from www.conorjordanbooks.com/downloads. Click on the book cover image to download the associated work files.
Support and feedback
Readers can receive support on any of the topics covered by email at conorjordan@gmail.com
Or sign up for my newsletter at www.conorjordanbooks.com.
If you enjoyed any of the topics covered or found the information provided helpful, please feel free to leave a review.
May 19, 2022
Advanced Find and Replace

Have you ever completed a manuscript and realised that you wanted to change the name of a character in your novel? Or maybe you wanted to change the name of a place or location in your story but found the task overwhelming? Advanced find and replace features enable you to search a document according to specified criteria. This includes finding and replacing words, names and places beginning with specific letters and text formatted with uppercase text.
1. Open the document containing your novel
2. On the Home tab in the Editing group, click on Replace
3. Click on More
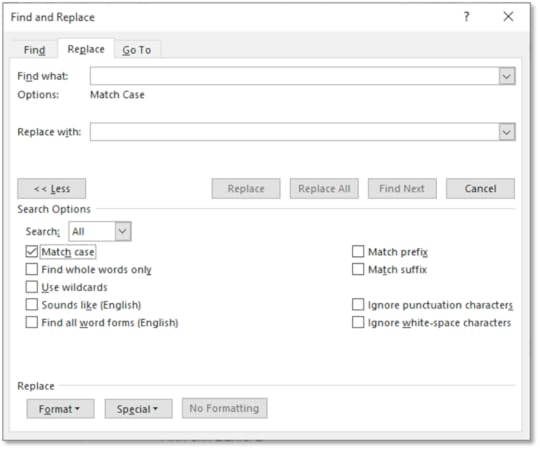
4. Click on the Match Case checkbox
5. In the Find What text box type in the name of your character without a capital letter
6. In the Replace With text box type in the name you want to replace it with
7. Click on Replace All
8. The search will only find a match that has the same Sentence Case lettering
9. On the Home tab in the Editing group, click on Replace
10. Click on More
11. Click on the Use Wildcards checkbox
12. Type in an Asterix (Press the Shift key and the number Eight key together on your keyboard) followed by the letters containing your character or place name for example, *fieldland will find all the instances of words ending in “fieldland”
13. In the Replace With text box type in the name you want to replace it with e.g. type in farmland to replace all occurrences of wheatfieldland in your novel
14. Save the document
May 13, 2022
Data Validation in Excel

Data validation can reduce the risk of errors occurring in a worksheet. Data validation restricts information entry into cells prompting the worksheet user to enter the correct information. It applies restrictions to forms or templates that can accept input in some cells.
Spreadsheet files accompanying this post can be downloaded at www.digidiscover.com/downloads
1. Open the workbook Data Validation
2. Highlight cells B4:B10
3. On the Data tab in the Data Tools group, select Data Validation
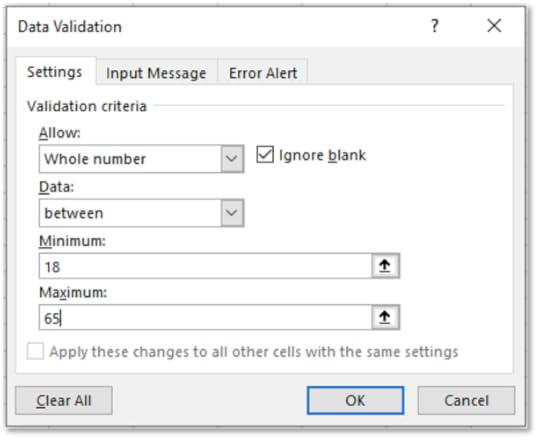
4. Allow Whole Numbers
5. For Data choose Between
6. For Minimum enter 18 and Maximum 65
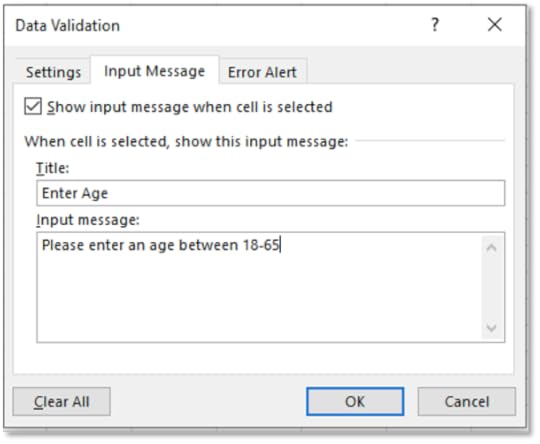
7. On the Input Message tab, type in Enter Age for Title
8. In Input Message enter Please enter an age between 18-65
9. On the Error Alert tab, for Style, choose Information
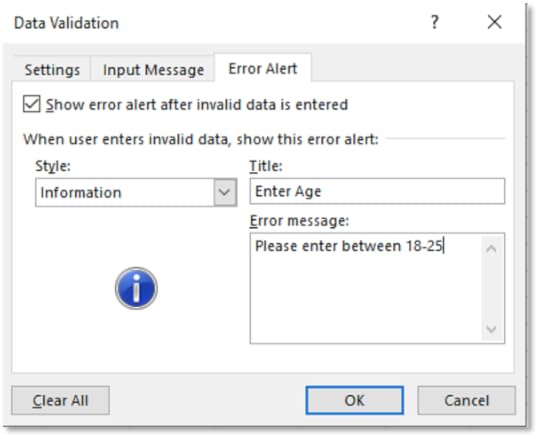
10. On the Error Alert tab, for Style, choose Information
11. For Title type in Enter Age
12. For Error Message type, Please enter between 18-25
13. Click OK
14. Try and type 70 for cell B7
15. The Error Message will appear
16. Click OK
17. On the Data tab in the Data Tools group, select the arrow beside Data Validation
18. Choose Circle Invalid Data
19. It will circle all data that does not follow the Data Validation settings
20. On the Data tab, select the arrow beside Data Validation
21. Choose Clear Validation Circles
22. It removes data circles in the worksheet
23. On the Data tab, choose Data Validation
24. In the Data Validation dialog box, click on the Clear All button
25. Click OK
26. It removes data validation from the worksheet
27. Highlight cells D4:D10
28. On the Data tab, select Data Validation
29. Under Validation Criteria for Allow choose List
30. Click in the Source textbox and select cells A12:A14
31. Type in an Input Message Title of Enter Department
32. Include an Input Message of Choose the correct department
33. Include a Warning style prompt with the same Title and Message as the Input Message
34. Click OK
35. Click on cell D4
36. There is now a drop-down list containing department names for the cells D4:D10
37. Choose the Admin department for cell D4
38. Highlight cells H4:H10
39. Select Data Validation and for Allow choose Decimal
40. Allow values Between a Minimum of 18500 and a Maximum of 23000
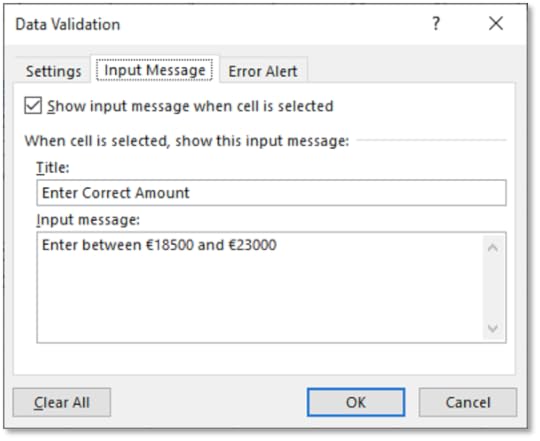
41. Enter an Input Message of Enter Correct Amount for the Title and Enter between €18500 and €23000 for the Input Message
42. Enter the same Title and Input Message for the Error Alert and choose a Style of Stop
43. Click OK
44. Try and enter a value of €18000 into cell H5. A dialog prompt appears. Click on Retry
45. Now enter a value of €19500. It is allowed
46. Highlight cells I4:I10
47. Select Data Validation and for Allow choose Date
48. Allow a date that is Less than or Equal to 31/12/1980
49. Only dates of birth that are before this date are allowed
50. Enter in an appropriate Input Message and Error Alert
51. Click OK
52. Try entering a birth date in cell I4 after 31/12/1980
53. Excel will prompt you to change the date
54. Enter in the date 3/1/1979
55. The date entry is allowed
56. Select the cell range J4:J10
57. Display the Data Validation dialog box
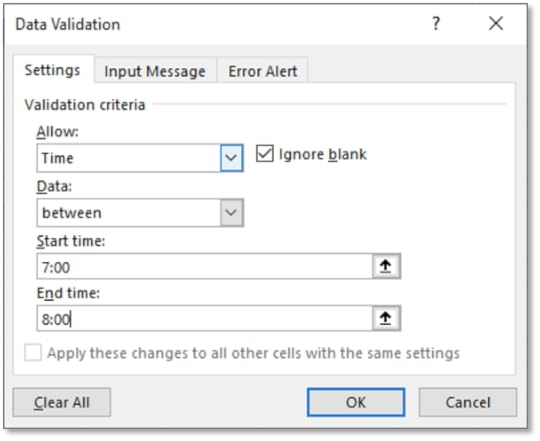
58. For Allow choose Time
59. On the Settings tab, enter in a Start Time of 7:00
60. Enter in an End Time of 8:00
61. Enter in an appropriate Input Message and Error Alert
62. Click OK
63. In cell J4 enter in 9:00
64. It will not be allowed, and Excel prompts you to enter the correct time
65. Enter 7:30
66. It is allowed
67. Save the workbook and leave it open
May 12, 2022
Reports in Microsoft Access
Calculated Controls
Calculated fields in a report show percentages and display currency. These fields can display the value of each detail line as a percentage of the report total. You can apply currency formatting to financial fields. It is useful when you want to show formatting relevant to your report.
For example, in a financial report for an organisation, sales figures can be represented by percentages of the annual revenue. Currency formatting can be applied to display sales totals in a chosen currency.
Database files for this post can be downloaded from ,www.digidiscover.com/downloads
Click on the Advanced Database book cover to download the work files
1. Open the Digital Skills Courses database
2. Open the Courses report
3. View the report in Design View
4. On the Report Design tab, click on Group & Sort
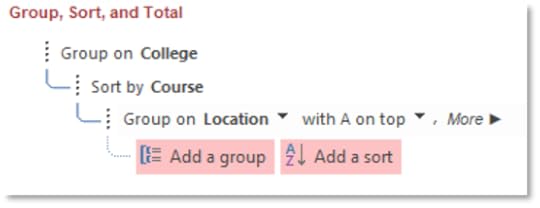
5. At the bottom of the window, notice that the form is grouped by College and sorted by Course
6. Choose to group by Location
7. Then Sort by College
8. Then Sort by Price from Largest to Smallest
9. View the form in Form View
10. Enlarge the Report Footer
11. In the Controls group, click on Text Box
12. Create the Text Box beneath the Page Number text box
13. Type in the following calculation:
=sum([Price])
14. Change the label to read Total Price
15. On the Property Sheet pane, change the format of the Total Price text box to Euro
16. Change the number of decimal places to One for the Total Price text box
17. Create another textbox beneath the Total Price text box
18. Type in the following calculation:
=count([Course])
19. Give the text box a label of No. of Courses
20. Align the Total Price and Report View text boxes
21. Return to Report View
22. Notice the calculations in the Report Footer
23. Return to Design View and create another Text Box beneath the No. of Courses calculation
24. Type in the following calculation:
=Avg([Price])
25. It will find the average price of courses provided
26. Apply a Euro currency to the average course price with No Decimal Places
27. Label the text box Average Course Price
28. Return to Report View
29. Notice the calculations at the bottom of the report
30. Save the report and close it
May 11, 2022
Flowcharts in Microsoft PowerPoint

A flowchart is a visual representation of the hierarchy within an organisation. A flowchart displays managerial positions towards the top and subordinate positions below. Positions next to each other hold the same ranking in an organisation, e.g. administrative positions.
1. Open a Blank Slideshow
2. Change the Layout of the first slide to Title and Content
3. Enter the title Sales Department and centre it
4. Select the Content box
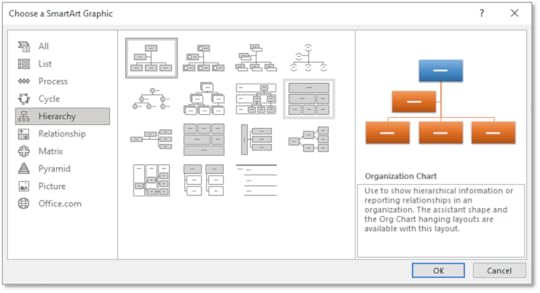
5. On the Insert tab in the Illustrations group, select Smart Art and choose Hierarchy
6. Select Organisation Chart
7. Click OK
8. Delete the Shape on the Second Level of the hierarchy with the Backspace key
9. Delete one of the Shapes on the Bottom Level of the hierarchy with the Backspace key
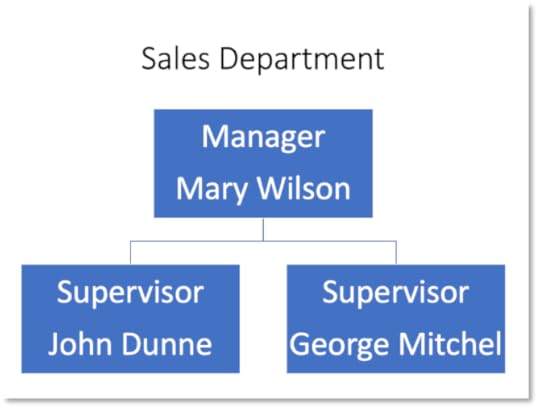
10. Fill in the following information into the flowchart:
Top Process Shape Manager - Mary Wilson
Bottom Left Alternate Process Supervisor - John Dunne
Bottom Right Alternate Process Supervisor - George Mitchel
11. It has created a flowchart representing the hierarchy within the company
12. Save the slideshow as Flowchart and leave it open
Manipulating Shapes
You can adjust shapes to present the information in a flowchart. It is helpful to use an efficient way to represent the hierarchy within an organization or department. You can change the connections between objects in a flowchart to suit the style of the flowchart.
1. Open the Flowchart slideshow
2. Select the Supervisor – John Dunne shape
3. On the SmartArt Design tab in the Create Graphic group, select the arrow beside the Add Shape button and select Add Shape After
4. Select the shape and on the SmartArt Design tab in the Create Graphic group, select Text Pane
5. Include the title of Sales Assistant Fiona Jones for the new shape
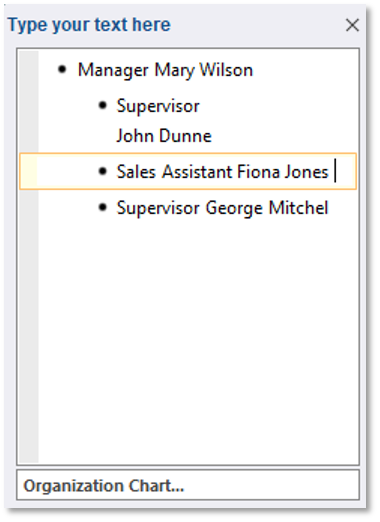
6. Close the Text Pane
7. On the SmartArt Design tab in the Create Graphic group, select Demote
8. It has demoted the Sales Assistant
9. On the SmartArt Design tab, in the Create Graphic group, select Right to Left
10. Fiona Jones is now a subordinate to the Supervisor John Dunne
11. Select the Manager Mary Wilson
12. On the SmartArt Design tab, in the Create Graphic group, select the arrow beside the Add Shape button and choose Add Assistant
13. Right-click on the blank shape and select Edit Text
14. Type in Personal Assistant – Michael Smith
15. Select the shape representing George Mitchel
16. On the SmartArt Design tab, in the Create Graphic group, select the arrow beside the Add Shape button and select Add Shape Below
17. Right-click on the shape and choose Edit Text
18. Enter Sales Assistant – Mark Breen
19. Select the entire organisational chart
20. On the SmartArt Design tab, in the Create Graphic group, select Layout and choose Standard
21. Change the Font to Bold for each position in the hierarchy
22. The Organisation Hierarchy should look like this:
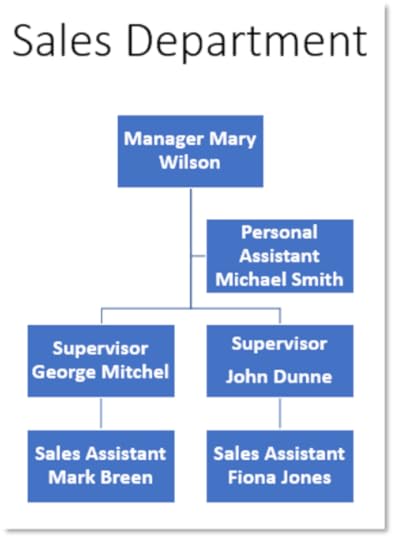
23. Save the presentation and close it
May 10, 2022
Pivot Tables

,Pivot Tables
Pivot Tables arrange and summarise data from a table that has labelled columns. Usually, two fields from the data mark the column and row headings. The table represents information in different ways.
For instance, if you have a table of staff details with headings, a pivot table compares pay rates for staff working in different departments. Pivot Tables summarise information, e.g., finding the number of people working in a particular department with specific salaries. The values can be added together, counted, and averaged.
The work files associated with this can be downloaded at ,www.digidiscover.com/downloads. Click on the Management Spreadsheets book cover to download the files.
1. Open the workbook Staff List
2. Click inside the table
3. On the Insert tab, locate the Tables group, select Pivot Table
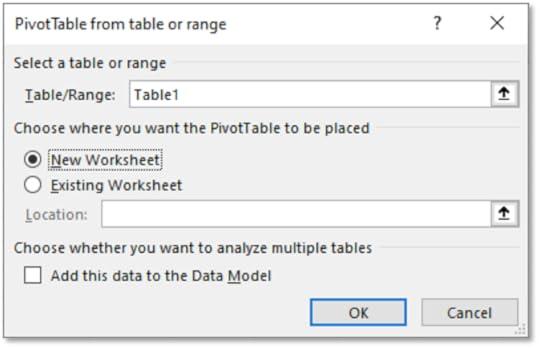
4. For Choose where to place the Pivot Table, click on New Worksheet
5. In the Create Pivot Table dialog box, click on OK
6. Name the worksheet as PivotTable
7. On the Pivot Table Fields pane, click and drag First Name to Rows, Department to Columns and Gender toValues
8. The Pivot Table will give a summary of employee genders by department
9. Switch First Name to Columns and Department to Rows
10. The Pivot Table shows employee names along the top and departments along the right
11. Click & drag First Name to Values and move Gender to Columns
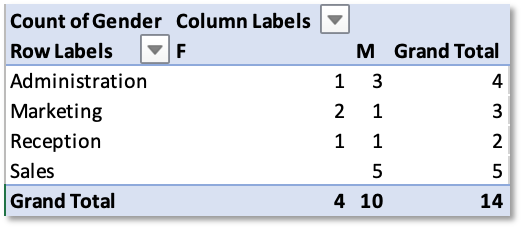
12. The PivotTable now displays a summary of Employees in each Department based on Gender
13. Save the workbook and leave it open
Modify the Data Source
The information for the Pivot Table updates to reflect any changes made to the original data. For instance, if there are updates to salaries for employees, the data can be changed in the original table and updated in the Pivot Table
1. Open the workbook Staff List
2. Return to the Staff List worksheet and enter the following details:
James, Smith, M, 15/04/1975, Waterfront, Administration
3. Return to the PivotTable worksheet
4. On the Pivot Table Analyse tab, select Refresh
5. The Pivot Table updates
6. Return to the Staff worksheet and delete the added entry from the table
7. On the Pivot Table Analyse tab in the Data group, select Refresh
8. The Pivot Table updates to include the additional entry
9. Save the workbook and leave it open
Filter & Sort a Pivot Table
A filter in a Pivot Table can show separate categories. The table displays only required information, e.g. the average salary for employees in the marketing department. You can sort details such as surnames in ascending or descending alphabetical order.
1. Open the workbook Staff List
2. Click on the arrow beside the Row Labels heading
3. Click on the Select All checkbox to deselect the different departments
4. Select the Sales checkbox and click OK
5. It filters the table displaying employees in the Sales department
6. Click on the Row Labels arrow again and click on Select All and click OK
7. This setting shows all the employees working in each department
8. Click on the arrow beside the Row Labels heading
9. Sort the Row Labels by clicking on Sort A to Z
10. The list is sorted in alphabetical order by Department
11. Click on the Row Labels arrow and hover over Label Filters
12. Select Equals
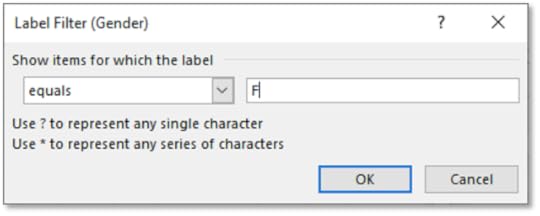
13. Enter F for the Label Filter value
14. Click OK
15. It sorts the table by Department in Ascending Order for Female employees
16. Save the workbook and close it
May 9, 2022
Find and Replace in Microsoft Word

Advanced find and replace features enable you to search a document according to specified criteria. This includes finding and replacing whole words, text formatted with uppercase text, types of font and paragraph styles. The find and replace function can also find paragraph formatting such as paragraph marks (when the Enter key is pressed for a new paragraph) and indenting (when the tab key is pressed).
1. Open a document containing several paragraphs and pages
2. On the Home tab, in the Editing group, click on Replace
3. Click on More

4. Click on the Match Case check box
5. In the Find What text box, type in the word you want to find
6. In the Replace With text box, type in the word you want to replace it with
7. Click on Replace All
8. The search will only find a match that has the same lowercase lettering
9. Save the document and leave it open
Whole words in a document can be found and replaced with other whole words. This is useful if you want to find an exact match of a word in a document and replace it with another. For example, you can search a document for the word “Chapter” and replace every occurrence of that word with “Section”.
1. Display the Find and Replace dialog box
2. In the Find What text box, type in the word you want to find
3. In the Replace With text box, type in the word you want to replace it with
4. Select the Find Whole Words Only check box
5. Click on Replace All
6. Save the document and leave it open
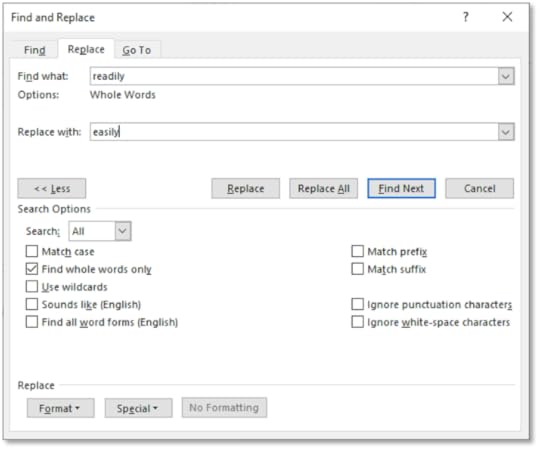
Documents can be searched for specific font types and replaced with a different kind of font. This is an efficient way of changing fonts within a document and can save time when performing repetitive tasks. For instance, you may want to replace all the Times New Roman formatted text with an Arial formatted text without changing anything else. This can be achieved using the replacing types of font feature.
1. In the Advanced Find and Replace dialog box, under Find, click on Format then Font
2. On the Font tab, choose Times New Roman
3. Click OK
4. In the Find What text box, type in the word or phrase you want to find
5. In the Replace With text box, type in the word or phrase you want to replace it with
6. Click on Replace All
7. Only text that is in the Times New Roman font will be replaced
8. Click on the No Formatting button to remove the format
9. Save the document
When you press the Enter key, paragraph marks appear if the Show/Hide feature is active. Paragraph marks can be replaced with alternative marks such as indents or page breaks. For instance, you may want to replace each paragraph mark with a page break so that paragraphs appear on separate pages rather than together on the same page.
1. Open a document containing paragraph marks
2. In the Find and Replace dialog box, under Find, click on the Special button then Paragraph Mark
3. Click on Find Next
4. Word will search for any paragraph marks in the text
5. Click inside the Replace With text box
6. Select the Special button, then choose Manual Page Break
7. Click on Replace All
8. This will replace paragraph marks with page breaks throughout the document. Each paragraph will be placed on separate pages.
9. Save the document and close it
May 6, 2022
Microsoft Access & Databases

Databases store and access data in many ways. For example, companies use databases containing price and product information on an e-commerce site. Website content management systems allow database users to make changes to web content without having technical knowledge. Databases help businesses involved in distribution, logistics, shipping, and inventories. For example, a company may want to store customer data, such as contact details and home addresses, to be modified and updated.
Hierarchal databases are similar to a tree structure with records stored in groups of master and subordinate relationships. There may be a high priority table, e.g. containing customer details and relationships between many subordinate product tables. This model is fast and straightforward to use but only has one-to-many relationships.
Relational databases have data organised in a series of related tables. This type of database is easy to create, add to, and access. Companies use relational databases to manage employee details for different departments, such as employee name, salary, and department details. These details may be related to salary tables and managerial data sets.
Object-orientated databases have data represented by objects. Not all these models support Structured Query Language. SQL is a language used in Microsoft Access when it runs Queries.
Stage 1 – Design
The design must be clear and easy to understand. Consider the purpose of the database. How will it output data? What will the result of the database be? How will it serve the needs of the people who access it?
Stage 2 – Creation
Creation involves developing tables, relationships, forms, queries, and reports. This process needs careful attention to ensure a clear understanding of the links between tables and the output of selected databases.
Stage 3 – Data Entry
This stage involves entering information into a database. Data entry is a long, labour-intensive process and requires a skilled user. There are many features in Microsoft Access that can limit the chance of errors occurring, such as data validation methods that only allow specific information entry and input masks where data entered must be of a particular format.
Stage 4 – Data Maintenance
Data maintenance involves adding new information and removing unnecessary data from a database to make it more efficient. This process develops continually as information changes, e.g. contact details of customers or product updates.
Stage 5 – Information Retrieval
Information is retrieved and organised using queries, forms, and reports. Users may only be allowed to use sections of a database because of restrictions.
Databases serve the purpose of dynamic websites where data is retrieved and updated for information such as product details or prices. Databases manage mailing lists where e-mail details are stored. These databases can then be updated when contact details change.
For instance, when a customer enters contact details such as name, address, e-mail, and date of birth into a shopping website, this data is automatically retrieved and updated using company databases. This information relates to products purchased by that customer and is stored in the organisation's databases.
Website content management systems use databases where users without technical skills can edit information, e.g. product sales details. The user may input data without having to know coding languages. It makes data entry more effective and efficient.
Customer Relationship Management Systems uses databases to store and retrieve customer details in an organisation. A company can use information such as name and address. This information can then be updated whenever customers' details change.
This system may apply to a hotel business, for instance, where staff members use an established content management system. A client database may store guests' contact details. Information about the amount charged, length of stay and room stayed in may also be included in separate tables. This information can then be changed and updated as different guests arrive and leave the hotel.
Enterprise Resource Planning Systems are used in organisations regularly to perform functions such as accounting or finance. This database type may project sales forecasts, develop a company's budget, or track a department's financial position within a company. For instance, the accounts department may use this type of database to calculate the profit or loss of a company in a given year.
Conor Jordan's Blog


