
Gennaro Cuofano's Blog, page 139
November 27, 2021
What Is A Requirements Traceability Matrix? Requirements Traceability Matrix In A Nutshell
A requirements traceability matrix (RTM) is a vital part of the lifecycle of any embedded system, helping organizations ensure their products are safe and meet intended standards. While the matrix has long been associated with medicine, technology, and engineering, the approach works well for any project regardless of industry. A requirements traceability matrix is a tool used to identify and maintain the status of project requirements and deliverables.
Understanding a requirements traceability matrixOrganizations use the RTM matrix to ensure project scope, requirements, and deliverables remain true to the established baseline. In most cases, this means documenting the links between the user requirements proposed by the client to the system being built. Each requirement is traced with a test case to ensure an adequate level of testing is accomplished.
The process of reviewing the test cases for each requirement is called traceability. This process in turn enables the organization to determine which requirements caused the most number of defects during a testing cycle. While this highlights areas for improvement, it also helps address process weaknesses and future roadblocks. What’s more, RTMs are used to counter the growing complexity seen in product development.
How to create a requirements traceability matrix
The needs of every business will be different, but most RTMs will have the following column headings for each requirement:
Requirement ID – a unique identifier given to each requirement so it can be easily traced over the project lifecycle. Category – where the requirement is classified into a broad category such as functional, non-functional, security, performance, usability, and so forth.Priority – teams can use a low-medium-high scale or use mandatory, should have, and nice to have. Source – the name of the stakeholder who identified the requirement.Business objective – or the objective the requirement will help the business meet. This typically comes from the project charter or business case.Deliverables – here, list the deliverables that comprise the requirement. Verification – how will each requirement be tested satisfactorily? In software development, verification may depend on 99.9% uptime. Validation – detailing how the requirement will be validated or tested. This is usually via user acceptance tests, achieving milestones, or meeting KPIs.Most RTMs can be created in an Excel spreadsheet. However, businesses can also use requirements management tools such as Visure Requirements, Modern Requirements4DevOps, and ReQtest.
Various types of requirements traceability matricesThere are three different types of RTMs according to the traceability strategy used:
Forward traceability – these matrices map the requirements to the test cases and ensure the project progresses in the desired direction via thorough testing. Backward traceability – in contrast, these matrices map the test cases to the user requirements. This helps the project team avoid scope creep.Bidirectional traceability – essentially, a combination of forward and backward traceability. The most robust RTMs incorporate bidirectional traceability because it establishes a relationship between two artifacts that can be traced from one to the next and back again. Ideally, the business should also be able to trace back from requirements to business goals to answer why the requirement exists in the first instance.Key takeaways:A requirements traceability matrix is a tool used to identify and maintain the status of project requirements and deliverables. Organizations use the RTM matrix to ensure project scope, requirements, and deliverables remain true to an established baseline.A requirements traceability matrix can be created by using a spreadsheet or dedicated requirements management software. Each requirement should have information pertaining to a unique identifier, category, priority, source, business objective, deliverables, verification, and validation.There are three types of requirements traceability matrix depending on the traceability approach used: forward, backward, and bidirectional. Most businesses prefer bidirectional RTMs because they are more robust.Main Free Guides:
Business ModelsBusiness StrategyBusiness DevelopmentDigital Business ModelsDistribution ChannelsMarketing StrategyPlatform Business ModelsRevenue ModelsTech Business ModelsBlockchain Business Models FrameworkThe post What Is A Requirements Traceability Matrix? Requirements Traceability Matrix In A Nutshell appeared first on FourWeekMBA.


What Is The Herfindahl-Hirschman Index? Herfindahl-Hirschman Index In A Nuthell
The Herfindahl-Hirschman Index (HHI) is a measure of the market concentration of an industry. The index is used to determine market competitiveness and is sometimes before and after a merger or acquisition.
Understanding the Herfindahl-Hirschman IndexThe Herfindahl-Hirschman Index was named after American economists Orris C. Herfindahl and Albert O. Hirschman. The index was originally invented by Hirschman in 1945. However, a similar model was proposed by Herfindahl in a 1950 doctoral dissertation on the steel industry while studying at Columbia University.
The Herfindahl-Hirschman Index measures the market concentration of an industry. In a highly concentrated industry, a few companies hold most of the market share with either of them able to form a monopoly. In an industry characterized by low concentration, many more firms of similar size hold an equally similar market share.
The index is also used to monitor the impact of mergers and acquisitions on an industry. Regulators can cite quantitative index data to veto any merger or acquisition they deem to be anti-competitive. By the same token, companies involved in the transaction can also use data to suggest the move would not lead to a monopolistic market.
Calculating the HHICalculating the HHI involves squaring each market share value to place more importance on the companies with more of the market. Each market share value is then summed.
The formula for determining the HHI is as follows:
HHI = MS12 + MS22 + MS32 + MS42 … + MSn2
The HHI value can fall anywhere between close to zero and 10,000. A value approaching zero might be possible when there are so many market players that their individual share of the market is very small. Conversely, a score near 10,000 would result in a market where one company had close to 100% market share.
The categorization of HHI values is somewhat subjective and many industry bodies use their own scale. With that said, here is the scale used by the U.S. Department of Justice when deciding whether to permit a merger between two companies:
Highly competitive – for values under 100.Not concentrated – for values between 100 and 1000.Moderately concentrated – for values between 1000 and 1800.Highly concentrated – for values above 1800.Limitations of the Herfindahl-Hirschman IndexLike concentration ratios, the Herfindahl-Hirschman Index is rather simplistic, lacks nuance, and may fail to properly account for market complexities.
For example, an industry with six supermarkets taking 15% of the market share would appear to be non-monopolistic. Upon closer inspection, however, one supermarket has 85% of the online shopping market while another controls 90% of liquor sales. Since online shopping and liquor sales are part of the same retail industry, the results are inaccurate. The Herfindahl-Hirschman Index fails here because it does not consider the complex nature of markets.
What’s more, the index does not account for the geographical scope of a market. Three logistics firms with 15% of the market each may occupy three different regions and thus not compete. Determining the scope of the market has, in some industries, been made more difficult by globalization.
Key takeaways:The Herfindahl-Hirschman Index is a measure of the market concentration of an industry. The index is used to determine market competitiveness and is sometimes used before and after a merger or acquisition.The Herfindahl-Hirschman Index is calculated by summing the square of the market share of each company in an industry. Scores near zero indicate many companies in a competitive environment, while scores near the maximum of 10,000 mean the market is dominated by a single company.The Herfindahl-Hirschman Index lacks nuance, particularly in complex industries with many subsectors. Like concentration ratios, the HHI index also fails to account for the geographic scope of a market.Connected frameworks to assess competitiveness of a market In his book, “Competitive Advantage,” in 1985, Porter conceptualized the concept of competitive advantage, by looking at two key aspects. Industry attractiveness, and the company’s strategic positioning. The latter, according to Porter, can be achieved either via cost leadership, differentiation, or focus.
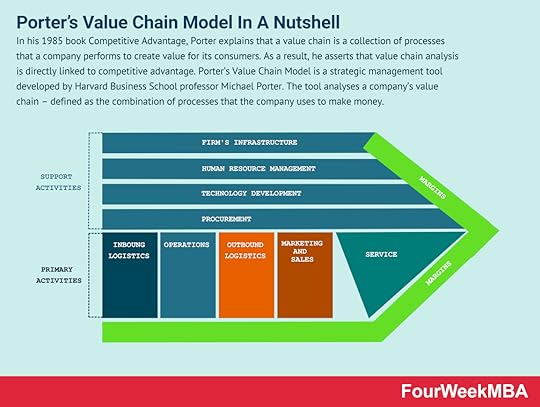 In his 1985 book Competitive Advantage, Porter explains that a value chain is a collection of processes that a company performs to create value for its consumers. As a result, he asserts that value chain analysis is directly linked to competitive advantage. Porter’s Value Chain Model is a strategic management tool developed by Harvard Business School professor Michael Porter. The tool analyses a company’s value chain – defined as the combination of processes that the company uses to make money.
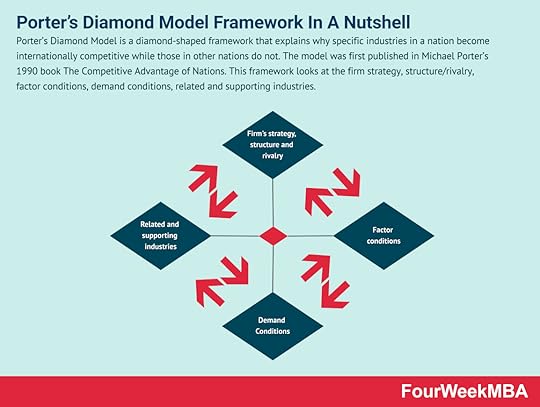 Porter’s Diamond Model is a diamond-shaped framework that explains why specific industries in a nation become internationally competitive while those in other nations do not. The model was first published in Michael Porter’s 1990 book The Competitive Advantage of Nations. This framework looks at the firm strategy, structure/rivalry, factor conditions, demand conditions, related and supporting industries.
Porter’s Four Corners Analysis
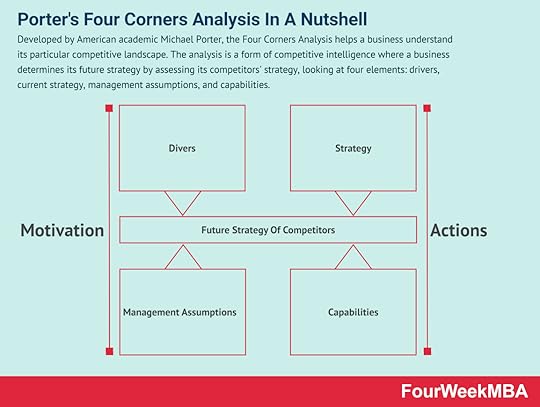 Developed by American academic Michael Porter, the Four Corners Analysis helps a business understand its particular competitive landscape. The analysis is a form of competitive intelligence where a business determines its future strategy by assessing its competitors’ strategy, looking at four elements: drivers, current strategy, management assumptions, and capabilities.
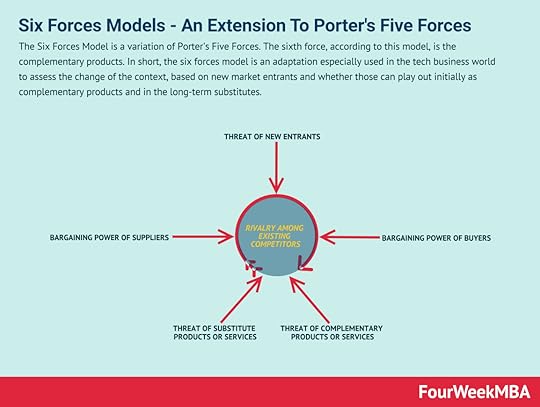 The Six Forces Model is a variation of Porter’s Five Forces. The sixth force, according to this model, is the complementary products. In short, the six forces model is an adaptation especially used in the tech business world to assess the change of the context, based on new market entrants and whether those can play out initially as complementary products and in the long-term substitutes.
Main Free Guides:
Business ModelsBusiness StrategyBusiness DevelopmentDigital Business ModelsDistribution ChannelsMarketing StrategyPlatform Business ModelsRevenue ModelsTech Business ModelsBlockchain Business Models FrameworkThe post What Is The Herfindahl-Hirschman Index? Herfindahl-Hirschman Index In A Nuthell appeared first on FourWeekMBA.
What Is The Peer-To-Peer Economy? Peer-To-Peer Economy In A Nutshell
The peer-to-peer (P2P) economy is one where buyers and sellers interact directly without the need for an intermediary third party or other business. The peer-to-peer economy is a business model where two individuals buy and sell products and services directly. In a peer-to-peer company, the seller has the ability to create the product or offer the service themselves.
Understanding a peer-to-peer economyThe peer-to-peer company is seen as an alternative to traditional capitalist markets, where businesses control goods production and own the finished product. These businesses act as intermediaries, employing workers to carry out the production process and then selling the finished goods to consumers.
It should be noted that a peer-to-peer economy can exist within a traditional capitalist market. For example, open-source software is sold alongside commercial and retail software. Uber operates in large cities with taxi companies, while several Airbnb properties may be available on the same block as a hotel. Many consider Uber and Airbnb to be operating in a quasi-peer-to-peer economy since each provides the intermediary service of payment processing. However, using a third party to provide this service is sometimes unavoidable and should not be used as the sole determinant of a peer-to-peer economy.
The growth of the peer-to-peer economy has been fuelled by the internet, mobile technologies, and tremendous advances in analytics, artificial intelligence, and big data. These factors have made transactions between individuals more accessible, efficient, and safe. Changing consumer preferences toward a sharing economy have also spawned multiple industries where intermediaries are simply no longer required.
Peer-to-peer economy platformsIn a peer-to-peer economy, various platforms connect buyer demand with seller supply.
These platforms are normally for-profit entities that provide payment services and mitigate the risk of the buyer failing to pay or the seller failing to deliver.
Examples of peer-to-peer platforms include:
Marketplaces – eBay, Etsy, Gumtree, and to a lesser extent Amazon.Payment facilitators – such as PayPal, Stripe, and Square.Personal lending services – including Peerform, Upstart, Kiva, and Prosper.Transportation – Uber, Lyft, Ola, and DiDi.Some platforms also incorporate aspects of the sharing economy, where peer-to-peer transactions enable online communities to acquire or provide shared access to goods and services. These communities utilize idle assets such as spare bedrooms or vehicles through fee-based sharing arrangements.
Sharing economy platforms have allowed the peer-to-peer economy to thrive. They include:
Fashion – such as Nuw, The Dress Change, Swap Society, Vinted, and ThredUp.Freelancing – Fiverr, Upwork, Guru, Airtasker, and 99designs. Accommodation – Airbnb, HomeToGo, Tripping, and VRBO.Transportation – in the peer-to-peer sharing economy, this includes carpool service BlaBlaCar, storage and car parking platform Spacer, and car-sharing service Zipcar. Software, knowledge, and media sharing – this includes Stack Overflow and educational platform Coursera.Item sharing – where consumers share power drills (Toolmates), toys (Kindershare), and caravans and similar recreational vehicles (Camplify). The evolution of the peer-to-peer economyThe peer-to-peer economy of today is similar to the environment that existed before the industrial revolution. During this time, most people worked either as subsistence farmers or artisans making hand-crafted goods.
However, the introduction of machinery created economic systems that afforded greater productivity and wealth through economies of scale. Once large-scale agriculture become widespread, wealthy individuals bought village land once used by subsistence farmers. This forced villagers to find new jobs with businesses in towns and cities, thereby creating an economy dominated by intermediaries which continues to this day.
Will the peer-to-peer economy once again become the status quo? The internet has certainly made it a more viable prospect, with the self-producer model of capitalism disruptive enough to have caught the attention of third-party intermediaries. These companies have invested heavily in making P2P transactions safer and more efficient for buyers and sellers, despite having no direct involvement in the economy itself. If nothing else, these investments strengthen the case for a peer-to-peer economy well into the future.
Peer-to-peer business model examples A marketplace is a platform where buyers and sellers interact and transact. The platform acts as a marketplace that will generate revenues in fees from one or all the parties involved in the transaction. Usually, marketplaces can be classified in several ways, like those selling services vs. products or those connecting buyers and sellers at B2B, B2C, or C2C level. And those marketplaces connecting two core players, or more.
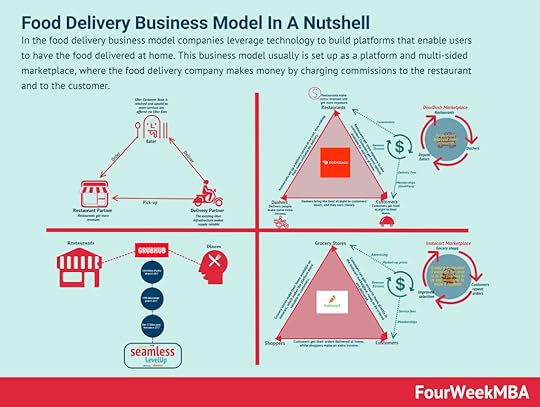 In the food delivery business model companies leverage technology to build platforms that enable users to have the food delivered at home. This business model usually is set up as a platform and multi-sided marketplace, where the food delivery company makes money by charging commissions to the restaurant and to the customer.
 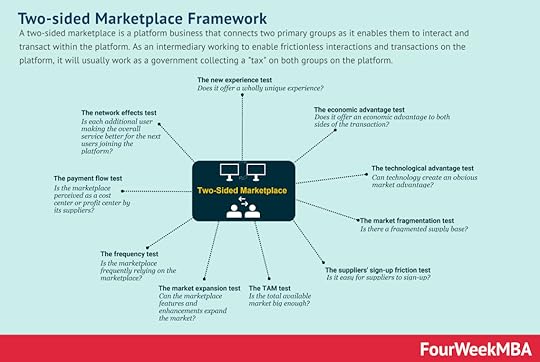 A two-sided marketplace is a platform business that connects two primary groups as it enables them to interact and transact within the platform. As an intermediary working to enable frictionless interactions and transactions on the platform, it will usually work as a government collecting a “tax” on both groups on the platform.
  Uber Eats is a three-sided marketplace connecting a driver, a restaurant owner and a customer with Uber Eats platform at the center. The three-sided marketplace moves around three players: Restaurants pay commission on the orders to Uber Eats; Customers pay the small delivery charges, and at times, cancellation fee; Drivers earn through making reliable deliveries on time.Key takeaways:The peer-to-peer (P2P) economy is one where buyers and sellers interact directly without the need for an intermediary third party or other business. The growth of the peer-to-peer economy has been fuelled by the internet, mobile technologies, analytics, artificial intelligence, and big data. The peer-to-peer economy consists of various platforms which connect buyer demand with seller supply. These platforms are operated by third-party businesses, ostensibly to reduce the risk of the buyer not paying or the selling not delivering. Sharing economy platforms, where communities provide access to shared goods and resources, are also an important component of the peer-to-peer economy.The peer-to-peer economy was prevalent before the industrial revolution, where most were employed as farmers or artisans. This changed with the introduction of farm machinery and economies of scale, but the peer-to-peer economy is making a comeback today and may become dominant once again.
Main Free Guides:
Business ModelsBusiness StrategyBusiness DevelopmentDigital Business ModelsDistribution ChannelsMarketing StrategyPlatform Business ModelsRevenue ModelsTech Business ModelsBlockchain Business Models FrameworkThe post What Is The Peer-To-Peer Economy? Peer-To-Peer Economy In A Nutshell appeared first on FourWeekMBA.
What Is Decision Analysis? Decision Analysis In A Nutshell
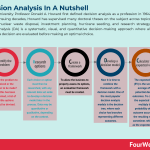
Stanford University Professor Ronald A. Howard first defined decision analysis as a profession in 1964. Over the ensuing decades, Howard has supervised many doctoral theses on the subject across topics including nuclear waste disposal, investment planning, hurricane seeding, and research strategy. Decision analysis (DA) is a systematic, visual, and quantitative decision-making approach where all aspects of a decision are evaluated before making an optimal choice.
Understanding decision analysisFundamentally, decision analysis enables organizations to evaluate or model the potential outcomes of various decisions so they can choose the one with the most favorable outcome. The tool assesses all relevant information and incorporates aspects of training, economics, psychology, and various management techniques.
Another part of decision analysis requires the business to examine uncertainty around a decision. Uncertainty is measured by probability. In other words, what are the chances the outcome will occur? From this point, the organization can make a decision based on the value and likelihood of success of a decision. Alternatively, it can base the decision on the likelihood of failure and its corresponding impact.
Decision analysis is extremely valuable in the project planning stage and during periodic reviews of project progress by senior management. Since most projects are characterized by decisions made with high uncertainty, decision analysis has multiple applications. For one, the analysis helps project teams obtain accurate activity duration estimates. Decision analysis also assists in risk analysis, “what-if” analysis, and subproject terminating in a research and development context.
How does decision analysis work?The decision analysis process can be explained in the following steps.
1 – Identify the problemWhat is the problem to be solved or the decision to be made?
Once this has been determined, a list of possible options should be devised. For instance, a non-profit that receives a large endowment may have several ways they can put the money to good use.
2 – Research optionsEach choice or option must then be researched, with any relevant data set aside to develop a decision model later in the process. Data may be quantitative or qualitative, depending on the context.
It is important to consider each outcome in terms of its costs, risks, benefits, and probability of success or failure.
3 – Create a frameworkTo allow the business to properly assess its options, an evaluation framework must be created.
One way to achieve this is by using key performance indicators (KPIs) to measure and indicate progress. For example, a business looking to expand may stipulate that each potential new market causes a minimum increase in monthly sales volume.
Like the research from the previous step, KPI data may be qualitative or quantitative.
4 – Develop a decision modelNow it is time to combine the framework with a decision model. One of the most popular decision analysis models is the decision tree, where each choice has branches representing different outcomes.
Influence diagrams can also be used when there is a high amount of uncertainty around a decision or goal.
5 – Calculate the expected valueThe expected value (EV) is the weighted average of all potential decision outcomes. To calculate the expected value, multiply the probability of each outcome occurring by the resulting value – sometimes referred to as the expected payoff. Then, sum the expected values for each decision.
For example, consider a large architectural firm that designs stadiums. During a public tender process, the firm submits two designs which the city council must evaluate for viability. For the sake of this article, we will call them Design A and Design B.
The city council determines that Design A, once completed, has a 55% chance of a $350 million valuation and a 25% chance of a $275 million valuation. The expected value of Design A is (0.55 x 350,000,000) + (0.25 x $275,000,000) = $261.25 million
On the other hand, Design B has a 20% chance of being valued at $400 million and a 60% chance of being valued at $290 million. The expected value of Design B is (0.20 x 400,000,000) + (0.60 x 290,000,000) = $254 million.
In this instance, the council should choose Design A.
Key takeaways:Decision analysis is a systematic, visual, and quantitative decision-making approach where all aspects of a decision are evaluated before making an optimal choice.Decision analysis is used in the project planning stage and during periodic reviews of project progress by senior management. The approach is especially suited to project management where there is often uncertainty around decision outcomes.Decision analysis occurs via five steps: identify the problem, research options, create a framework, develop a decision model, and calculate the expected value. At the heart of this process are the decision tree framework and the calculation of expected value.Connected Business Concepts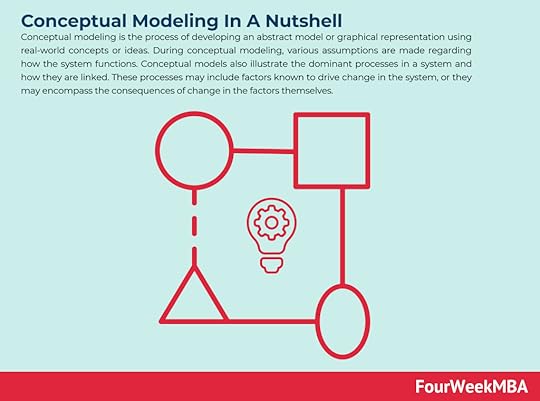 Conceptual modeling is the process of developing an abstract model or graphical representation using real-world concepts or ideas. During conceptual modeling, various assumptions are made regarding how the system functions. Conceptual models also illustrate the dominant processes in a system and how they are linked. These processes may include factors known to drive change in the system, or they may encompass the consequences of change in the factors themselves.
 Constructive controversy is a theory arguing that controversial discussions create a good starting point for understanding complex problems. A constructive controversy discussion is performed by following six steps: organize information and derive conclusions; presenting and advocating decisions; being challenged by opposing views; conceptual conflict and uncertainty; epistemic curiosity and perspective-taking; and reconceptualization, synthesis, and integration.
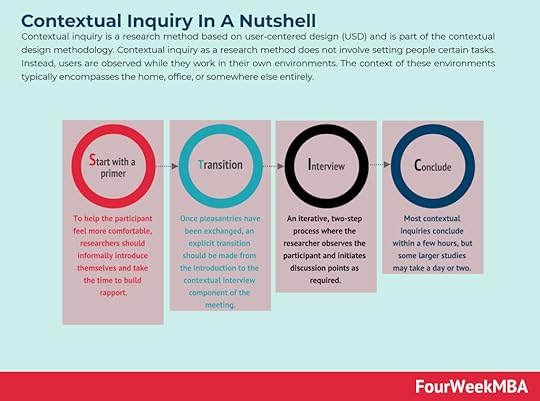 Contextual inquiry is a research method based on user-centered design (USD) and is part of the contextual design methodology. Contextual inquiry as a research method does not involve setting people certain tasks. Instead, users are observed while they work in their own environments. The context of these environments typically encompasses the home, office, or somewhere else entirely.
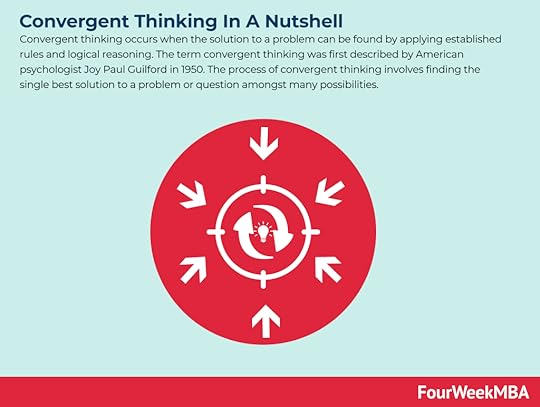 Convergent thinking occurs when the solution to a problem can be found by applying established rules and logical reasoning. The term convergent thinking was first described by American psychologist Joy Paul Guilford in 1950. The process of convergent thinking involves finding the single best solution to a problem or question amongst many possibilities.
 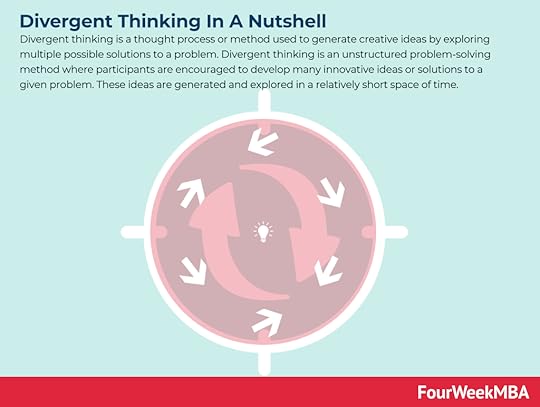 Divergent thinking is a thought process or method used to generate creative ideas by exploring multiple possible solutions to a problem. Divergent thinking is an unstructured problem-solving method where participants are encouraged to develop many innovative ideas or solutions to a given problem. These ideas are generated and explored in a relatively short space of time.
  First-principles thinking – sometimes called reasoning from first principles – is used to reverse-engineer complex problems and encourage creativity. It involves breaking down problems into basic elements and reassembling them from the ground up. Elon Musk is among the strongest proponents of this way of thinking.
 The ladder of inference is a conscious or subconscious thinking process where an individual moves from a fact to a decision or action. The ladder of inference was created by academic Chris Argyris to illustrate how people form and then use mental models to make decisions.
 The Six Thinking Hats model was created by psychologist Edward de Bono in 1986, who noted that personality type was a key driver of how people approached problem-solving. For example, optimists view situations differently from pessimists. Analytical individuals may generate ideas that a more emotional person would not, and vice versa.
 Second-order thinking is a means of assessing the implications of our decisions by considering future consequences. Second-order thinking is a mental model that considers all future possibilities. It encourages individuals to think outside of the box so that they can prepare for every and eventuality. It also discourages the tendency for individuals to default to the most obvious choice.
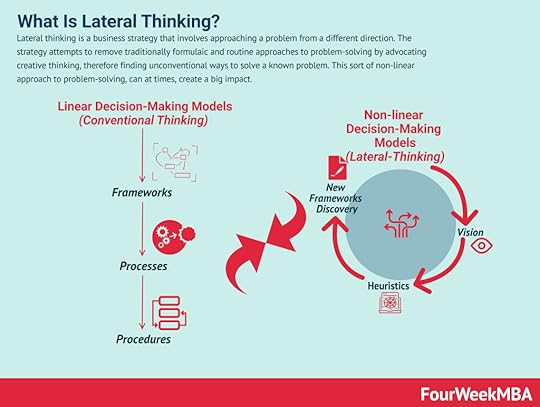 Lateral thinking is a business strategy that involves approaching a problem from a different direction. The strategy attempts to remove traditionally formulaic and routine approaches to problem-solving by advocating creative thinking, therefore finding unconventional ways to solve a known problem. This sort of non-linear approach to problem-solving, can at times, create a big impact.
 Moonshot thinking is an approach to innovation, and it can be applied to business or any other discipline where you target at least 10X goals. That shifts the mindset, and it empowers a team of people to look for unconventional solutions, thus starting from first principles, by leveraging on fast-paced experimentation.
 Tim Brown, Executive Chair of IDEO, defined design thinking as “a human-centered approach to innovation that draws from the designer’s toolkit to integrate the needs of people, the possibilities of technology, and the requirements for business success.” Therefore, desirability, feasibility, and viability are balanced to solve critical problems.
 The CATWOE analysis is a problem-solving strategy that asks businesses to look at an issue from six different perspectives. The CATWOE analysis is an in-depth and holistic approach to problem-solving because it enables businesses to consider all perspectives. This often forces management out of habitual ways of thinking that would otherwise hinder growth and profitability. Most importantly, the CATWOE analysis allows businesses to combine multiple perspectives into a single, unifying solution.
Main Free Guides:
Business ModelsBusiness StrategyBusiness DevelopmentDigital Business ModelsDistribution ChannelsMarketing StrategyPlatform Business ModelsRevenue ModelsTech Business ModelsBlockchain Business Models FrameworkThe post What Is Decision Analysis? Decision Analysis In A Nutshell appeared first on FourWeekMBA.
What Is Conceptual Modeling? Conceptual Modeling In A Nutshell
Conceptual modeling is the process of developing an abstract model or graphical representation using real-world concepts or ideas. During conceptual modeling, various assumptions are made regarding how the system functions. Conceptual models also illustrate the dominant processes in a system and how they are linked. These processes may include factors known to drive change in the system, or they may encompass the consequences of change in the factors themselves.
Understanding conceptual modelingTo understand and manage complex natural systems, simplifying assumptions must sometimes be made. This is achieved by portraying the system as a conceptual model based on the collective knowledge, experience, and perspectives of each.
In business, conceptual modeling is used to document definitions and communicate the precise meaning of terms to stakeholders. The process can best be described as a semantic representation of the nouns that are important for an organization or domain. This makes conceptual modeling especially useful in knowledge-intensive projects where subtle distinctions need to be made during communications. Indeed, conceptual models are devoid of technical biases and data models and should represent the language of an organization.
Conceptual models also help stakeholders better understand a situation and are used as a starting point in participatory or collaborative modeling. In this case, various stakeholder groups establish a common language that encourages innovative planning, evaluation, and collaborative decision-making.
Due to an increasingly broad and complex spectrum of abstract concepts, conceptual modeling can be used for many different projects across a similarly diverse number of fields. In software development, conceptual modeling tends to be used as a form of data modeling to represent abstract business entities and their relationships. The approach is also used in visual design, rapid application development, hotel reservation systems, online shopping applications, information systems development, and enterprise resource planning (ERP) systems.
Common conceptual modeling techniquesBelow are some of the most commonly used conceptual modeling techniques:
Data flow modeling (DFM) – a basic technique where the elements of a system are graphically represented by data flow. Instead of illustrating complex system details, DFM gives context to major system functions.Event-driven process chain (EPC) – a technique primarily used to improve business process flows. An EPC is comprised of events that define what state a process is in or the rules by which it operates. To progress through events, a function or active event must be executed. This technique is commonly seen in resource planning, logistics, and process improvement.Entity relationship modeling (ERM) – this modeling technique is typically seen in software systems. Here, database models and information systems are represented by entity-relationship diagrams, with entities denoting functions, objects, or events.Petri nets – a conceptual modeling technique for the description of distributed systems using exact mathematical definitions of execution semantics. Petri nets offer a graphical notation for stepwise processes that include iteration, choice, and concurrent execution.Limitations of conceptual modelingConceptual modeling is based on abstract conceptual models that are only as useful as the business makes them.
With that in mind, here are a few caveats to conceptual modeling:
Time-intensive – improper modeling of entities or relationships can cause time wastage and potential sunk costs. This usually occurs when development and planning have lost sight of the original problem or objective.System clashes – there is always the potential to create clashes between the various components of an abstract system. In the context of conceptual modeling, this may occur when design and coding assumptions clash after deployment.Scaling challenges – while conceptual modeling can certainly be used for larger applications, there are risks associated with developing and maintaining conceptual models in complex projects. This is because the number of potential clashes grows exponentially as the size of the system increases. Key takeaways:Conceptual modeling is the process of developing an abstract model or graphical representation using real-world concepts or ideas. The approach is used in visual design, hotel reservation systems, online shopping applications, and enterprise resource planning (ERP) systems, among many other applications.Conceptual modeling techniques include data flow modeling, event-driven process chains, entity relationship modeling, and Petri nets.Conceptual modeling does have some limitations. For one, the improper modeling of entities and relationships can result in sunk costs. There is also the constant threat of system clashes, particularly as the size and complexity of the system increases.Connected Business ConceptsContextual inquiry is a research method based on user-centered design (USD) and is part of the contextual design methodology. Contextual inquiry as a research method does not involve setting people certain tasks. Instead, users are observed while they work in their own environments. The context of these environments typically encompasses the home, office, or somewhere else entirely. Convergent thinking occurs when the solution to a problem can be found by applying established rules and logical reasoning. The term convergent thinking was first described by American psychologist Joy Paul Guilford in 1950. The process of convergent thinking involves finding the single best solution to a problem or question amongst many possibilities. Divergent thinking is a thought process or method used to generate creative ideas by exploring multiple possible solutions to a problem. Divergent thinking is an unstructured problem-solving method where participants are encouraged to develop many innovative ideas or solutions to a given problem. These ideas are generated and explored in a relatively short space of time. First-principles thinking – sometimes called reasoning from first principles – is used to reverse-engineer complex problems and encourage creativity. It involves breaking down problems into basic elements and reassembling them from the ground up. Elon Musk is among the strongest proponents of this way of thinking.The ladder of inference is a conscious or subconscious thinking process where an individual moves from a fact to a decision or action. The ladder of inference was created by academic Chris Argyris to illustrate how people form and then use mental models to make decisions.The Six Thinking Hats model was created by psychologist Edward de Bono in 1986, who noted that personality type was a key driver of how people approached problem-solving. For example, optimists view situations differently from pessimists. Analytical individuals may generate ideas that a more emotional person would not, and vice versa.Second-order thinking is a means of assessing the implications of our decisions by considering future consequences. Second-order thinking is a mental model that considers all future possibilities. It encourages individuals to think outside of the box so that they can prepare for every and eventuality. It also discourages the tendency for individuals to default to the most obvious choice.Lateral thinking is a business strategy that involves approaching a problem from a different direction. The strategy attempts to remove traditionally formulaic and routine approaches to problem-solving by advocating creative thinking, therefore finding unconventional ways to solve a known problem. This sort of non-linear approach to problem-solving, can at times, create a big impact.Moonshot thinking is an approach to innovation, and it can be applied to business or any other discipline where you target at least 10X goals. That shifts the mindset, and it empowers a team of people to look for unconventional solutions, thus starting from first principles, by leveraging on fast-paced experimentation.Tim Brown, Executive Chair of IDEO, defined design thinking as “a human-centered approach to innovation that draws from the designer’s toolkit to integrate the needs of people, the possibilities of technology, and the requirements for business success.” Therefore, desirability, feasibility, and viability are balanced to solve critical problems.The CATWOE analysis is a problem-solving strategy that asks businesses to look at an issue from six different perspectives. The CATWOE analysis is an in-depth and holistic approach to problem-solving because it enables businesses to consider all perspectives. This often forces management out of habitual ways of thinking that would otherwise hinder growth and profitability. Most importantly, the CATWOE analysis allows businesses to combine multiple perspectives into a single, unifying solution.
Main Free Guides:
Business ModelsBusiness StrategyBusiness DevelopmentDigital Business ModelsDistribution ChannelsMarketing StrategyPlatform Business ModelsRevenue ModelsTech Business ModelsBlockchain Business Models FrameworkThe post What Is Conceptual Modeling? Conceptual Modeling In A Nutshell appeared first on FourWeekMBA.
November 26, 2021
What Are Complex Systems? Complex Systems In A Nutshell
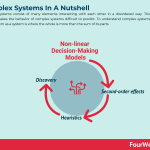
Complex systems consist of many elements interacting with each other in a disordered way. This disorder makes the behavior of complex systems difficult to predict. To understand complex systems think of them as a system is where the whole is more than the sum of its parts.
Understanding complex systemsComplex systems comprise the very fabric of life itself. They are seen in the way birds organize themselves into flying formations and in the emergent structures of plants, snowflakes, and galaxies. Complex systems also describe the formation of human social networks and the communication patterns and social capital that form as a result.
Despite the prevalence of complex systems, researchers cannot agree on a concise definition and there has been relatively little scientific study into the topic. Perhaps the most accepted descriptor of a complex system is one with “wholes that are more than the sum of their parts.” Importantly, the behavior of these wholes cannot be predicted or explained without looking at the interaction between multiple, interconnected components.
Properties of complex systemsComplex systems exhibit certain properties that arise from the dependencies and relationships existing between their constituent parts.
Some of these properties include:
Emergence – from the interaction between individual elements arises the behavior of the system as a whole. In complex systems, this higher-order behavior cannot be created by aggregating behavior at the element level. In other words, higher-order behavior arises spontaneously.Transitions, tipping points, and non-linearity – complex systems also display non-linear dynamics, which means they may suddenly behave differently or exhibit a new regime. Similarly, complex systems may display a high degree of stability in one moment and become chaotic in the next. Examples of complex systems with these traits include revolutions, pandemics, and financial crises. Unpredictability – since interactions are dynamic and non-linear, the behavior of a complex system cannot be predicted by inspecting its individual components. Unpredictability is related to emergence and so-called Black Swan events, which occur when small changes to a system become large effects over time.Evolutionary dynamics – complex systems are never at rest and do not move toward a knowable endpoint or equilibrium. The mechanism for evolution begins with variation in a few elements that flourish by multiplying in the system. These elements may change the external environment of the system. Conversely, the external environment is also able to change the system by introducing new variations.Adaptation – some complex systems are adaptive in that they can change and learn from experience. That is, they can organize or reorganize their internal structure in the absence of an external agent. Examples of these systems include the stock market, social insect colonies, the immune system, and the biosphere.Implications of complex systems for organizationsNow that we have defined the characteristics of complex systems, let’s take a look at the implications of complexity itself in an organizational context.
South African philosopher and complexity researcher Paul Cilliers defined seven.
1 – Relationships are fundamentalFor organizations to succeed, Cilliers suggested it was the nature of interactions between employees that drive innovation and company culture.
Focusing on how people are proximally located and rethinking the way meetings are conducted should be prioritized over training individuals to be creative in isolation.
2 – Stable states are not desirableWhile many organizations favor stability and certainty, the truth is they become stagnant and uncompetitive without continuous improvement and the embracing of change.
3 – No organization can be understood independently of its contextCilliers acknowledges that vision and mission are important, but they can inadvertently define the imaginary boundaries of a comfort zone. Successful organizations interact with their broad environment, which includes other organizations.
4 – The history of an organization determines its natureTwo organizations with similar histories are not the same. The history of each is comprised of countless events and interactions distributed through the system. These interactions alone determine a unique evolutionary trajectory for both companies.
What’s more, decision-makers should never assume that a practice that works well in one context will do the same in another.
5 – Novel characteristics, desirable or undesirable, may emergeAn undesirable characteristic may describe the plummeting sales in a previously popular product. Though the organization would prefer otherwise, it should not be surprised by emergence when it occurs.
By the same token, more desirable characteristics should not be suppressed or ignored simply because they were unexpected.
6 – Outcome magnitude is determined by the size of the cause and the context and history of the systemThis means the organization should be prepared for the unexpected and not underestimate the potential impact of an insignificant event.
In a recent TED talk, entrepreneur and CEO Margaret Heffernan suggested companies transition from “just in time” to “just in case”. That is, the focus should switch from efficiency to resilience to counter the unpredictability of complex system outcomes.
7 – Complex organizations cannot grow with excessive central controlLastly, it is suggested organizations distribute control through their systems. Too often, managers tasked with making unpopular decisions are keen to offload the responsibility to others and decentralize control. But when the decision is considered a popular one, control is highly centralized.
As workplaces become increasingly autonomous, the opportunity for all employees to feel motivated and engaged in meaningful work is critical. To achieve this, they must be given some degree of decision-making power – or what we might call autonomy.
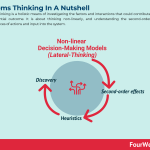
Key takeaways:Complex systems consist of many elements interacting with each other in a disordered way. This disorder makes the behavior of complex systems difficult to predict.Complex systems exhibit certain properties that arise from the dependencies and relationships existing between their constituent parts. Some of the core properties include emergence, non-linearity, unpredictability, evolutionary dynamics, and adaptation.The implications of complex systems for organizations were researched by researcher and philosopher Paul Cilliers. The implications suggest relationships are fundamental and stable states are not desirable. Cilliers also found that desirable and undesirable novel characteristics may emerge at any time and that complex organizations could not thrive with centralized control.Connected Business Frameworks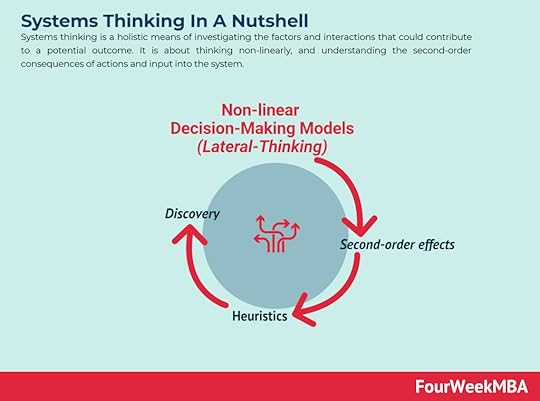 Systems thinking is a holistic means of investigating the factors and interactions that could contribute to a potential outcome. It is about thinking non-linearly, and understanding the second-order consequences of actions and input into the system.
 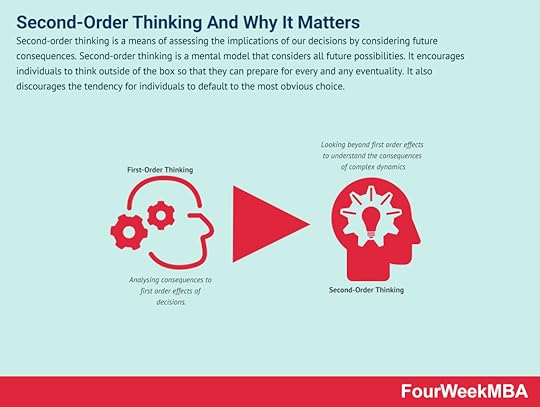 Second-order thinking is a means of assessing the implications of our decisions by considering future consequences. Second-order thinking is a mental model that considers all future possibilities. It encourages individuals to think outside of the box so that they can prepare for every and any eventuality. It also discourages the tendency for individuals to default to the most obvious choice.First-principles thinking – sometimes called reasoning from first principles – is used to reverse-engineer complex problems and encourage creativity. It involves breaking down problems into basic elements and reassembling them from the ground up. Elon Musk is among the strongest proponents of this way of thinking.The ladder of inference is a conscious or subconscious thinking process where an individual moves from a fact to a decision or action. The ladder of inference was created by academic Chris Argyris to illustrate how people form and then use mental models to make decisions.
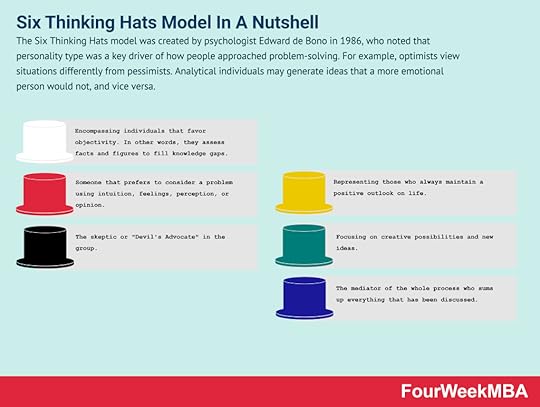 The Six Thinking Hats model was created by psychologist Edward de Bono in 1986, who noted that personality type was a key driver of how people approached problem-solving. For example, optimists view situations differently from pessimists. Analytical individuals may generate ideas that a more emotional person would not, and vice versa.Second-order thinking is a means of assessing the implications of our decisions by considering future consequences. Second-order thinking is a mental model that considers all future possibilities. It encourages individuals to think outside of the box so that they can prepare for every and eventuality. It also discourages the tendency for individuals to default to the most obvious choice.Lateral thinking is a business strategy that involves approaching a problem from a different direction. The strategy attempts to remove traditionally formulaic and routine approaches to problem-solving by advocating creative thinking, therefore finding unconventional ways to solve a known problem. This sort of non-linear approach to problem-solving, can at times, create a big impact.Moonshot thinking is an approach to innovation, and it can be applied to business or any other discipline where you target at least 10X goals. That shifts the mindset, and it empowers a team of people to look for unconventional solutions, thus starting from first principles, by leveraging on fast-paced experimentation.Tim Brown, Executive Chair of IDEO, defined design thinking as “a human-centered approach to innovation that draws from the designer’s toolkit to integrate the needs of people, the possibilities of technology, and the requirements for business success.” Therefore, desirability, feasibility, and viability are balanced to solve critical problems.The CATWOE analysis is a problem-solving strategy that asks businesses to look at an issue from six different perspectives. The CATWOE analysis is an in-depth and holistic approach to problem-solving because it enables businesses to consider all perspectives. This often forces management out of habitual ways of thinking that would otherwise hinder growth and profitability. Most importantly, the CATWOE analysis allows businesses to combine multiple perspectives into a single, unifying solution.
Main Free Guides:
Business ModelsBusiness StrategyBusiness DevelopmentDigital Business ModelsDistribution ChannelsMarketing StrategyPlatform Business ModelsRevenue ModelsTech Business ModelsBlockchain Business Models FrameworkThe post What Are Complex Systems? Complex Systems In A Nutshell appeared first on FourWeekMBA.
What Is Systems Thinking? Systems Thinking In A Nutshell
Systems thinking is a holistic means of investigating the factors and interactions that could contribute to a potential outcome. It is about thinking non-linearly, and understanding the second-order consequences of actions and input into the system.
Understanding systems thinkingSystems thinking is based on systems theory and is responsible for one of the major breakthroughs in the understanding of complex organizations. Systems theory studies systems from the perspective of the whole system, various subsystems, and the recurring patterns or relationships between subsystems.
The application of this theory in an organizational context is called systems analysis – of which systems thinking is a primary component. In general terms, systems thinking considers systems in terms of their overall structures, patterns, and cycles. This broad and holistic perspective enables organizations to identify solutions that address as many problems as possible.
In systems thinking, these solutions are known as leverage points because they leverage improvement throughout the system. Prioritizing leverage points across an entire system is called whole systems thinking.
The approach differs from traditional analysis methods which study systems by separating them into their constituent parts. In addition to analyzing organizational complexity, systems thinking has also been used in medical, environmental, political, economic, and educational contexts.
Why use systems thinking?By considering the system as a whole, systems thinking encourages organizations to broaden their perspectives and consider new or innovative solutions. This is particularly important for problems that are:
Chronic – that is, they are not a one-time event.Familiar – or those that have a known history of repeated occurrences.Complex – where people have unsuccessfully tried to find a solution in the past and failed.Perhaps more profoundly, systems thinking promotes the idea that there is no perfect solution to any situation. Every decision the business makes will impact other parts of the system, so the “right” decision may be assumed to be any with the least severe negative impact.
For project teams, systems thinking diagrams are also important in telling compelling user stories. Diagrams that deal with cause and effect force the team to develop shared pictures and stories that can be understood and communicated by every member.
Six key themes of systems thinkingHere are some of the key themes that comprise a systems thinking mindset:
Interconnectedness – systems thinkers understand that everything is connected. Trees need carbon dioxide, water, and sunlight to thrive. Humans, in turn, can only survive by eating the food and oxygen that trees and other plants produce. Systems thinkers see the world as a dynamic, chaotic, and interrelated arrangement of relationships and feedback loops.Synthesis – in most cases, synthesis means the act of combining things to create something new. In systems thinking, synthesis means separating complexity into manageable parts to understand the whole and the parts simultaneously.Emergence – a term used to describe the natural outcome of things interacting with one another. Key characteristics of emergence include non-linearity and self-organization.Feedback loops – a natural consequence of interconnectedness are the feedback loops which flow between the elements of a system. There are two main types: reinforcing and balancing. Reinforcing feedback loops involve elements in the loop reinforcing more of the same, such as population growth in a large city. Balancing loops are comprised of elements in some form of harmony, such as the relative abundance of predators and prey in an ecosystem.Systems mapping – this is one of the key tools in a system thinker’s arsenal. There are many ways to map a system, including behavior-over-time graphs, iceberg models, causal loop diagrams, and connected circles. Whatever the method chosen, it should define how the elements within a system behave and how they are related. Insights can then be used to develop effective shifts, interventions, policy, and project decisions.Causality – systems thinking also encourages the individual to consider causality as a dynamic and constantly evolving process. Most people understand simple cause and effect, but relatively few can apply the concept to gain a deeper understanding of system feedback loops, agency, connections, and relationships.Key takeaways:Systems thinking is a holistic means of investigating the factors and interactions that could contribute to a potential outcome. In addition to analyzing organizational and project complexity, it is also used in medical, environmental, political, economic, and educational contexts.Systems thinking promotes the idea that there is no perfect solution to any situation. This helps the organization choose the best course of action by anticipating the potential impact of each option.The systems thinking mindset is comprised of six key themes: interconnectedness, synthesis, emergence, feedback loops, systems mapping, and causality.Connected Business Frameworks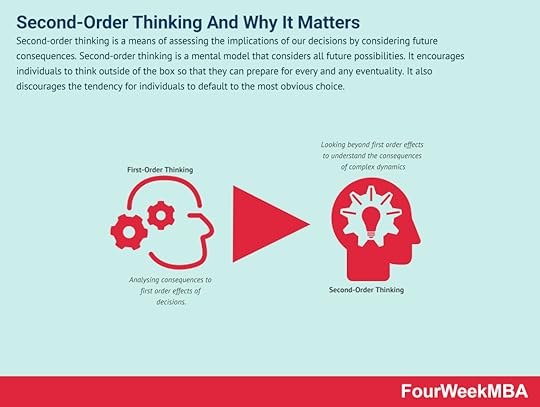 Second-order thinking is a means of assessing the implications of our decisions by considering future consequences. Second-order thinking is a mental model that considers all future possibilities. It encourages individuals to think outside of the box so that they can prepare for every and any eventuality. It also discourages the tendency for individuals to default to the most obvious choice.
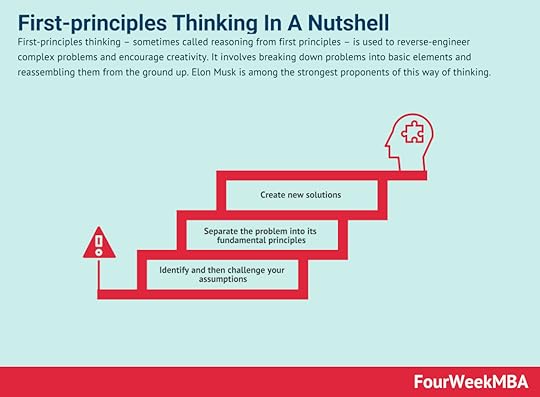 First-principles thinking – sometimes called reasoning from first principles – is used to reverse-engineer complex problems and encourage creativity. It involves breaking down problems into basic elements and reassembling them from the ground up. Elon Musk is among the strongest proponents of this way of thinking.The ladder of inference is a conscious or subconscious thinking process where an individual moves from a fact to a decision or action. The ladder of inference was created by academic Chris Argyris to illustrate how people form and then use mental models to make decisions.
 The Six Thinking Hats model was created by psychologist Edward de Bono in 1986, who noted that personality type was a key driver of how people approached problem-solving. For example, optimists view situations differently from pessimists. Analytical individuals may generate ideas that a more emotional person would not, and vice versa.Second-order thinking is a means of assessing the implications of our decisions by considering future consequences. Second-order thinking is a mental model that considers all future possibilities. It encourages individuals to think outside of the box so that they can prepare for every and eventuality. It also discourages the tendency for individuals to default to the most obvious choice.Lateral thinking is a business strategy that involves approaching a problem from a different direction. The strategy attempts to remove traditionally formulaic and routine approaches to problem-solving by advocating creative thinking, therefore finding unconventional ways to solve a known problem. This sort of non-linear approach to problem-solving, can at times, create a big impact.Moonshot thinking is an approach to innovation, and it can be applied to business or any other discipline where you target at least 10X goals. That shifts the mindset, and it empowers a team of people to look for unconventional solutions, thus starting from first principles, by leveraging on fast-paced experimentation.Tim Brown, Executive Chair of IDEO, defined design thinking as “a human-centered approach to innovation that draws from the designer’s toolkit to integrate the needs of people, the possibilities of technology, and the requirements for business success.” Therefore, desirability, feasibility, and viability are balanced to solve critical problems.The CATWOE analysis is a problem-solving strategy that asks businesses to look at an issue from six different perspectives. The CATWOE analysis is an in-depth and holistic approach to problem-solving because it enables businesses to consider all perspectives. This often forces management out of habitual ways of thinking that would otherwise hinder growth and profitability. Most importantly, the CATWOE analysis allows businesses to combine multiple perspectives into a single, unifying solution.
Main Free Guides:
Business ModelsBusiness StrategyBusiness DevelopmentDigital Business ModelsDistribution ChannelsMarketing StrategyPlatform Business ModelsRevenue ModelsTech Business ModelsBlockchain Business Models FrameworkThe post What Is Systems Thinking? Systems Thinking In A Nutshell appeared first on FourWeekMBA.
What Is Functional Decomposition? Functional Decomposition In A Nutshell
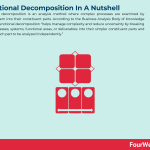
Functional decomposition is an analysis method where complex processes are examined by dividing them into their constituent parts. According to the Business Analysis Body of Knowledge (BABOK), functional decomposition “helps manage complexity and reduce uncertainty by breaking down processes, systems, functional areas, or deliverables into their simpler constituent parts and allowing each part to be analyzed independently.”
Understanding functional decompositionIn business, functional decomposition is commonly used to capture project requirements. If the strategy is used properly, the organization can produce more accurate time estimates and determine whether a project is on schedule. Importantly, it can also identify smaller functions contributing to project delays and help stakeholders develop a deeper understanding of key processes.
Some of the terms unique to functional decomposition are listed below:
Function – simply a task that is performed by a process, system, or device. Functions are expressed as a verb-noun phrase. For example, the functions of an ATM may include “reads cards” or “dispenses cash”.Decomposition – the process of breaking down.General function – a function that requires other functions to work in order to take place. Subfunction – a function that has to work for a general function to take place. Functional decomposition diagram – a diagram used to illustrate the hierarchical relationships between tasks and sub-tasks. Tree diagrams are commonly used because they clearly show how a large function can be split into many smaller functions. However, nested diagrams, flow diagrams, cause-effect diagrams, mind maps, and state transition diagrams can also be used.Performing functional decompositionIn this section, we’ll take a look at a general approach to performing functional decomposition:
Determine the most general function – in other words, what is the most general task a project needs to accomplish? It is important to be concise and identify a single function that best encapsulates a goal or objective. A short description of the general function should then be placed at the top of the diagram.Determine the closest subfunctions – these are the functions that must occur immediately before the general function. Each subfunction should be connected to the general function by drawing a line between them.Move down to the next subfunction level – for the subfunctions identified in step two, find the “second-order” subfunctions that must occur immediately before each and connect them with lines. This process should be repeated until the team arrives at the most basic functions which cannot be broken down any further.Subjects of functional decompositionDuring the introduction, we mentioned a few benefits of using functional decomposition during project management.
In truth, however, the applications of the approach are numerous. Here are just a few examples of subjects that can be separated into smaller parts:
Business processes – where functional decomposition can be used to clarify individual process steps to measure, manage, and optimize them.Business units – in this case, decomposition is used to understand how the organization works by evaluating individual business units. The diagram used in this context is the organogram, which illustrates organizational structure and shows hierarchical relationships between employees, managers, and departments.Solution component – where individual elements are built to facilitate solution design, implementation, or change. This is commonly used in Agile methodologies to plan and create products.Product and service development – in this case, functional decomposition is used to analyze and improve product and service design and implementation. Decision-making – lastly, the decomposition process improves decision-making by encouraging practitioners to identify key inputs, underlying models, outcomes, and dependencies.Key takeaways:Functional decomposition is an analysis method where complex processes are examined by dividing them into their constituent parts.Performing a functional decomposition means first defining a concise general function that aligns with project goals or objectives. Functions and subfunctions are then illustrated with connecting lines to represent their hierarchical relationship.Functional decomposition is perhaps most associated with project management, but the approach is also used to decompose business processes, business units, solution components, product and service development, and decision-making.Connected frameworks The Cynefin Framework gives context to decision making and problem-solving by providing context and guiding an appropriate response. The five domains of the Cynefin Framework comprise obvious, complicated, complex, chaotic domains and disorder if a domain has not been determined at all.
SWOT Analysis
 A SWOT Analysis is a framework used for evaluating the business’s Strengths, Weaknesses, Opportunities, and Threats. It can aid in identifying the problematic areas of your business so that you can maximize your opportunities. It will also alert you to the challenges your organization might face in the future.
 The Pareto Analysis is a statistical analysis used in business decision making that identifies a certain number of input factors that have the greatest impact on income. It is based on the similarly named Pareto Principle, which states that 80% of the effect of something can be attributed to just 20% of the drivers.
Failure Mode And Effects Analysis
 A failure mode and effects analysis (FMEA) is a structured approach to identifying design failures in a product or process. Developed in the 1950s, the failure mode and effects analysis is one the earliest methodologies of its kind. It enables organizations to anticipate a range of potential failures during the design stage.
 A Blindspot Analysis is a means of unearthing incorrect or outdated assumptions that can harm decision making in an organization. The term “blindspot analysis” was first coined by American economist Michael Porter. Porter argued that in business, outdated ideas or strategies had the potential to stifle modern ideas and prevent them from succeeding. Furthermore, decisions a business thought were made with care caused projects to fail because major factors had not been duly considered.
Main Free Guides:
Business ModelsBusiness StrategyBusiness DevelopmentDigital Business ModelsDistribution ChannelsMarketing StrategyPlatform Business ModelsRevenue ModelsTech Business ModelsBlockchain Business Models FrameworkThe post What Is Functional Decomposition? Functional Decomposition In A Nutshell appeared first on FourWeekMBA.
What Is The Alignment Problem? Alignment Problem In A Nutshell
The alignment problem was popularised by author Brian Christian in his 2020 book The Alignment Problem: Machine Learning and Human Values. In the book, Christian outlines the challenges of ensuring AI models capture “our norms and values, understand what we mean or intend, and, above all, do what we want.” The alignment problem describes the problems associated with building powerful artificial intelligence systems that are aligned with their operators.
Understanding the alignment problemArtificial intelligence has come a long way in recent years, with humankind now creating machines that can perform remarkable feats.
But after six decades of intensive research and development, aligning AI systems with human goals and values remains an elusive task. With every major field of artificial intelligence trying to replicate human intelligence, problems invariably arise when developers expect AI to act with the rationality and logic of a person.
Growing interest in machine and deep learning has meant the algorithms underpinning everything from baseball games to oil supply chains are being digitized. This process is helped by high-speed internet, cloud computing, the internet of things (IoT), mobile devices, and a plethora of emerging technologies that collect data on anything and everything.
While machine learning algorithms scale well with the availability of data and computing resources, they are nonetheless complex mathematical functions comparing observations to programmed outcomes. In other words, artificial intelligence is only as robust as the data used to train it.
When training data is poor quality or simply insufficient, algorithmic output suffers. This scenario represents the essence of the alignment problem.
Real-world examples of the alignment problemIn his book, Christian explains several cases where machine learning algorithms have caused embarrassing and sometimes damaging failures.
They include:
Google Photos – an algorithm used by the search engine giant in facial recognition software tagged people with dark skin as gorillas. Had Google trained the algorithm with more examples of people with dark skin, the failure could have been avoided.Amazon recruitment – Amazon’s recruitment tool once used artificial intelligence to give job candidates a score between one and five stars. In theory, this would allow the company to identify promising candidates amongst hundreds of resumes. However, the model was trained to vet applicants by observing patterns in resumes submitted over a decade-long period. Since most applications came from men, the algorithm automatically disqualified female applicants as a result.Real-world examples of the alignment problem were also mentioned by author Cathy O’Neil in her book Weapons of Math Destruction: How Big Data Increases Inequality and Threatens Democracy.
In the book, O’Neil explained how blind faith in algorithms caused pervasive damage to many aspects of consumer life. Some examples include:
Credit scoring systems that wrongfully penalize people.Recidivism algorithms that give defendants of a certain race or ethnicity a heavier prison sentence.Teacher-scoring algorithms that reward teachers who game the system and terminate honest, high-performing teachers.Trade algorithms that make billions of dollars profit at the expense of low-income classes and so-called “mom and pop” investors.Key takeaways:The alignment problem describes the problems associated with building powerful artificial intelligence systems that are aligned with their operators. The concept was popularised by Brian Christian in his book The Alignment Problem: Machine Learning and Human Values.At the core of the alignment problem is poor quality or insufficient algorithm training data. With data now being logged in almost every aspect of daily life, there is a higher likelihood of algorithms making poor decisions because of an overreliance on their mathematical functions.The alignment problem resulted in Google facial recognition models classifying people with darker skin as gorillas, while a similar mishap at Amazon caused its recruitment algorithm to ignore female applicants. Blind faith in algorithms has also resulted in arguably more sinister and pervasive consequences for the average consumer.Main Free Guides:
Business ModelsBusiness StrategyBusiness DevelopmentDigital Business ModelsDistribution ChannelsMarketing StrategyPlatform Business ModelsRevenue ModelsTech Business ModelsBlockchain Business Models FrameworkThe post What Is The Alignment Problem? Alignment Problem In A Nutshell appeared first on FourWeekMBA.
Business Architecture In A Nutshell
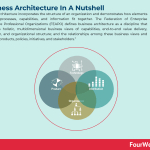
Business architecture incorporates the structure of an organization and demonstrates how elements including processes, capabilities, and information fit together. The Federation of Enterprise Architecture Professional Organizations (FEAPO) defines business architecture as a discipline that “represents holistic, multidimensional business views of: capabilities, end-to-end value delivery, information, and organizational structure; and the relationships among these business views and strategies, products, policies, initiatives, and stakeholders.”
Understanding business architectureThe Federation of Enterprise Architecture Professional Organizations (FEAPO) defines business architecture as a discipline that “represents holistic, multidimensional business views of: capabilities, end-to-end value delivery, information, and organizational structure; and the relationships among these business views and strategies, products, policies, initiatives, and stakeholders.”
Once applied, business architecture bridges the gap between an enterprise business model and strategy on one side, and the business functionality of the enterprise on the other. The relationship amongst elements from each side dictates and specifies what the organization does and how it can realize value by achieving its goals.
Business architectures are built by business architects, who work with senior stakeholders to foster continuous improvement, business transformation, and innovation initiatives. This is a critical role in any organization since only 10% of companies succeed in executing their vision.
Business architecture applicationsBusiness architecture can be applied to a plethora of situations where it is vital corporate strategies are cohesive and aligned across and between business units.
These applications include:
Defining a new market.Supply chain streamlining.Divestiture. Business capacity outsourcing.Driving legacy modernization. New product or service rollouts in the marketplace.The integration of processes, people, capabilities, culture, and technology during a merger or acquisition.Applying a customer-centric business model to a large enterprise, andReinventing who a company is or what it does.Components of a business architecture frameworkBusiness architecture frameworks help the organization connect strategy with operations in a clearly defined way. These frameworks do not impose restrictions on the business architecture itself. Instead, they serve as a foundation that organizations can build upon and customize based on their unique needs and real-world challenges.
Here are a few vital components of the business architecture framework:
Business blueprints – these blueprints enable streamlined and transparent business transformation across multiple business units, stakeholders, and capabilities. Transparency is important in maximizing solution-related investments while ensuring that the success of a business unit does not create problems for the enterprise as a whole. Consider the example of a company requiring users from the same customer base to separately enroll for multiple products. While each product might have succeeded in principle, the lack of a transparent blueprint resulted in a convoluted process and high user dissatisfaction.Business architecture scenarios – these also provide transparency on specific business initiatives and are applied differently according to the situation at hand. For example, a team tasked with reducing customer churn rate would require different information from one involved in a merger and acquisition. Business architecture scenarios define the collective set of programs, projects, and initiatives that leverage business architecture. Importantly, every scenario has a suggested roadmap for action.Business architecture knowledgebase – a repository that stores and organizes concise information about the business relevant to its environment. Most corporations have divisions and departments, while governmental agencies may be structured differently and use different terminology. As a result, there are generalized approaches to knowledgebase structure in addition to organizational or industry-specific approaches.Key takeaways:Business architecture incorporates the structure of an organization and demonstrates how elements including processes, capabilities, and information fit together. Essentially, it bridges the gap between an enterprise business model and strategy on one side, and the business functionality of the enterprise on the other.Business architecture is useful in a multitude of scenarios where corporate cohesiveness and alignment are beneficial. These include defining a new market, streamlining a supply chain, driving legacy modernization, and business capacity outsourcing.Business architecture frameworks serve as the basic foundation upon which a firm can build according to its specific needs and real-world challenges. However, most frameworks incorporate three components: business blueprints, business architecture scenarios, and a business architecture knowledge base.Related concepts to business architecture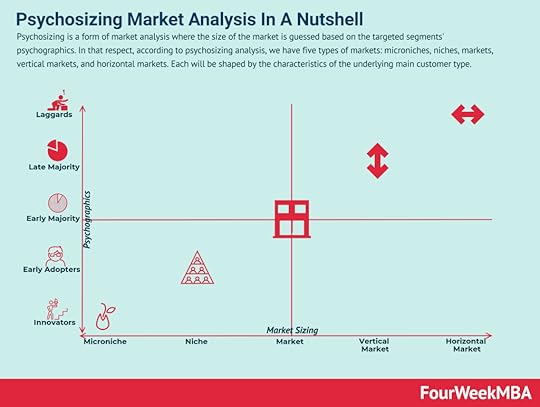 Psychosizing is a form of market analysis where the size of the market is guessed based on the targeted segments’ psychographics. In that respect, according to psychosizing analysis, we have five types of markets: microniches, niches, markets, vertical markets, and horizontal markets. Each will be shaped by the characteristics of the underlying main customer type.
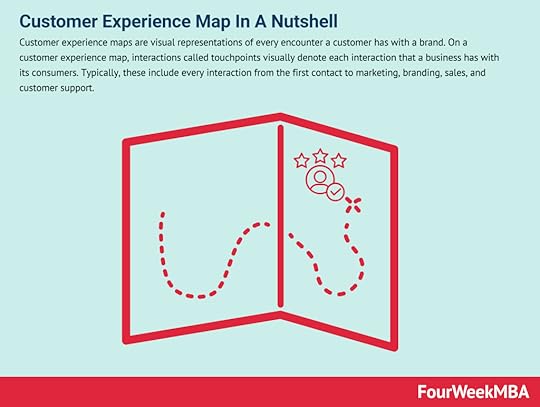 Customer experience maps are visual representations of every encounter a customer has with a brand. On a customer experience map, interactions called touchpoints visually denote each interaction that a business has with its consumers. Typically, these include every interaction from the first contact to marketing, branding, sales, and customer support.
 The customer journey – sometimes called the buyer or user journey – tells the customer experience with a business, brand, product, or service. A customer journey is an alternative approach to other linear models like the sales funnel which hypothesize that most customers follow the same path.
 360-degree feedback is a comprehensive performance feedback strategy for employees. Traditionally, performance feedback was solely given by the employee’s direct superior. In 360 degree feedback, however, anonymous feedback is given by a range of individuals that the employee has a working relationship with. These include managers, colleagues, and in some cases, customers.
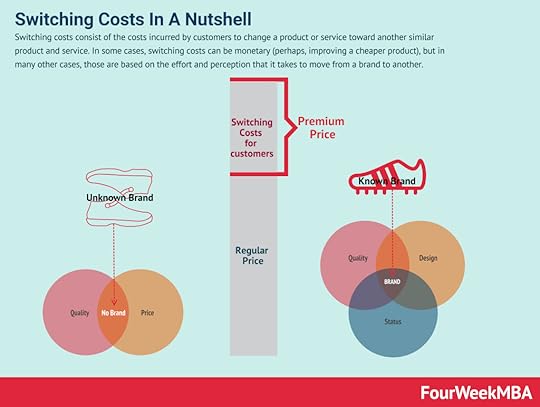 Switching costs consist of the costs incurred by customers to change a product or service toward another similar product and service. In some cases, switching costs can be monetary (perhaps, improving a cheaper product), but in many other cases, those are based on the effort and perception that it takes to move from a brand to another.
 Customer development is a formal process of identifying potential customers and determining how to meet their needs using testable hypotheses. Entrepreneur and business professor Steve Blank highlighted the Customer Development Manifesto principles in The Startup Owner’s Manual as the core principles for modern startups.
Main Free Guides:
Business ModelsBusiness StrategyBusiness DevelopmentDigital Business ModelsDistribution ChannelsMarketing StrategyPlatform Business ModelsRevenue ModelsTech Business ModelsBlockchain Business Models FrameworkThe post Business Architecture In A Nutshell appeared first on FourWeekMBA.


