
Gennaro Cuofano's Blog, page 143
September 10, 2021
What Is Reverse Brainstorming? Reverse Brainstorming In A Nutshell
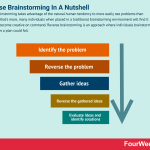
Reverse brainstorming takes advantage of the natural human tendency to more easily see problems than solutions. What’s more, many individuals when placed in a traditional brainstorming environment will find it difficult to become creative on command. Reverse brainstorming is an approach where individuals brainstorm the various ways a plan could fail.
Understanding reverse brainstormingInstead of asking the individual to solve a problem, reverse brainstorming asks them to consider the cause of a problem and then determine how to achieve the opposite result.
Reverse brainstorming is useful in situations where:
Ideas put forth in a traditional brainstorming session are too broad and lack enough detail to be put into action.There is a general lack of knowledge or expertise among team members.Complex problems generate a lot of unviable or unrelated solutions.Particular individuals with dominant personalities are making it difficult for others to express their ideas.A business has a product or service performing poorly in the market and can’t pinpoint why.How to conduct a reverse brainstorming sessionBelow is a general approach to conducting a reverse brainstorming session:
Identify the problem – start by clearly defining the problem as a goal that needs to be met by a specified time or date.Reverse the problem – in step two, the team takes the goal and reverses the expected process. Instead of brainstorming ideas to solve the problem, stakeholders are encouraged to think about how they can make it worse. For example, a team looking to improve customer service might consider how they can make customer service so poor that the customer walks away from purchasing.Gather ideas – the team then brainstorms ideas concerning the question posed in the previous step. A good facilitator is essential in ensuring the team does not revert to offering solution-based ideas. Examples of poor customer service include ignoring customer complaints, criticizing customers, dishonoring warranties, and not greeting shoppers as they walk through the door.Reverse the gathered ideas – once the team has exhausted their creative potential, the gathered ideas themselves must be reversed. To improve customer service, the team may suggest store representatives give a warm welcome to shoppers instead of ignoring them.Evaluate ideas and identify solutions – with every bad idea now transformed into a good one, the team can evaluate them and determine the best way forward. Ideas can be prioritized in any way the business sees fit.Key takeaways:Reverse brainstorming is an approach where individuals brainstorm the various ways a plan could fail.Reverse brainstorming is useful in situations where traditional sessions yield broad ideas lacking sufficient detail to be put into action. The approach can also be used to tackle complex problems or where certain dominant team members hinder a collaborative effort.Reverse brainstorming can be performed in five steps: identify the problem, reverse the problem, gather ideas, reverse the gathered ideas, and evaluate ideas to identify solutions. Reversing or reframing the solution as a problem is paramount, and a good facilitator ensures the team remains committed to the process.Main Free Guides:
Business ModelsBusiness StrategyBusiness DevelopmentDigital Business ModelsDistribution ChannelsMarketing StrategyPlatform Business ModelsTech Business ModelThe post What Is Reverse Brainstorming? Reverse Brainstorming In A Nutshell appeared first on FourWeekMBA.


What Is The RADPAC Model? RADPAC Model In A Nutshell
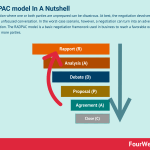
A negotiation where one or both parties are unprepared can be disastrous. At best, the negotiation devolves into a loose and unfocused conversation. In the worst-case scenario, however, a negotiation can turn into an adversarial confrontation. The RADPAC model is a basic negotiation framework used in business to reach a favorable outcome for two or more parties.
Understanding the RADPAC modelThe RADPAC model is a simple framework giving structure to a formal negotiation process and is widely used in business and corporate contexts. Most importantly, the model increases the likelihood a favorable and meaningful outcome eventuates for both sides.
In the next section, we’ll discuss the various components of the approach.
The six components of the RADPAC modelThe RADPAC model is made up of six components which give the model its name:
Rapport (R) – before starting the negotiation itself, both parties must first work to develop rapport with friendly, social conversation. This creates a comfortable and collaborative environment and if done correctly, sets a positive tone for the rest of the process.Analysis (A) – to begin the formal negotiation, each party must understand the perspective of the other by establishing facts and empathizing with feelings where possible. The point of this step is to develop an understanding of the other party and establish a basis for negotiation. There is no need for both parties to be in agreement. Otherwise, there would be no need for negotiation in the first place.Debate (D) – when many people think of debating, they assume it to be a zero-sum game where one party wins at the expense of the other. However, debating in a negotiation means searching for mutually agreeable solutions by maintaining a collaborative environment.Proposal (P) – in the fourth step, one or both parties suggests viable and mutually agreeable solutions. These solutions may partially or completely satisfy the needs of each party, depending on how well the negotiation has been handled until this point. In any case, a compromise acceptable to all should be the ultimate objective.Agreement (A) – the agreement stage begins with both parties restating what they have agreed to in the proposal stage. The logistics of the proposal – such as the allocation of time, money, and other resources – should also be discussed and defined. Lastly, the agreement should be recorded and read back to everyone in the room to ensure it is correct.Close (C) – a successful close should leave the door open for future negotiation between the two parties. Each party should thank the other for playing their role and then make a firm commitment to undertake any follow-up actions. Key takeaways:The RADPAC model is a basic negotiation framework used in business to reach a favorable outcome for two or more parties.The RADPAC model gives structure and clarity to a formal negotiation process. This avoids a scenario where the negotiation deteriorates into an adversarial confrontation or becomes loose and unfocused.The RADPAC model is based on six key steps: rapport, analysis, debate, proposal, agreement, and close. Both parties should take their time moving through the steps to foster a collaborative environment.Connected Negotiation Frameworks The Fishbone Diagram is a diagram-based technique used in brainstorming to identify potential causes for a problem, thus it is a visual representation of cause and effect. The problem or effect serves as the head of the fish. Possible causes of the problem are listed on the individual “bones” of the fish. This encourages problem-solving teams to consider a wide range of alternatives.
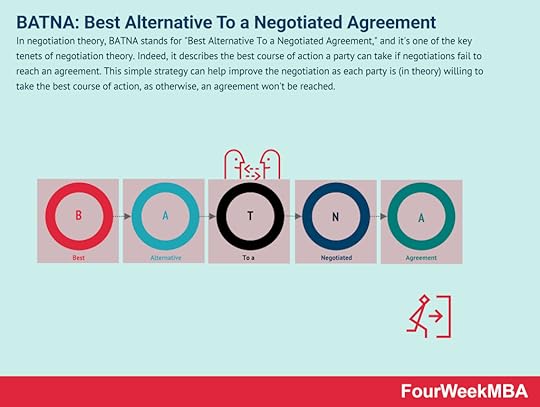 In negotiation theory, BATNA stands for “Best Alternative To a Negotiated Agreement,” and it’s one of the key tenets of negotiation theory. Indeed, it describes the best course of action a party can take if negotiations fail to reach an agreement. This simple strategy can help improve the negotiation as each party is (in theory) willing to take the best course of action, as otherwise, an agreement won’t be reached.
 In negotiation, WATNA stands for “worst alternative to a negotiated agreement,” representing one of several alternative options if a resolution cannot be reached. This is a useful technique to help understand what might be a negotiation outcome, that even if negative is still better than a WATNA, making the deal still feasible.
 The ZOPA (zone of possible agreement) describes an area in which two negotiation parties may find common ground. Indeed, ZOPA is critical to explore the deals where the parties get a mutually beneficial outcome to prevent the risk of a win-lose, or lose-win scenario. And therefore get to the point of a win-win negotiation outcome.
 In a logrolling negotiation, one party offers a concession on one issue to gain ground on another issue. In logrolling, there is no desire by either party to advertise the extent of their power, rights, or entitlements. This makes it a particularly effective strategy in complex negotiations where partial or complete impasses exist.
 The Theory of Constraints was developed in 1984 by business management guru Eliyahu Goldratt in his book The Goal. The Theory of Constraints argues that every system has at least one constraint that hinders high-level performance or profit generation. Fundamentally, the theory advocates identifying constraints and then eliminating them or at the very least, reducing their impact.
Read Next: Negotiation, Logrolling, BATNA, WATNA, ZOPA.
Main Free Guides:
Business ModelsBusiness StrategyBusiness DevelopmentDigital Business ModelsDistribution ChannelsMarketing StrategyPlatform Business ModelsTech Business ModelThe post What Is The RADPAC Model? RADPAC Model In A Nutshell appeared first on FourWeekMBA.
September 8, 2021
What Is The Principle-Agent Problem? Principle-agent Problem In A Nutshell
The theory behind the principle-agent problem was developed by Harvard Business School Professor Michael Jensen and economist and management professor William H. Meckling. The principle-agent problem describes a conflict in priorities between a person or group and the representative authorized to make decisions on their behalf.
Understanding the principle-agent problemIn a 1976 paper titled Theory of the Firm: Managerial Behavior, Agency Costs and Ownership Structure, Jensen and Meckling proposed an ownership structure theory to avoid what they defined as the separation of ownership and control.
This separation occurs when the interests of the agent and the principle diverge. When one person (the agent) is allowed to make decisions on behalf of another person (the principle), a conflict of interest can sometimes result. The agent may have more information than the principle, which means the principle cannot predict how the agent will act. As such, the agent tends to pursue their own goals instead of prioritizing the goals of the principle.
This scenario is often problematic for the principle, who typically retains ownership of assets and are liable for losses incurred despite delegating some degree of control and authority to the agent.
Agency costs in the principle-agent problemAgency costs are incurred when the interests of the agent and the principle diverge and need to be resolved.
For example, a traveling sales executive may prefer to stay in expensive hotels or eat at fancy restaurants. In so doing, the individual is looking after their own interests while adding little value to the company or its shareholders.
The agency cost of this behavior then decreases the financial performance of the company. In addition to paying high expense bills, the company may also incur costs from hiring an external auditor to analyze its financial statements. It may also be forced to terminate the employee in question and engage in an expensive and exhaustive recruitment process.
To that end, there are two categories of agency costs:
Costs incurred by the principle (shareholder) to prevent the agent (management team) from prioritizing their needs over shareholder interests.Costs incurred by the principle (company) when the agent (management team) uses company resources for their own benefit.How can the principle-agent problem be addressed?The solution to the principle-agent problem revolves around aligning the interests of both parties.
Here is how this might be achieved:
Contract design – or the creation of a contract framework between the principle and the agent. This ensures potential sources of information asymmetry are clearly defined, meaning the agent is less likely to act in a way that furthers their own interests. Furthermore, the contract should stipulate how the actions of the agent will be monitored to increase compliance.Performance evaluation and compensation – while monitoring is important, performance compensation provides extra motivation for the agent to act in a way that aligns with the principle’s interests. Performance should be evaluated subjectively because this is a more flexible and balanced method for complex tasks or arrangements. Depending on the situation, the principle may offer the agent deferred compensation, stock options, or profit-sharing.Key takeaways:The principle-agent problem describes a conflict in priorities between a person or group and the representative authorized to make decisions on their behalf. It was first introduced by Michael Jensen and William H. Meckling in 1976.The principle-agent problem states that when the interests of the agent and principle diverge, agency costs are incurred. These costs result when the principle tries to prevent the agent from prioritizing their needs over the needs of shareholders. Costs are also incurred when an agent misuses company funds for their own benefit without adding value to the bottom line.The principle-agent problem can be rectified by smart contract design. Contracts should identify potential sources of information asymmetry and include a plan for monitoring the actions of the agent. What’s more, the agent should be financially motivated to act in a way that benefits the principle.Other Strategy Frameworks:
Porter’s Five ForcesAnsoff MatrixBlitzscaling CanvasBusiness Analysis FrameworkGap AnalysisBusiness Model CanvasLean Startup CanvasDigital Marketing CircleBlue Ocean StrategyMain Free Guides:
Business ModelsBusiness StrategyBusiness DevelopmentDigital Business ModelsDistribution ChannelsMarketing StrategyPlatform Business ModelsTech Business ModelThe post What Is The Principle-Agent Problem? Principle-agent Problem In A Nutshell appeared first on FourWeekMBA.
What Is PERMA Model? The PERMA Model In A Nutshell
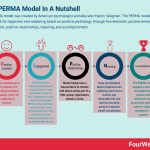
The PERMA model was created by American psychologist and educator Martin Seligman. The PERMA model is a framework for happiness and wellbeing based on positive psychology through five elements: positive emotion, engagement, positive relationships, meaning, and accomplishment.
Understanding the PERMA modelIn 1998, Seligman used his inaugural address as the new president of the American Psychological Association to call for a paradigm shift in psychology. Until that point, the industry focused on relieving human suffering through the understanding and treatment of mental health disorders and maladaptive behaviors.
However, reducing the suffering of someone with poor mental health is not the same as wellbeing – after all, these individuals want to be able to thrive instead of merely existing. In response, Seligman shifted the focus to what was good and positive in life with a simple model defining the elements of a meaningful existence.
This approach is now known as positive psychology, where the ultimate goal is to make life worth living by defining, quantifying, and creating wellbeing in individuals.
The five elements of the PERMA modelTo synthesize the positive psychology approach into a theory, Seligman defined five elements.
Each element is intrinsically motivating and contributes to wellbeing, and each should be pursued for its own sake and measured independently.
Following is a look at the five elements which also comprise the PERMA acronym.
1 – Positive emotion (P)Positive emotions are a prime indicator of a flourishing individual and happily, these can be cultivated or learned. Examples include joy, love, compassion, fulfillment, hope, interest, amusement, and gratitude.
It’s important to note that positive emotion is more nuanced than simply feeling happy or flashing a great smile. For example, a person may feel happy after accepting their tortured past while looking to the future with renewed hope.
2 – Engagement (E)Most people have experienced getting lost in a good book or movie and losing all sense of time. Engagement is very similar to psychologist Mihaly Csikszentmihalyi’s concept of flow, where the individual lives in the present moment by focusing completely on a moderately difficult task.
Engagement can be encouraged by the individual participating in activities they love or remaining in the present moment using a technique such as mindfulness. Positive psychology also suggests spending time in nature and identifying one’s own character strengths.
3 – Positive relationships (R)Human beings have a natural desire to connect with others and be part of a tribe, group, organization, school, or circle. In fact, social connections have been found to play a role in preventing cognitive decline and increasing physical health.
Well-being can also be increased through the strengthening or maintaining of intimate relationships. This may involve simple actions like sharing good news or responding enthusiastically to the presence of others.
4 – Meaning (M)Many psychologists believe happiness and wellbeing result from a creative and meaningful life, and not from the blind pursuit of material wealth and pleasure. Seligman defined meaning as life purpose, where the individual devotes their life to something greater than themselves.
Meaning is guided by personal values and as a result, will be different for everyone. For instance, an environmentalist may find meaning by volunteering at an organization that plants trees and conserves animals. Many others find meaning in their religious beliefs or professions.
Wherever meaning is found, however, those with a sense of purpose live longer and have greater life satisfaction.
5 – Accomplishment (A)The PERMA model suggests a sense of accomplishment results when individual works toward their goals and achieves mastery, competence, or success.
Accomplishment should be pursued for its own sake and should not be seen as a means to an end. Indeed, many individuals will find achieving their goals more satisfying because of the sometimes unpleasant process of working toward something.
Goals can be set in any context, including in the workplace, on the sports field, or in the development of a craft, hobby, or interest.
Key takeaways:The PERMA model is a framework for happiness and wellbeing based on positive psychology. It was developed by American psychologist and educator Martin Seligman.Fundamental to the PERMA model is positive psychology, a relatively new domain in psychology involving the scientific study of what makes life most worth living. Positive psychology differs from traditional psychology, which tends to focus on mental illness with and maladaptive behavior.The PERMA model is comprised of five elements: positive emotion, engagement, positive relationships, meaning, and accomplishment. Each element contributes to well-being, is pursued for its own sake, and is defined and measured independently of other elements.Connected Business Frameworks The Six Thinking Hats model was created by psychologist Edward de Bono in 1986, who noted that personality type was a key driver of how people approached problem-solving. For example, optimists view situations differently from pessimists. Analytical individuals may generate ideas that a more emotional person would not, and vice versa.
 Value stream mapping uses flowcharts to analyze and then improve on the delivery of products and services. Value stream mapping (VSM) is based on the concept of value streams – which are a series of sequential steps that explain how a product or service is delivered to consumers.
 Affinity grouping is a collaborative prioritization process where group participants brainstorm ideas and opportunities according to their similarities. Affinity grouping is a broad and versatile process based on simple but highly effective ideas. It helps teams generate and then organize teams according to their similarity or likeness.
 The Fishbone Diagram is a diagram-based technique used in brainstorming to identify potential causes for a problem, thus it is a visual representation of cause and effect. The problem or effect serves as the head of the fish. Possible causes of the problem are listed on the individual “bones” of the fish. This encourages problem-solving teams to consider a wide range of alternatives.
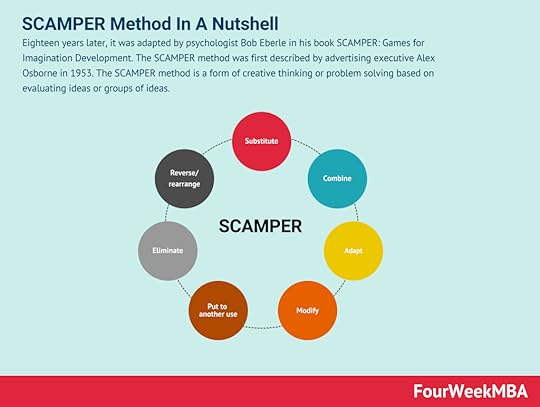 Eighteen years later, it was adapted by psychologist Bob Eberle in his book SCAMPER: Games for Imagination Development. The SCAMPER method was first described by advertising executive Alex Osborne in 1953. The SCAMPER method is a form of creative thinking or problem solving based on evaluating ideas or groups of ideas.
 The MECE framework is an exhaustive expression of information that must account for all conceivable scenarios. While the framework is used in categorizing information and data processing, it is commonly used in formulating problems and then solving them. The MECE framework is a means of the exhaustive grouping of information into categories that are both mutually exclusive (ME) and collectively exhaustive (CE).
 The Nadler-Tushman Congruence Model was created by David Nadler and Michael Tushman at Columbia University. The Nadler-Tushman Congruence Model is a diagnostic tool that identifies problem areas within a company. In the context of business, congruence occurs when the goals of different people or interest groups coincide.
 Lewin’s change management model helps businesses manage the uncertainty and resistance associated with change. Kurt Lewin, one of the first academics to focus his research on group dynamics, developed a three-stage model. He proposed that the behavior of individuals happened as a function of group behavior.
Main Free Guides:
Business ModelsBusiness StrategyBusiness DevelopmentDigital Business ModelsDistribution ChannelsMarketing StrategyPlatform Business ModelsTech Business ModelThe post What Is PERMA Model? The PERMA Model In A Nutshell appeared first on FourWeekMBA.
What Is Path-Goal Theory? Path-Goal Theory In A Nutshell
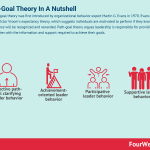
The path-goal theory was first introduced by organizational behavior expert Martin G. Evans in 1970. Evans based his work on Victor Vroom’s expectancy theory, which suggests individuals are motivated to perform if they know their performance will be recognized and rewarded. Path-goal theory argues leadership is responsible for providing subordinates with the information and support required to achieve their goals.
Understanding path-goal theoryThe path-goal theory states that the behavior of a leader is related to the satisfaction, motivation, and performance of his or her subordinates. The theory was later revised to include a stipulation that the leader must also act in a way that complements subordinate abilities and compensates subordinate deficiencies.
While the leader must exhibit different types of leadership behavior depending on the situation, they must always assist employees in achieving their goals. Perhaps most importantly of all, the leader must ensure employee goals are aligned with organizational goals.
Path-goal theory leadership behaviorEvans identified four types of leadership behavior a senior staff member must display:
Directive path-goal clarifying leader behavior – describing any instance where the leader verbalizes to subordinates what is expected of them and how to complete their tasks. This form of leadership behavior is intrinsically rewarding for the subordinate when there is a degree of ambiguity around their role and task demands.Achievement-oriented leader behavior – where a leader sets high standards for subordinates and encourages these standards to be met by showing faith in their ability. This type of behavior is prevalent in sales, engineering, science, entrepreneurship, and some technical jobs.Participative leader behavior – these leaders are characterized by a preference to use a collaborative style of decision-making. That is, they actively solicit the opinions and ideas of the subordinates and incorporate them into strategy.Supportive leader behavior – supportive leaders are friendly, approachable, and attend to the well-being of subordinates with empathy and understanding. In so doing, they consider those ranked beneath them to be equals.Path-goal theory follower behaviorFollower (or subordinate) behavior describes how followers interpret the behavior of their leader in a work context.
In turn, these characteristics determine whether each subordinate considers their leadership satisfying or as a way to reach future satisfaction.
Communication and leadership consultant Peter G. Northouse subsequently defined four follower behaviors:
Need for affiliation – followers with a strong preference for affiliation prefer friendly and supportive leaders characterized by the fourth type of leadership behavior mentioned earlier.Preference for structure – followers who work in uncertain situations naturally prefer leaders who remove that uncertainty with direction, structure, and task clarity. These so-called directive leaders also set clear, unambiguous goals.Desire for control – this may be characterized by an internal locus of control where the follower believes they are in control of their own life. But it may also describe an external locus of control, where the individual believes external events or influences largely dictate what happens to them. Followers with an internal locus prefer participative leaders since they prefer to feel in control of decision-making. Followers with an external locus prefer the actions of a directive leader because that style of leadership reinforces their beliefs about how the world operates. Self-perceived level of task ability – according to Northouse, the extent to which an individual believes they can complete a task is negatively correlated with directive leadership. In theory, this makes sense, because followers who are given the freedom and autonomy to complete a task do not require a controlling, assertive leader.Key takeaways:Path-goal theory argues leadership is responsible for providing subordinates with the information and support required to achieve their goals. The theory was developed by Martin G. Evans, who based it on Vroom’s expectancy theory.Path-goal theory argues leaders must compensate for employee deficiencies and complement employee abilities depending on the situation. This adaptiveness is facilitated by leadership exhibiting four different styles: directive, participative, supportive, and achievement-oriented.Path-goal theory also defines four styles of subordinate behavior which determine the degree to which a follower is satisfied with their superior. These include a need for affiliation, preference for structure, desire for control, and self-perceived level of task ability.Connected Leadership Frameworks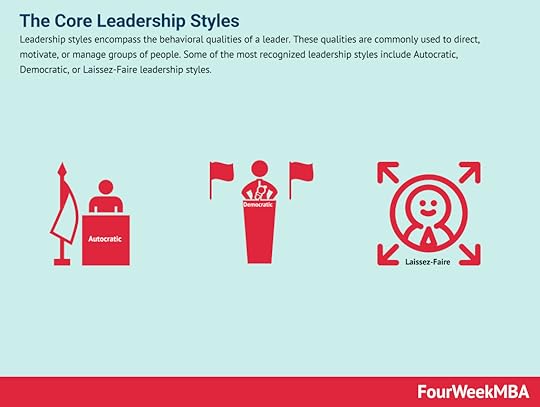 Leadership styles encompass the behavioral qualities of a leader. These qualities are commonly used to direct, motivate, or manage groups of people. Some of the most recognized leadership styles include Autocratic, Democratic, or Laissez-Faire leadership styles.
 Transformational leadership is a style of leadership that motivates, encourages, and inspires employees to contribute to company growth. Leadership expert James McGregor Burns first described the concept of transformational leadership in a 1978 book entitled Leadership. Although Burns’ research was focused on political leaders, the term is also applicable for businesses and organizational psychology.
 The theory was developed by psychologist Edwin Locke who also has a background in motivation and leadership research. Locke’s goal-setting theory of motivation provides a framework for setting effective and motivating goals. Locke was able to demonstrate that goal setting was linked to performance.
 Harvard Business School professor Dr. John Kotter has been a thought-leader on organizational change, and he developed Kotter’s 8-step change model, which helps business managers deal with organizational change. Kotter created the 8-step model to drive organizational transformation.
 The Value Disciplines Model was developed by authors Michael Treacy and Fred Wiersema. In their model, the authors use the term value discipline to represent any method a business may use to differentiate itself. The Value Disciplines Model argues that for a business to be viable, it must be successful in three key areas: customer intimacy, product leadership, and operational excellence.
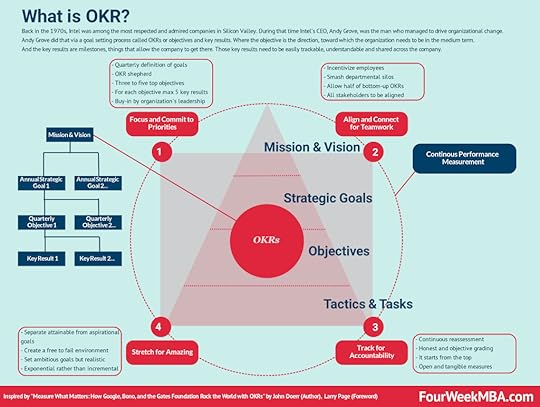 Andy Grove, helped Intel become among the most valuable companies by 1997. In his years at Intel, he conceived a management and goal-setting system, called OKR, standing for “objectives and key results.” Venture capitalist and early investor in Google, John Doerr, systematized in the book “Measure What Matters.”
 Tipping Point Leadership is a low-cost means of achieving a strategic shift in an organization by focusing on extremes. Here, the extremes may refer to small groups of people, acts, and activities that exert a disproportionate influence over business performance.
 Amazon fundamental principles that drove and drive the company are: Customer Obsession Ownership Invent and Simplify Are Right, A Lot Learn and Be Curious Hire and Develop the Best Insist on the Highest Standards Think Big Bias for Action Frugality Earn Trust Dive Deep Have Backbone; Disagree and Commit Deliver Results
 In his book, “Competitive Advantage,” in 1985, Porter conceptualized the concept of competitive advantage, by looking at two key aspects. Industry attractiveness, and the company’s strategic positioning. The latter, according to Porter, can be achieved either via cost leadership, differentiation, or focus.
Main Free Guides:
Business ModelsBusiness StrategyBusiness DevelopmentDigital Business ModelsDistribution ChannelsMarketing StrategyPlatform Business ModelsTech Business ModelThe post What Is Path-Goal Theory? Path-Goal Theory In A Nutshell appeared first on FourWeekMBA.
What Is PANAS Schedule? PANAS Schedule In A Nutshell
The positive and negative affect schedule (PANAS) was developed by researchers from Southern Methodist University and the University of Minnesota in 1988. The PANAS schedule is the most widely and frequently used scale to assess positive and negative emotions through two scales of measure: positive affect, and negative affect.
Understanding the PANAS scheduleThe schedule is comprised of two scales, with each consisting of different words that describe feelings and emotions. More specifically, the two scales measure:
Positive affect – or the propensity of an individual to experience positive emotions and interact with others positively with joy, cheerfulness, or contentment. Negative affect – where the individual experiences negative emotions that influence how they interact with others and their surroundings. These emotions may include sadness, anger, or fear.Here, the term affect simply describes the emotions or feelings an individual experiences at any given moment and how these emotions or feelings influence behavior.
The PANAS schedule is used as a self-reporting diagnostic tool in community and clinical contexts, with the scale itself showing the relationship between positive and negative affect according to certain personality traits.
Since both affects exist on a scale, a person can exhibit both positive and negative emotions at the same time. For example, an individual whose colleague receives a promotion may feel happy for them but also jealous.
Completing a PANAS scheduleFor each of the two scales outlined in the previous section, researchers identified 10 positive and negative affect terms strongly correlated with mood. These are listed below.
Positive affectAttentive.Active.Alert.Excited.Enthusiastic.Determined.Inspired.Proud.Interested. Strong.Negative affectHostile.Irritable.Ashamed.Guilty.Distressed.Upset.Scared.Afraid.Jittery.Nervous.Participants then use a 5-point Likert scale to evaluate the extent to which an emotion applies.
Specifically:
Very slightly or not at all.A little.Moderately.Quite a bit.Extremely.In a clinical context, the client is asked to rate the degree to which they are experiencing emotions in the present moment or the past week.
Once completed, the participants sum the scores from each of the ten positive and negative affect terms. Scores range from 10 and 50 in both cases, with lower scores representing lower levels of positive and negative affect and higher scores representing higher levels.
Subsequent interpretations of the PANAS scheduleThe PANAS schedule has undergone several revisions since it was released, including:
PANAS-C – for clinicians who work with school-age children. This test was designed to make it simpler for children to identify different emotions. A shortened version with 10 questions instead of 29 is also available.I-PANAS-SF – a short-form iteration for those with competent but non-native English speaking skills. This test has fewer ambiguities, which reduces the likelihood a question will be misinterpreted.PANAS-X – a shorter and more refined version released in 1994 that can be completed in as little as ten minutes. In addition to positive and negative affect, PANAS-X incorporates other affective states such as shyness, serenity, and surprise.Key takeaways:The PANAS schedule is the most widely and frequently used scale to assess positive and negative emotions. It was developed by researchers from Southern Methodist University and the University of Minnesota in 1988.The PANAS schedule measures positive and negative affect, or the moment-by-moment emotions and feelings an individual experiences which influence their behavior. Both are measured on a scale since positive and negative emotions can occur simultaneously.The PANAS schedule has been adapted to multiple applications since its release. Variations of the test are now administered to children and non-native English speakers, among other uses.Connected Business Concepts The Pomodoro Technique was created by Italian business consultant Francesco Cirillo in the late 1980s. The Pomodoro Technique is a time management system where work is performed in 25-minute intervals.
 Timeboxing is a simple yet powerful time-management technique for improving productivity. Timeboxing describes the process of proactively scheduling a block of time to spend on a task in the future. It was first described by author James Martin in a book about agile software development.
 An action priority matrix is a productivity tool that helps businesses prioritize certain tasks and objectives over others. The matrix itself is represented by four quadrants on a typical cartesian graph. These quadrants are plotted against the effort required to complete a task (x-axis) and the impact (benefit) that each task brings once completed (y-axis). This matrix helps assess what projects need to be undertaken and the potential impact for each.
 The jobs-to-be-done (JTBD) framework defines, categorizes, captures, and organizes consumer needs. The jobs-to-be-done framework is based on the premise that consumers buy products and services to get jobs done. While products tend to come and go, the consumer need to get jobs done endures indefinitely. This theory was popularized by Tony Ulwick, who also detailed his book Jobs To Be Done: Theory to Practice.
 Kanban is a lean manufacturing framework first developed by Toyota in the late 1940s. The Kanban framework is a means of visualizing work as it moves through identifying potential bottlenecks. It does that through a process called just-in-time (JIT) manufacturing to optimize engineering processes, speed up manufacturing products, and improve the go-to-market strategy.
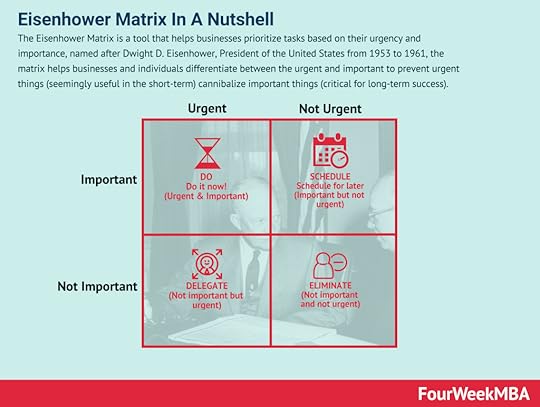 The Eisenhower Matrix is a tool that helps businesses prioritize tasks based on their urgency and importance, named after Dwight D. Eisenhower, President of the United States from 1953 to 1961, the matrix helps businesses and individuals differentiate between the urgent and important to prevent urgent things (seemingly useful in the short-term) cannibalize important things (critical for long-term success).
 A decision matrix is a decision-making tool that evaluates and prioritizes a list of options. Decision matrices are useful when: A list of options must be trimmed to a single choice. A decision must be made based on several criteria. A list of criteria has been made manageable through the process of elimination.An action priority matrix is a productivity tool that helps businesses prioritize certain tasks and objectives over others. The matrix itself is represented by four quadrants on a typical cartesian graph. These quadrants are plotted against the effort required to complete a task (x-axis) and the impact (benefit) that each task brings once completed (y-axis). This matrix helps assess what projects need to be undertaken and the potential impact for each.
Main Free Guides:
Business ModelsBusiness StrategyBusiness DevelopmentDigital Business ModelsDistribution ChannelsMarketing StrategyPlatform Business ModelsTech Business ModelThe post What Is PANAS Schedule? PANAS Schedule In A Nutshell appeared first on FourWeekMBA.
What Is The Stereotype Content Model? The Stereotype Content Model In A Nutshell
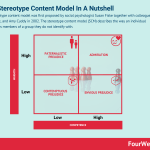
The stereotype content model was first proposed by social psychologist Susan Fiske together with colleagues Jun Xu, Peter Glick, and Amy Cuddy in 2002. The stereotype content model (SCM) describes the way an individual stereotypes members of a group they do not identify with.
Understanding the stereotype content modelThe model is based on an evolutionary predisposition for people to stereotype strangers in a new group in two different ways:
The individual first assesses the perceived intent of the group to either help them or harm them. This is measured by the metric warmth.Then, the individual judges the capacity of the group to act on either intention. This is measured by the metric competence.Depending on how warmth and competence are categorized, the individual will feel a particular way about a group and act accordingly. These actions are the basis of stereotyping, with subsequent research into the model finding it to be a reliable predictor of stereotypical content and its associated behavior.
Studies on warmth and competence in social psychology have also been utilized in fields such as advertising, international relations, persuasion, policy formation, and corporate management.
The four quadrants of the stereotype content modelTo further develop their model, Cuddy, Fiske, and Glick developed a table to show the different interactions between warmth and competence. The table displays four quadrants, with each based on a causal model of stereotype development.
Primarily, the table was created to show that some stereotypes were positive or contained mixed attributes. For example, some people stereotype the elderly as warm but not competent, while others may consider Asian people to be competent but not warm.
The table has two spectrums:
Active/passive spectrum – active behaviors are intentionally directed at the group, while passive behaviors affect the group but do not require noticeable effort.Harm/facilitation spectrum – the second spectrum is included to differentiate between the out-group an individual (or in-group) is in a position to either assist or harm.In addition, each stereotype group quadrant is assigned two behavioral tendencies. This means common cultural stereotypes determine whether a social group will be on the receiving end of cooperative or harmful behavior, with both received either actively or passively.
Let’s now take a look at each of the four quadrants:
High warmth/high competence – these groups are admired with active facilitation and constitute in-groups, or groups to which the observer personally belongs. Middle class, white, and heterosexual groups fall under this quadrant.High warmth/low competence – these groups are pitied with passive facilitation. In many Western societies, this treatment is usually directed toward the elderly and disabled. While these groups are pitied from a moral standpoint, they are nonetheless isolated from society. For example, elderly people receive passive harm when they are isolated in a care facility. But they may also receive active facilitation through community service or elderly charities.Low warmth/high competence – these groups are envied with passive harm because they are generally perceived to lack warmth and possess high competency. In the United States, out-groups include Asian Americans, wealthy Americans, and the Jewish community.Low warmth/low competence – these groups are treated with contempt through active harm, such as the homeless or unemployed. Perhaps unsurprisingly, they are treated with the most hostility of any group.Key takeaways:The stereotype content model describes the way an individual stereotypes members of a group they do not identify with. It was developed by social psychologist Susan Fiske and colleagues Jun Xu, Peter Glick, and Amy Cuddy in 2002.The stereotype content model measures two dimensions that describe the way an individual will feel (and subsequently act) when encountering a stranger or group. The first dimension is warmth, or the extent to which the individual believes a group can harm them or help them. The second is competence, or the extent to which the group can carry out either intention.The two dimensions of the stereotype content model were later displayed in a table with four quadrants. Each quadrant describes a different stereotype out-group, with each categorized according to whether they will be on the receiving end of harmful or cooperative behavior.Connected Business MatricesSFA Matrix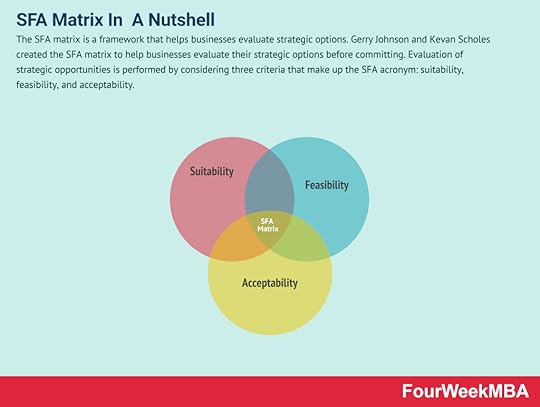 The SFA matrix is a framework that helps businesses evaluate strategic options. Gerry Johnson and Kevan Scholes created the SFA matrix to help businesses evaluate their strategic options before committing. Evaluation of strategic opportunities is performed by considering three criteria that make up the SFA acronym: suitability, feasibility, and acceptability.Hoshin Kanri X-Matrix
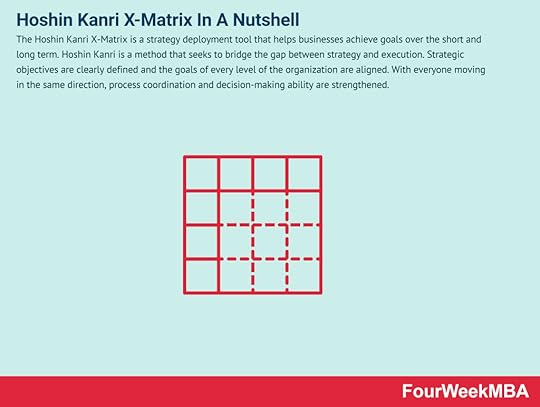 The Hoshin Kanri X-Matrix is a strategy deployment tool that helps businesses achieve goals over the short and long term. Hoshin Kanri is a method that seeks to bridge the gap between strategy and execution. Strategic objectives are clearly defined and the goals of every level of the organization are aligned. With everyone moving in the same direction, process coordination and decision-making ability are strengthened.Kepner-Tregoe Matrix
 The Kepner-Tregoe matrix was created by management consultants Charles H. Kepner and Benjamin B. Tregoe in the 1960s, developed to help businesses navigate the decisions they make daily, the Kepner-Tregoe matrix is a root cause analysis used in organizational decision making.Eisenhower Matrix
 The Eisenhower Matrix is a tool that helps businesses prioritize tasks based on their urgency and importance, named after Dwight D. Eisenhower, President of the United States from 1953 to 1961, the matrix helps businesses and individuals differentiate between the urgent and important to prevent urgent things (seemingly useful in the short-term) cannibalize important things (critical for long-term success).Decision MatrixA decision matrix is a decision-making tool that evaluates and prioritizes a list of options. Decision matrices are useful when: A list of options must be trimmed to a single choice. A decision must be made based on several criteria. A list of criteria has been made manageable through the process of elimination.Action Priority Matrix
 An action priority matrix is a productivity tool that helps businesses prioritize certain tasks and objectives over others. The matrix itself is represented by four quadrants on a typical cartesian graph. These quadrants are plotted against the effort required to complete a task (x-axis) and the impact (benefit) that each task brings once completed (y-axis). This matrix helps assess what projects need to be undertaken and the potential impact for each.TOWS Matrix
 The TOWS Matrix is an acronym for Threats, Opportunities, Weaknesses, and Strengths. The matrix is a variation on the SWOT Analysis, and it seeks to address criticisms of the SWOT Analysis regarding its inability to show relationships between the various categories.GE McKinsey Matrix
 The GE McKinsey Matrix was developed in the 1970s after General Electric asked its consultant McKinsey to develop a portfolio management model. This matrix is a strategy tool that provides guidance on how a corporation should prioritize its investments among its business units, leading to three possible scenarios: invest, protect, harvest, and divest.BCG Matrix
 In the 1970s, Bruce D. Henderson, founder of the Boston Consulting Group, came up with The Product Portfolio (aka BCG Matrix, or Growth-share Matrix), which would look at a successful business product portfolio based on potential growth and market shares. It divided products into four main categories: cash cows, pets (dogs), question marks, and stars.Growth Matrix
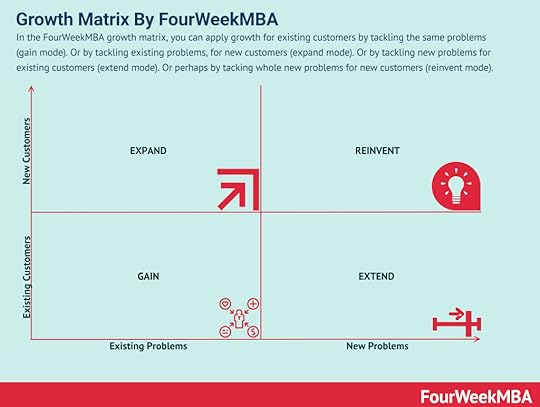 In the FourWeekMBA growth matrix, you can apply growth for existing customers by tackling the same problems (gain mode). Or by tackling existing problems, for new customers (expand mode). Or by tackling new problems for existing customers (extend mode). Or perhaps by tackling whole new problems for new customers (reinvent mode).Ansoff Matrix
 You can use the Ansoff Matrix as a strategic framework to understand what growth strategy is more suited based on the market context. Developed by mathematician and business manager Igor Ansoff, it assumes a growth strategy can be derived by whether the market is new or existing, and the product is new or existing.
Main Free Guides:
Business ModelsBusiness StrategyBusiness DevelopmentDigital Business ModelsDistribution ChannelsMarketing StrategyPlatform Business ModelsTech Business ModelThe post What Is The Stereotype Content Model? The Stereotype Content Model In A Nutshell appeared first on FourWeekMBA.
September 3, 2021
What is the Holmes and Rahe stress scale? The Holmes and Rahe stress scale in a nutshell
The Holmes and Rahe stress scale was developed by psychiatrists Thomas Holmes and Richard Rahe in 1967. The pair wanted to know if the most stressful life events could predict future illness. The Holmes and Rahe stress scale is a list of 43 stressful situations an individual can experience that can lead to illness.
Understanding the Holmes and Rahe stress scaleAfter examining the medical records of 5,000 patients, Holmes and Rahe discovered a strong correlation between illness and the most stressful life events. These situations were then ranked on a scale from most stressful to least stressful, providing clarity on the sort of life situations deleterious to human health.
The reliability of the scale was then tested in 1970 with a study involving 2,500 U.S. Navy personnel. Rahe asked each sailor to rank their most stressful life events and then monitored them for six months to see if any event correlated with visits to the doctor. Once again, Rahe found that the more stressful an event, the higher likelihood of illness.
The top ten most stressful events on the Holmes and Rahe scaleHolmes and Rahe found a total of 43 events contributing to illness. Each event was assigned a specific life change unit score according to how traumatic it was felt across a large sample of study participants.
For the sake of brevity, we will take a look at the top twenty events and their associated score below:
Death of a spouse or child – 100 units.Divorce – 73 units.Marital separation – 65 units.Detention in jail or related institution – 63 units.Death of a close family member – 63 units.Major personal injury or illness – 53 units.Marriage – 50 units.Being fired from employment – 47 units.Marital reconciliation – 45 units.Retirement from work – 45 units.Major change in the health or behavior of a family member – 44 units.Pregnancy – 40 units.Sexual difficulties – 39 units.Gaining a new family member through birth, adoption, etc. – 39 units.Major business readjustment – 39 units.Major change in financial state, such as a windfall or bankruptcy – 38 units.Death of a close friend – 37 units.Changing to a different line of work – 36 units.Major change in the number of spousal arguments regarding child-rearing, personal habits, and so forth – 35 units.Taking on a home or business loan – 31 units.Calculating stress levels and the risk of illnessTo calculate stress levels and the associated risk of illness, the individual must run through the list of events and determine how many they’ve been subject to in the last twelve months. If the same event occurred twice, then it should be counted twice.
Then, the life change unit score for each should be added together to form a total score.
For scores over 300, there is an 80% chance of illness.For scores between 150-299, there is a 50% chance of illness.For scores of less than 150, there is a 30% chance of illness.The types of illnesses stress can cause are not overly surprising. They may include chronic back and neck pain, obesity, depression, diabetes, anxiety, and gastrointestinal disorders. Chronic stress can also accelerate the aging process and the progression of Alzheimer’s disease.
Key takeaways:The Holmes and Rahe stress scale describes a list of 43 stressful situations an individual can experience that can lead to illness. It was developed by psychiatrists Thomas Holmes and Richard Rahe in 1967.The Holmes and Rahe stress scale is backed by several studies which resulted in a list of 43 stressful life events. The top five most stressful situations are the death of a spouse or child, marital divorce, marital separation, jail, and the death of a close family member.The Holmes and Rahe stress scale estimates the likelihood of becoming ill based on the total life change unit score for events experienced in a twelve-month period.Main Free Guides:
Business ModelsBusiness StrategyBusiness DevelopmentDigital Business ModelsDistribution ChannelsMarketing StrategyPlatform Business ModelsTech Business ModelThe post What is the Holmes and Rahe stress scale? The Holmes and Rahe stress scale in a nutshell appeared first on FourWeekMBA.
What Is The Grand Strategy Matrix? The Grand Strategy Matrix In A Nutshell
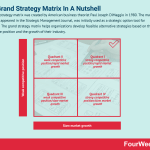
The grand strategy matrix was created by American business theorist Paul Joseph DiMaggio in 1980. The matrix, which first appeared in the Strategic Management Journal, was initially used as a strategic option tool for managers. The grand strategy matrix helps organizations develop feasible alternative strategies based on their competitive position and the growth of their industry.
Understanding the grand strategy matrixLater, the approach became popular with business strategists who believed it was useful for any business operating during very early or very late phases of the industry life cycle.
In truth, the grand strategy matrix reveals feasible strategic options for virtually any business – regardless of its industry, size, or life cycle stage. It is one of several similar tools including the SWOT analysis, SPACE matrix, BCG matrix, and IE matrix.
The four quadrants of the grand strategy matrixThe grand strategy matrix consists of a graph containing four quadrants, with:
Competitive position represented on the x-axis, with the left side of the matrix indicating weak competitiveness and the right side strong competitiveness.Market growth represented on the y-axis, with the top of the matrix indicating rapid growth and the bottom indicating slow growth.Depending on the degree of competitiveness and market growth, the business will occupy one of four quadrants. Collectively, the quadrants model four broad strategic options that it can use to meet its needs at a particular point in time.
With that said, let’s take a look at each quadrant below:
Quadrant I (strong competitive position/rapid market growth) – companies located in this quadrant enjoy an excellent strategic position. This enables them to focus resources on market development, market penetration, and product development. Here, maintaining a dominant position should be the priority.Quadrant II (weak competitive position/rapid market growth) – companies in the second quadrant need to determine why they are unable to compete in a rapidly growing market. To improve their competitive position, strategies such as market development, market penetration, horizontal integration, and decentralization should be considered.Quadrant III (weak competitive position/slow market growth) – in this quadrant, the business is dealing with an unenviable combination of strong competition and lackluster market growth. As a result, major action is required. This may include retrenchment, diversification, or in some cases, liquidation.Quadrant IV (strong competitive position/slow market growth) – these organizations should consider diversification into untapped markets by leveraging their existing resources. Diversification may be horizontal, vertical, or conglomerate. The excess of resources may also be channeled into joint ventures.Key takeaways:The grand strategy matrix generates feasible business strategies based on competitive position and industry growth. It was released by business theorist Paul Joseph DiMaggio in 1980.The grand strategy matrix can be used by any business regardless of size, industry, or life cycle stage.The grand strategy matrix is divided into four quadrants, with each based on varying degrees of competitive position and industry growth. The first quadrant favors strategies that maintain competitive advantage, while the remaining three focus on strengthening it with suitable courses of action.Other Business MatricesSFA MatrixThe SFA matrix is a framework that helps businesses evaluate strategic options. Gerry Johnson and Kevan Scholes created the SFA matrix to help businesses evaluate their strategic options before committing. Evaluation of strategic opportunities is performed by considering three criteria that make up the SFA acronym: suitability, feasibility, and acceptability.Hoshin Kanri X-MatrixThe Hoshin Kanri X-Matrix is a strategy deployment tool that helps businesses achieve goals over the short and long term. Hoshin Kanri is a method that seeks to bridge the gap between strategy and execution. Strategic objectives are clearly defined and the goals of every level of the organization are aligned. With everyone moving in the same direction, process coordination and decision-making ability are strengthened.Kepner-Tregoe Matrix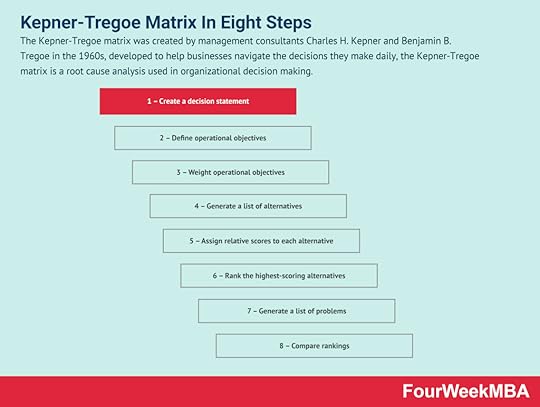 The Kepner-Tregoe matrix was created by management consultants Charles H. Kepner and Benjamin B. Tregoe in the 1960s, developed to help businesses navigate the decisions they make daily, the Kepner-Tregoe matrix is a root cause analysis used in organizational decision making.Eisenhower MatrixThe Eisenhower Matrix is a tool that helps businesses prioritize tasks based on their urgency and importance, named after Dwight D. Eisenhower, President of the United States from 1953 to 1961, the matrix helps businesses and individuals differentiate between the urgent and important to prevent urgent things (seemingly useful in the short-term) cannibalize important things (critical for long-term success).Decision Matrix
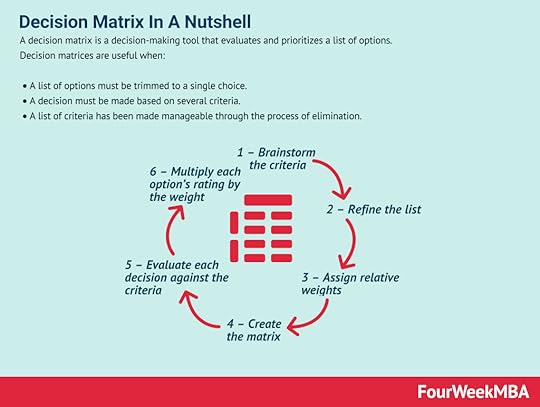 A decision matrix is a decision-making tool that evaluates and prioritizes a list of options. Decision matrices are useful when: A list of options must be trimmed to a single choice. A decision must be made based on several criteria. A list of criteria has been made manageable through the process of elimination.Action Priority MatrixAn action priority matrix is a productivity tool that helps businesses prioritize certain tasks and objectives over others. The matrix itself is represented by four quadrants on a typical cartesian graph. These quadrants are plotted against the effort required to complete a task (x-axis) and the impact (benefit) that each task brings once completed (y-axis). This matrix helps assess what projects need to be undertaken and the potential impact for each.TOWS Matrix
 The TOWS Matrix is an acronym for Threats, Opportunities, Weaknesses, and Strengths. The matrix is a variation on the SWOT Analysis, and it seeks to address criticisms of the SWOT Analysis regarding its inability to show relationships between the various categories.GE McKinsey Matrix
 The GE McKinsey Matrix was developed in the 1970s after General Electric asked its consultant McKinsey to develop a portfolio management model. This matrix is a strategy tool that provides guidance on how a corporation should prioritize its investments among its business units, leading to three possible scenarios: invest, protect, harvest, and divest.BCG Matrix
 In the 1970s, Bruce D. Henderson, founder of the Boston Consulting Group, came up with The Product Portfolio (aka BCG Matrix, or Growth-share Matrix), which would look at a successful business product portfolio based on potential growth and market shares. It divided products into four main categories: cash cows, pets (dogs), question marks, and stars.Growth MatrixIn the FourWeekMBA growth matrix, you can apply growth for existing customers by tackling the same problems (gain mode). Or by tackling existing problems, for new customers (expand mode). Or by tackling new problems for existing customers (extend mode). Or perhaps by tackling whole new problems for new customers (reinvent mode).Ansoff MatrixYou can use the Ansoff Matrix as a strategic framework to understand what growth strategy is more suited based on the market context. Developed by mathematician and business manager Igor Ansoff, it assumes a growth strategy can be derived by whether the market is new or existing, and the product is new or existing.
Main Free Guides:
Business ModelsBusiness StrategyBusiness DevelopmentDigital Business ModelsDistribution ChannelsMarketing StrategyPlatform Business ModelsTech Business ModelThe post What Is The Grand Strategy Matrix? The Grand Strategy Matrix In A Nutshell appeared first on FourWeekMBA.
What Is An Ikigai Diagram? The Ikigai Diagram In A Nutshell
Ikigai is a Japanese philosophy combining the terms iki, meaning “life” or “alive”, and gai, meaning “worth” or “benefit”. Together, these terms describe life’s purpose or meaning. In many English-speaking countries, ikigai is defined as a reason to get out of bed in the morning. An ikigai diagram is a powerful framework based on Japanese philosophy for discovering one’s life purpose.
Understanding ikigaiIkigai is thought to have evolved from the basic health and wellness principles of traditional Japanese medicine. Specifically, that physical health is connected to mental health and a sense of life purpose.
Japanese psychologist Michiko Kumano argued ikigai is a state of wellbeing derived from devotion to activities one finds fulfilling and enjoyable. Kumano also compared ikigai to eudaimonia – an ancient Greek concept describing lasting happiness from a life well-lived. The philosophy has also found use in modern cognitive-behavioral science, with the pursuit or mastery of enjoyable activities known to alleviate depression.
The four components of an ikigai diagramThe ikigai diagram was created by mentor and speaker Marc Winn who represented the philosophy as a Venn diagram.
Many practitioners suggest Winn’s diagram is a westernized misinterpretation of the concept. This may be true, but we can still learn some important lessons from it.
As with all Venn diagrams, the ikigai diagram uses overlapping circles to illustrate the relationships between two or more factors.
Let’s take a look at them now:
Circle 1 – that which one loves, or the things we derive the most joy from experiencing. Circle 2 – that which the world needs. This may be something a small community needs, or humanity in general. Circle 3 – that which one can be paid for. Not all passions or joyful experiences can be monetized.Circle 4 – that which one is good at, including hobbies, skills, talents, or capabilities.With that in mind, below is a look at how each circle overlaps:
Where circle 1 and circle 2 overlap, an individual finds their mission.Where circle 2 and circle 3 overlap, an individual finds their vocation.Where circle 3 and circle 4 overlap, an individual finds their profession.Where circle 4 and circle 1 overlap, an individual finds their passion.Where mission, vocation, profession, and passion overlap in the center of the diagram, one finds their ikigai or life purpose. Some key points about ikigai and ikigai diagramsHere are some things an individual should keep in mind when attempting to discover their life purpose.
Ikigai is not all work and moneyFirstly, there is no requirement that ikigai be related to work or money. Many Japanese people pursue their ikigai for as long as their health allows, which may be related to family, a dream, or simply the spiritual belief that life is worth living.
Removing work from the equation means the third circle should also be removed from the diagram.
Ikigai should never be overwhelmingSociety places a lot of pressure on people in the West to find their singular life purpose. What’s more, their purpose must be ground-breaking, extraordinary, and unique.
In the East, ikigai is more humble. Instead of a single, lofty goal, there is more of an emphasis on process, immersion, mastery, and sharing this excellence with others.
Ikigai can change or evolve over timeFollowing on from the previous point, one’s life purpose can be tweaked or changed at any point in life. There is no need to blindly adhere to something no longer working.
The Japanese consider ikigai as something that evolves as people evolve. Many may have several life purposes for this very reason and never let the prospect of change hinder the enjoyment of life.
Key takeaways:An ikigai diagram is a powerful framework for discovering one’s life purpose by considering Japanese philosophy.An ikigai diagram is a western misinterpretation of the original Japanese concept. Nevertheless, it remains an important way to help clarify life purpose. This purpose can be found at the intersection of four circles: what one loves, what the world needs, what one can be paid for, and what one is good at.There is no requirement for an ikigai diagram to produce a life purpose dominated by work or money. Practitioners who want to develop an ikigai based on family or spirituality can simply omit the third circle from the diagram.Other Lean Manufacturing FrameworksToyota Production System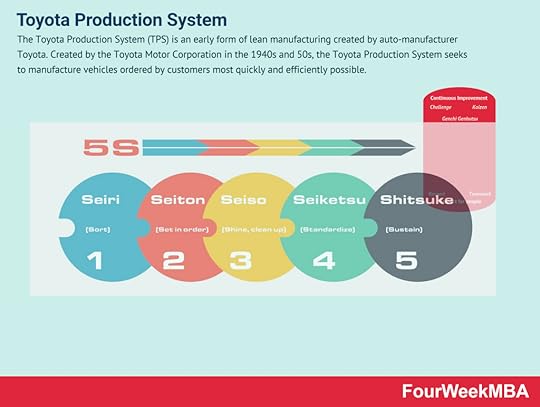 The Toyota Production System (TPS) is an early form of lean manufacturing created by auto-manufacturer Toyota. Created by the Toyota Motor Corporation in the 1940s and 50s, the Toyota Production System seeks to manufacture vehicles ordered by customers most quickly and efficiently possible.Gemba Walk
 A Gemba Walk is a fundamental component of lean management. It describes the personal observation of work to learn more about it. Gemba is a Japanese word that loosely translates as “the real place”, or in business, “the place where value is created”. The Gemba Walk as a concept was created by Taiichi Ohno, the father of the Toyota Production System of lean manufacturing. Ohno wanted to encourage management executives to leave their offices and see where the real work happened. This, he hoped, would build relationships between employees with vastly different skillsets and build trust.Kaizen Approach
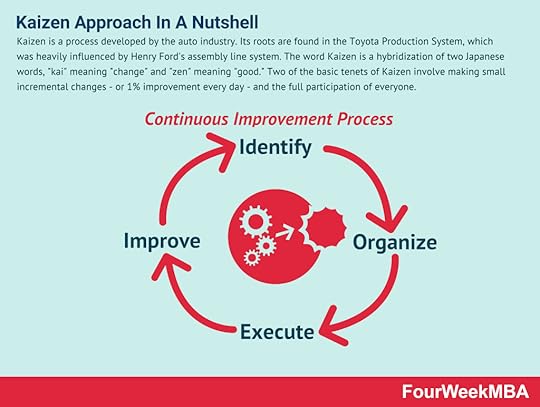 Kaizen is a process developed by the auto industry. Its roots are found in the Toyota Production System, which was heavily influenced by Henry Ford’s assembly line system. The word Kaizen is a hybridization of two Japanese words, “kai” meaning “change” and “zen” meaning “good.” Two of the basic tenets of Kaizen involve making small incremental changes – or 1% improvement every day – and the full participation of everyone. Poka-yoke
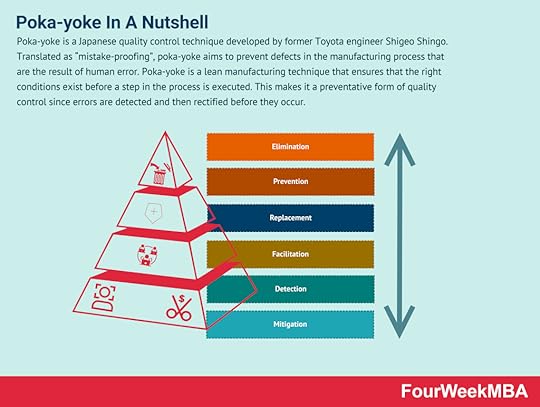 Poka-yoke is a Japanese quality control technique developed by former Toyota engineer Shigeo Shingo. Translated as “mistake-proofing”, poka-yoke aims to prevent defects in the manufacturing process that are the result of human error. Poka-yoke is a lean manufacturing technique that ensures that the right conditions exist before a step in the process is executed. This makes it a preventative form of quality control since errors are detected and then rectified before they occur.Scrum
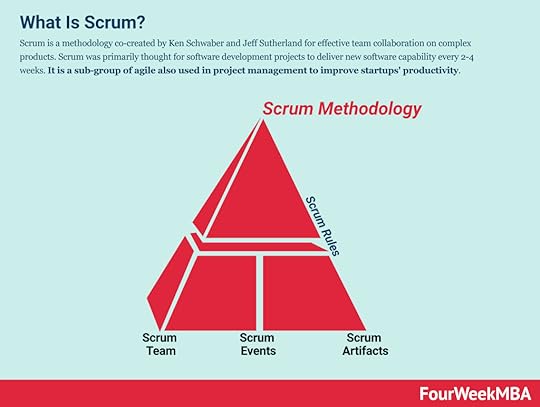 Scrum is a methodology co-created by Ken Schwaber and Jeff Sutherland for effective team collaboration on complex products. Scrum was primarily thought for software development projects to deliver new software capability every 2-4 weeks. It is a sub-group of agile also used in project management to improve startups’ productivity.Six Sigma
 Six Sigma is a data-driven approach and methodology for eliminating errors or defects in a product, service, or process. Six Sigma was developed by Motorola as a management approach based on quality fundamentals in the early 1980s. A decade later, it was popularized by General Electric who estimated that the methodology saved them $12 billion in the first five years of operation.Value Stream Mapping
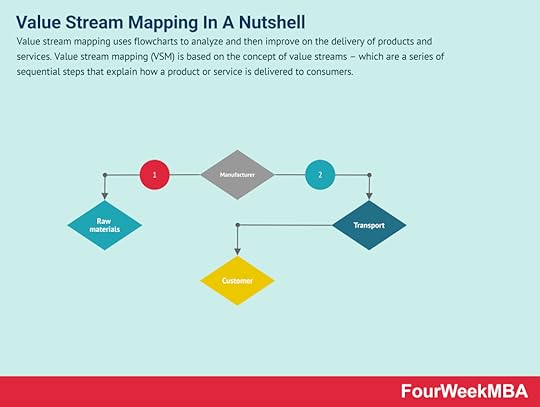 Value stream mapping uses flowcharts to analyze and then improve on the delivery of products and services. Value stream mapping (VSM) is based on the concept of value streams – which are a series of sequential steps that explain how a product or service is delivered to consumers.Kanban Framework
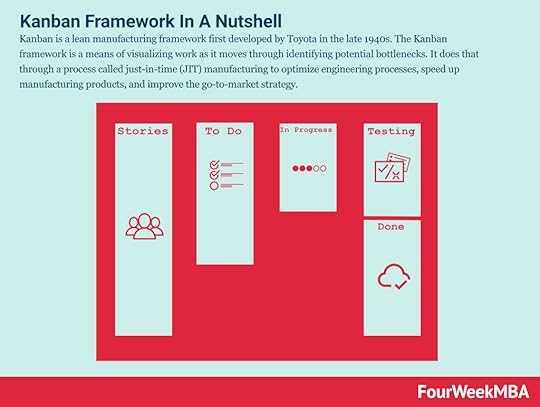 Kanban is a lean manufacturing framework first developed by Toyota in the late 1940s. The Kanban framework is a means of visualizing work as it moves through identifying potential bottlenecks. It does that through a process called just-in-time (JIT) manufacturing to optimize engineering processes, speed up manufacturing products, and improve the go-to-market strategy.SMART Goals
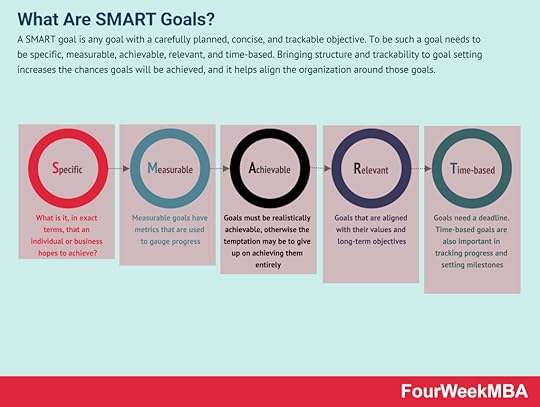 A SMART goal is any goal with a carefully planned, concise, and trackable objective. To be such a goal needs to be specific, measurable, achievable, relevant, and time-based. Bringing structure and trackability to goal setting increases the chances goals will be achieved, and it helps align the organization around those goals.TQM Framework
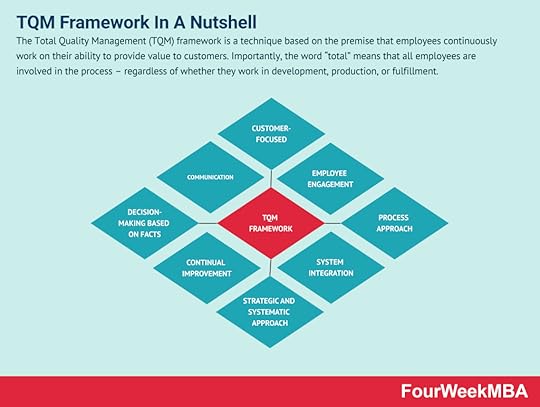 The Total Quality Management (TQM) framework is a technique based on the premise that employees continuously work on their ability to provide value to customers. Importantly, the word “total” means that all employees are involved in the process – regardless of whether they work in development, production, or fulfillment.
Main Free Guides:
Business ModelsBusiness StrategyBusiness DevelopmentDigital Business ModelsDistribution ChannelsMarketing StrategyPlatform Business ModelsTech Business ModelThe post What Is An Ikigai Diagram? The Ikigai Diagram In A Nutshell appeared first on FourWeekMBA.


