
Menzie David Chinn's Blog, page 38
April 8, 2015
No Time for Scientists – Wisconsin Edition
With apologies to Mac Hyman …and Andy Griffith
Leaders at the Department of Natural Resources (DNR) are proposing elimination of the Bureau of Science Services within the department.
From WisconsinWatch:
In a Feb. 25 email, Scott Hull, a section chief in the Bureau of Science Services, asked Mark Aquino, director of the agency’s Office of Business Support and Science, for clarification on remarks made by Secretary Cathy Stepp on a radio show about possible budget cuts and personnel changes for the bureau.
In his Feb. 26 response, Aquino informed Hull that the agency “will go through some form of organizational change that will result in not having a Bureau of Science Services, in an effort to address the legislative perception of research not being well aligned with program needs.”
Why?
The agency’s Bureau of Science Services has recently drawn criticism from state Sen. Tom Tiffany, R-Hazelhurst. Tiffany criticized a bureau report on environmental concerns surrounding the now-defunct plan from Gogebic Taconite to build an open-pit iron mine in northwestern Wisconsin. He said the report was biased against the mine.
Tiffany also told the Milwaukee Journal Sentinel that he was not supportive of the bureau doing research related to climate change because the science behind global warming is still “theoretical.”
According to the article, supporters of the Governor’s proposed cuts to the DNR Science Bureau argued that some of the scientific analysis could be undertaken by UW. To me this seems highly unlikely to occur given impending cuts to state funding of the UW system, in addition to the fact that the type of research conducted by DNR is substantially different from basic research conducted at the University (as discussed in the article).
The Governor’s budget proposal for DNR is discussed in an earlier article from February, and here.
Update: In another advance for open dialog, the words “climate change” cannot be included in discussions by certain Wisconsin state employees, at the behest of the Wisconsin State Treasurer (currently a Republican). See Bloomberg.


April 7, 2015
Ed Lazear on the Current Outlook
From CNBC yesterday:
A government jobs report, like the one for March, that’s so out of whack compared to expectations usually sparks admonishments from market watchers not to make too much out of any single monthly data set.
But leading labor economist Ed Lazear said Monday that this time is different. “The reason I pay a little bit more attention to this one, it’s not just one month, it’s a series of indicators—almost all of which—are pointing in the same direction.”
I wondered what indicators Professor Lazear was speaking of. Instead of downloading a whole set, I retrieved from FRED four key indicators cited by the NBER BCDC in dating the 2001 recession (the set is larger in recent trough dating, see here), available as of 4/7.
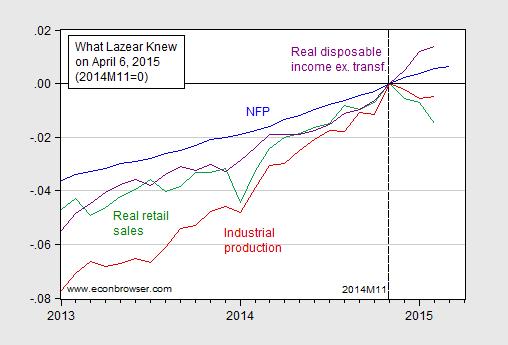
Figure 1: Log nonfarm payroll employment (blue), industrial production (red), real retail sales (green) and real personal income ex.-transfers (purple), all normalized to 2014M11 = 0. Source: BLS, Federal Reserve Board, St. Louis Fed, and BEA via FRED, and author’s calculations.
NFP and real disposable income continue to rise, while industrial production and real retail sales have declined in recent months. Now if one is worried by this picture (and I am slightly), one should’ve been very worried by this one (first included in this post).
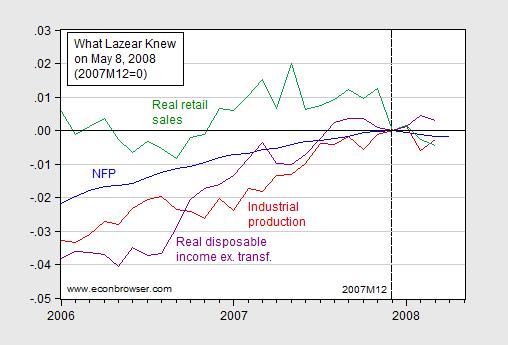
Figure 2: Log nonfarm payroll employment (blue), industrial production (red), real retail sales (green), and real disposable income excluding transfers (purple), all normalized to zero at 2007M12; data available as of May 8, 2008. Source: St. Louis Fed ALFRED database, and author’s calculations.
And yet, knowing these data, Professor Lazear, in his capacity as CEA Chair stated on May 8th, in somewhat less circumspect terms:
“The data are pretty clear that we are not in a recession.”
(This is a quote from a WSJ article entitled “Lazear Sees No Recession for U.S. Economy”.)
Additional data on overall economic activity is shown in Figure 3.
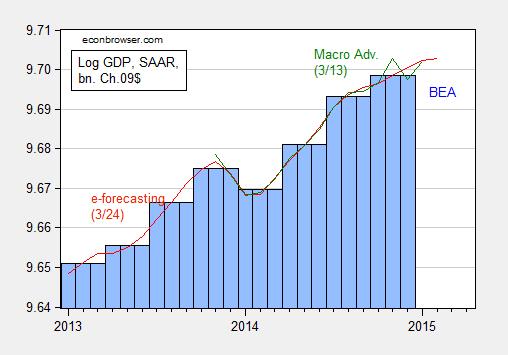
Figure 3: Log GDP from BEA (blue bar), and from e-forecasting on 3/24 (red), and from Macroeconomic Advisers on 3/13 (green), all in bn. Ch.2009$ SAAR. Source: BEA 2014Q4 3rd release, e-forecasting, Macroeconomic Advisers, and author’s calculations.
The NBER BCDC refers to GDP and the Macroeconomic Advisers monthly series in dating peaks and troughs. Those indicators seem to point against a downturn (but, recalling the cautionary tale of Don Luskin, I won’t say a downturn is impossible!).
If one were worried about recession, then one illuminating time series is the behavior of the term spread, which as I have recently noted has some predictive power for future growth, as well as recessions (based on Chinn and Kucko, 2015).
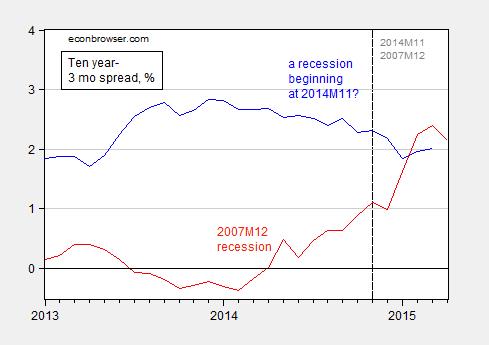
Figure 4: Ten year minus three month Treasury spread (blue), and normalized to the 2007M12 recession (red), in %. Source: FRED and author’s calculations.
The ten year-3 month spread went negative in August 2006, 16 months before the recession’s beginning (according to NBER). The ten year-3 month spread has not yet inverted (and using the shadow Fed funds rate would make the spread larger, not smaller).
On one point, Professor Lazear and I agree — it is too early for the Fed to start increasing the policy rate.
IMF World Economic Outlook on Potential GDP, Investment
The analytical chapters in the IMF’s semi-annual World Economic Outlook were released today (outlook chapters follow next week). The topics covered were:
Where Are We Headed? Perspectives on Potential Output This chapter finds that potential output growth across advanced and emerging market economies has declined in recent years. In advanced economies, this decline started as far back as the early 2000s and worsened with the global financial crisis. In emerging market economies, in contrast, it began only after the crisis. The chapter’s analysis suggests that potential output growth in advanced economies is likely to increase slightly from current rates as some crisis-related effects wear off, but to remain below precrisis rates in the medium term. The main reasons are aging populations and the gradual increase in capital growth from current rates as output and investment recover from the crisis. In contrast, in emerging market economies, potential output growth is expected to decline further, owing to aging populations, weaker investment, and lower total factor productivity growth as these economies catch up to the technological frontier.
Private Investment: What’s the Holdup? Private fixed investment in advanced economies contracted sharply during the global financial crisis, and there has been little recovery since. Investment has generally slowed more gradually in the rest of the world. Although housing investment fell especially sharply during the crisis, business investment accounts for the bulk of the slump, and the overriding factor holding it back has been the overall weakness of economic activity. In some countries, other contributing factors include financial constraints and policy uncertainty. These findings suggest that addressing the general weakness in economic activity is crucial for restoring growth in private investment.
April 5, 2015
2015 Econbrowser NCAA tournament winner
Congratulations to Joseph, winner of this year’s . Even though the championship game has yet to be played, using high-level mathematics I have deduced that no one can catch Joseph’s lead, no matter who wins Monday’s game. Hats off to Joseph, and many others of you who answered, yes, Wisconsin could beat Kentucky.
Two number one seeds meet in the finals, just as I predicted. Unfortunately, I had the wrong pair!
World interest rates
Ben Bernanke has joined the blogosphere, offering an invaluable resource for anyone wanting to understand recent economic developments. Last week he had a series of articles examining factors behind the very low real interest rates on long-term bonds.
One interpretation of current low interest rates is that we have moved into an era in which the long-term real return to capital is near zero as a result of factors such as fewer investment opportunities, slower population and productivity growth, and falling labor force participation. Larry Summers argued that the U.S. was only able to achieve satisfactory GDP growth over 2002-2007 as a result of an unsustainable housing bubble and that the strong economic growth of the 1990’s was also partly powered by the tech stock bubble. Larry has elsewhere suggested:
Suppose that the short-term real interest rate that was consistent with full employment had fallen to negative two or negative three percent in the middle of the last decade. Then … we may well need, in the years ahead, to think about how we manage an economy in which the zero nominal interest rate is a chronic and systemic inhibitor of economy activity, holding our economies back below their potential.
But last week Bernanke outlined some of the reasons he is not convinced by Summers:
I generally agree with the recent critique of secular stagnation by Jim Hamilton, Ethan Harris, Jan Hatzius, and Kenneth West. In particular, they take issue with Larry’s claim that we have never seen full employment during the past several decades without the presence of a financial bubble. They note that the bubble in tech stocks came very late in the boom of the 1990s, and they provide estimates to show that the positive effects of the housing bubble of the 2000’s on consumer demand were largely offset by other special factors, including the negative effects of the sharp increase in world oil prices and the drain on demand created by a trade deficit equal to 6 percent of US output. They argue that recent slow growth is likely due less to secular stagnation than to temporary “headwinds” that are already in the process of dissipating. During my time as Fed chairman I frequently cited the economic headwinds arising from the aftermath of the financial crisis on credit conditions; the slow recovery of housing; and restrictive fiscal policies at both the federal and the state and local levels (for example, see my August and November 2012 speeches.)
My greatest concern about Larry’s formulation, however, is the lack of attention to the international dimension. He focuses on factors affecting domestic capital investment and household spending. All else equal, however, the availability of profitable capital investments anywhere in the world should help defeat secular stagnation at home. The foreign exchange value of the dollar is one channel through which this could work: If US households and firms invest abroad, the resulting outflows of financial capital would be expected to weaken the dollar, which in turn would promote US exports…. Increased exports would raise production and employment at home, helping the economy reach full employment. In short, in an open economy, secular stagnation requires that the returns to capital investment be permanently low everywhere, not just in the home economy.
In a subsequent post, Bernanke takes a look at those global factors. In 2005 he had noted that global saving and investment flows were reversed from what one might normally expect, with the emerging economies and oil-exporting economies (where one might have thought investment opportunities should be most abundant) having surplus savings with the funds being lent to the developed economies. Bernanke described this situation as a “global saving glut” that contributed to low world interest rates at the time. His blog post last week revisits this issue and notes some important changes since 2005.
Thanks in part to increased domestic oil production, Bernanke notes that the U.S. current account deficit today is significantly smaller than it was in 2005. The periphery European economies have swung from big trade deficits into surplus, while Germany’s surplus has increased. The bottom line is that the developed economies as a group appear to have swung from a position of big deficits into surplus.
At the same time, the surplus of emerging economies has fallen significantly. Latin America has moved from trade surplus to a big trade deficit, China’s saving rate has slowed, and oil producers like Russia have seen a big swing. If oil prices remain at the low levels they reached by the end of 2014, we would surely expect to see further big reductions in the saving from the oil-exporting countries.
By the way, one might wonder how it could be that developed and emerging economies today are supposedly both running a trade surplus. Unless, as Jeff Frankel once facetiously suggested, the earth is currently exporting $587 B in goods and services to other planets, there is a problem with the numbers some of the countries are reporting– the exports that country A claims it sold to country B do not equal the imports that country B claims it bought from A. This is labeled as a “statistical discrepancy” at the bottom of Bernanke’s table. Although these discrepancies are enormous, I think we can correctly infer the broad trends and recognize the direction things are headed at the moment, even if we don’t have full faith in the detailed numbers.
I share Bernanke’s conclusion:
If global imbalances in trade and financial flows do moderate over time, there should be some tendency for global real interest rates to rise, and for US growth to look more sustainable as the outlook for exports improves. To make sure that this happens, the US and the international community should continue to oppose national policies that promote large, persistent current account surpluses and to work toward an international system that delivers better balance in trade and capital flows.
And in his most recent post, Bernanke spells out some of the specific changes he is recommending. He notes that the long-term imbalances within Europe arise from a common currency ill-suited to the different needs of its member states, problems with parallels to those documented by Barry Eichengreen for the 1920s. Bernanke lays out several measures that Germany could take today that could help Germans and everyone else, including increased investment in public infrastructure, raising the wage of German workers, and targeted structural reforms.
The bottom line for investors, whether or not the Germans follow Bernanke’s excellent advice, is this: don’t expect the real interest rate to remain at current negative levels.
April 3, 2015
March Employment: Downward Revisions and Some Sectoral Breakdowns
The March establishment series estimate for nonfarm payroll employment clearly fell far short consensus estimates (release). Here are a couple of quick observations.
Not only was overall employment growth preliminarily estimated to be low; earlier months’ estimates were also revised down.
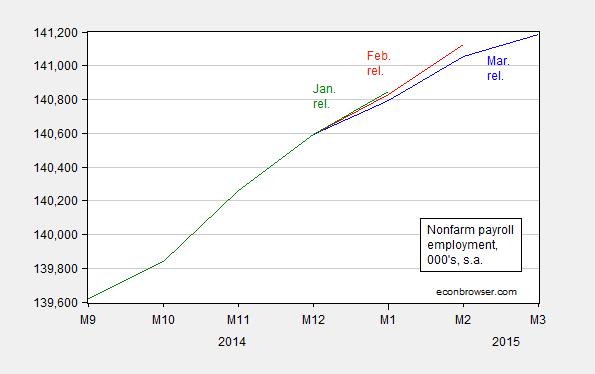
Figure 1: Nonfarm payroll employment in ‘000’s, seasonally adjusted, from March release (blue), from February release (red), and from January release (green). Source: BLS.
One should never put too much weight on one month’s preliminary figures. It’s important to keep in mind that the mean absolute error of the m/m changes going from 1st release to 3rd release is 45,000. [1] Still, lackluster employment growth in this month reinforces my view that we should not be overly concerned about an overheated labor market. In my view, we are still some way from full employment.
To me, the more interesting aspect of the release involves the sectoral breakdown. Some have pointed out the drop in leisure and hospitality employment, which seems unlikely in their view to be sustained. For me, the more worrying aspect is the decline in manufacturing employment over time. In 2015M03, the change is -1 thousand (so doesn’t show up in Figure 2 below).
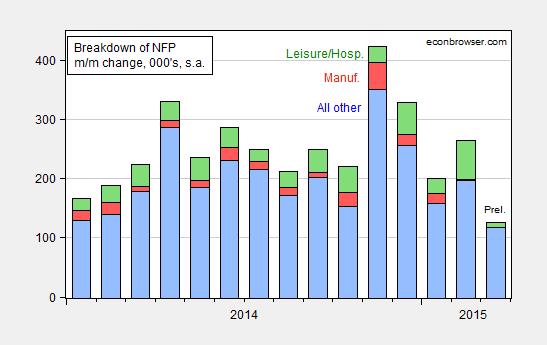
Figure 2: Month on month change in nonfarm payroll employment minus leisure and hospitality and manufacturing, in ‘000’s, seasonally adjusted, from March release (blue), manufacturing (red), and leisure and hospitality (green). Source: BLS and author’s calculations.
This suggests worrying trend in tradables sector economic activity, and hence continued concern about the dollar’s value. [2]
More from McBride/CR, Portlock/WSJ RTE, Mitchell/WSJ RTE, and Tim Duy.
April 1, 2015
Some Conjectures Regarding the Effectiveness of Economic Boycotts
The events surrounding the signing into law of Indiana’s Religious Freedom Restoration Act provide an interesting test case to see if boycotts, or threats thereof, can successfully induce policy changes. I find this an interesting analogue to the ongoing debate whether Western sanctions, particularly “smart sanctions” imposed on Russia, can have an impact.
As Michael Hiltzik has discussed, there have been cancellations of conventions, musical events, and incipient expansions. The most well-known example of a boycott that apparently subsequently induced a change in behavior involved the chain of events that occurred after Governor Meacham’s rescission of the decision to designate a Martin Luther King holiday in Arizona.
In 1990, after Tempe’s Sun Devils Stadium had been awarded the 1993 Super Bowl, Arizona voters rejected a ballot measure designating Martin Luther King Day as a state holiday. Within hours of the vote, the NFL rescinded the game, costing the state an estimated $100 million in economic impact. (The game was played at the Rose Bowl instead.)
This article discusses at greater length the reversal by Arizona voters that brought the Superbowl to Arizona in 1996. In the end, the boycott apparently worked, although that outcome took years to unfold. The article cites an ASU Business School estimate of the economic impact of obtaining the Superbowl at $305.8 million. It’s this experience that Hiltzik (and Koplowitz/IBT) attribute to Arizona Governor Jan Brewer’s veto of a similar bill last year.
Hiltzik comments:
This suggests that the real impact of the Indiana law might unfold over time, in opportunities for growth foregone rather than in tangible losses now. Indiana can probably kiss goodbye to any chance of attracting a large-scale relocation in an industry with a good record on gay rights, such as technology or entertainment. By their nature, however, these losses will be hard to connect directly to the law, unless it’s specifically cited in a corporate decision.
L. Libresco at FiveThirtyEight recounts the evidence and is not as sanguine on boycotts having the intended effect. That being said, I do think that the chances for effecting a discernable change in policy is greater than one might think at first glance. Taking a cue from the recent example of sanctions on Russia, it seems to me the relevant question is not the impact relative to gross state product, but rather how the costs are imposed on key constituencies within the state economy.
In the older literature on the efficacy of economic sanctions, the rule of thumb developed by Hufbauer and Schott et al. was that one needed to inflict an economic loss equivalent to 2% of GDP in order to have some degree of success. If one made an analogy to affecting state economies, one would be hard pressed to conclude that boycotts could inflict a 2% of gross state product loss. Indiana’s nominal gross state product in 2013 (latest available data) was $317 billion, so 1% would be $6.4 billion.
I don’t think that’s the relevant metric. To the extent that businesses are highly mobile between states, and can relatively quickly locate operations and activities in alternate states, the costs on specific groups could be sufficiently high to motivate enough lobbying to alter state policies. That is exactly the idea behind “smart sanctions” in the case of Russia, where many of the sanctions targeted individuals and specific firms, rather than the entire economy (see [1] [2]).
Now, the effectiveness of sanctions in the case of Russia was magnified by the underlying decline in the price of its primary export, oil. In the case of Indiana, the vulnerabilities are not so clear. On the other hand, Indiana’s growth prospects as measured by the Philadelphia Fed’s leading index have been dimming since early 2014, and the leading index now indicates slower growth than all of Indiana’s neighbors (this reading is from the December numbers).
The decision by the Governor of Arkansas to send legislation similar to Indiana’s RFRA back to the legislature signals that the costs of boycotts can be perceived to be measurable to groups with effective lobbying power.
March 31, 2015
Output, Employment and Unemployment: Some Updated and Some New Results
In a previous post, Laurent Ferrara, Valérie Mignon, and I examined the nonlinear relationship between employment and output (based on J.Macro (2014)). Using the most recent data, the level of (establishment) employment now matches the output level. Figure 1 shows the actual level, and the predicted level from a nonlinear error correction model that allows short run dynamics to differ between recession and non-recession regimes.
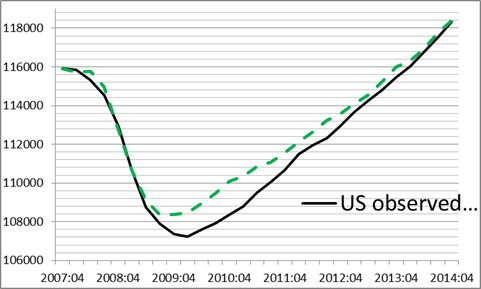
Figure 1: Actual employment (black) and prediction from nonlinear error correction model.
This does not mean that employment is at full employment levels; rather it means that the long run relationship between employment and output has been restored. To the extent that output remains below potential, then employment is still below the corresponding natural rate.
On a related note, Laurent Ferrara and Giulia Sestieri observe (in “US labour market and monetary policy: current debates and challenges”) that the historical relationship between the target Fed funds rate and inflation and long term unemployment indicates a current target rate that remains below zero.
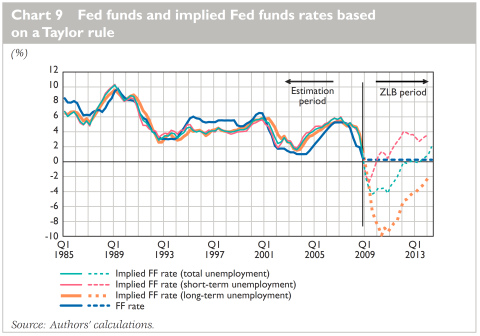
Chart 9 from L. Ferrara and G. Sestieri.
From the article:
This Chart confirms what Janet Yellen has repeated a number of times in her speeches, especially during the period of quantitative forward guidance from December 2012 to December 2013, namely that the unemployment rate is not the only variable to be taken into account by the FOMC in its monetary policy decisions. Indeed, the prescriptions of a standard Taylor rule, based on the total unemployment gap, would have implied a rate increase from the second half of 2013, while a measure of the short-term gap would have implied a rate increase already in 2010. At this point, the specification using the long-term unemployment rate would still prescribe a negative policy rate.
These observations are particularly relevant, in the context of Chair Yellen’s recent speech:
Under normal circumstances, simple monetary policy rules, such as the one proposed by John Taylor, could help us decide when to raise the federal funds rate.3 Even with core inflation running below the Committee’s 2 percent objective, Taylor’s rule now calls for the federal funds rate to be well above zero if the unemployment rate is currently judged to be close to its normal longer-run level and the “normal” level of the real federal funds rate is currently close to its historical average. But the prescription offered by the Taylor rule changes significantly if one instead assumes, as I do, that appreciable slack still remains in the labor market, and that the economy’s equilibrium real federal funds rate–that is, the real rate consistent with the economy achieving maximum employment and price stability over the medium term–is currently quite low by historical standards. Under assumptions that I consider more realistic under present circumstances, the same rules call for the federal funds rate to be close to zero. Moreover, I would assert that simple rules are, well, too simple, and ignore important complexities of the current situation, about which I will have more to say shortly.
The speech is also discussed at length by Tim Duy. My argument for why monetary policy should not yet be tightened here.
March 29, 2015
Oil sands outlook
On Friday I visited the University of Alberta in Edmonton, where falling oil prices have brought a record provincial budget deficit despite aggressive tax increases and spending cuts. Here I pass along some of what I learned about how the plunge in oil prices is affecting Alberta’s oil sands operations.
A couple of factors have cushioned Canadian oil producers slightly from the collapse in oil prices in the U.S. First, while the dollar price of West Texas Intermediate has fallen 45% since June, the Canadian dollar depreciated against the U.S. dollar by 18% over the same period, and now stands at CAD $1.26 per U.S. dollar. Since the costs of the oil sands producers are denominated in Canadian dollars, the currency depreciation is an important offset. There has also been some narrowing of the spread between synthetic and other crudes. As a result of these factors, the University of Alberta’s Andrew Leach calculated that when WTI was selling for US $50 a barrel, Canadian producers were receiving CAD $60 per barrel of synthetic crude.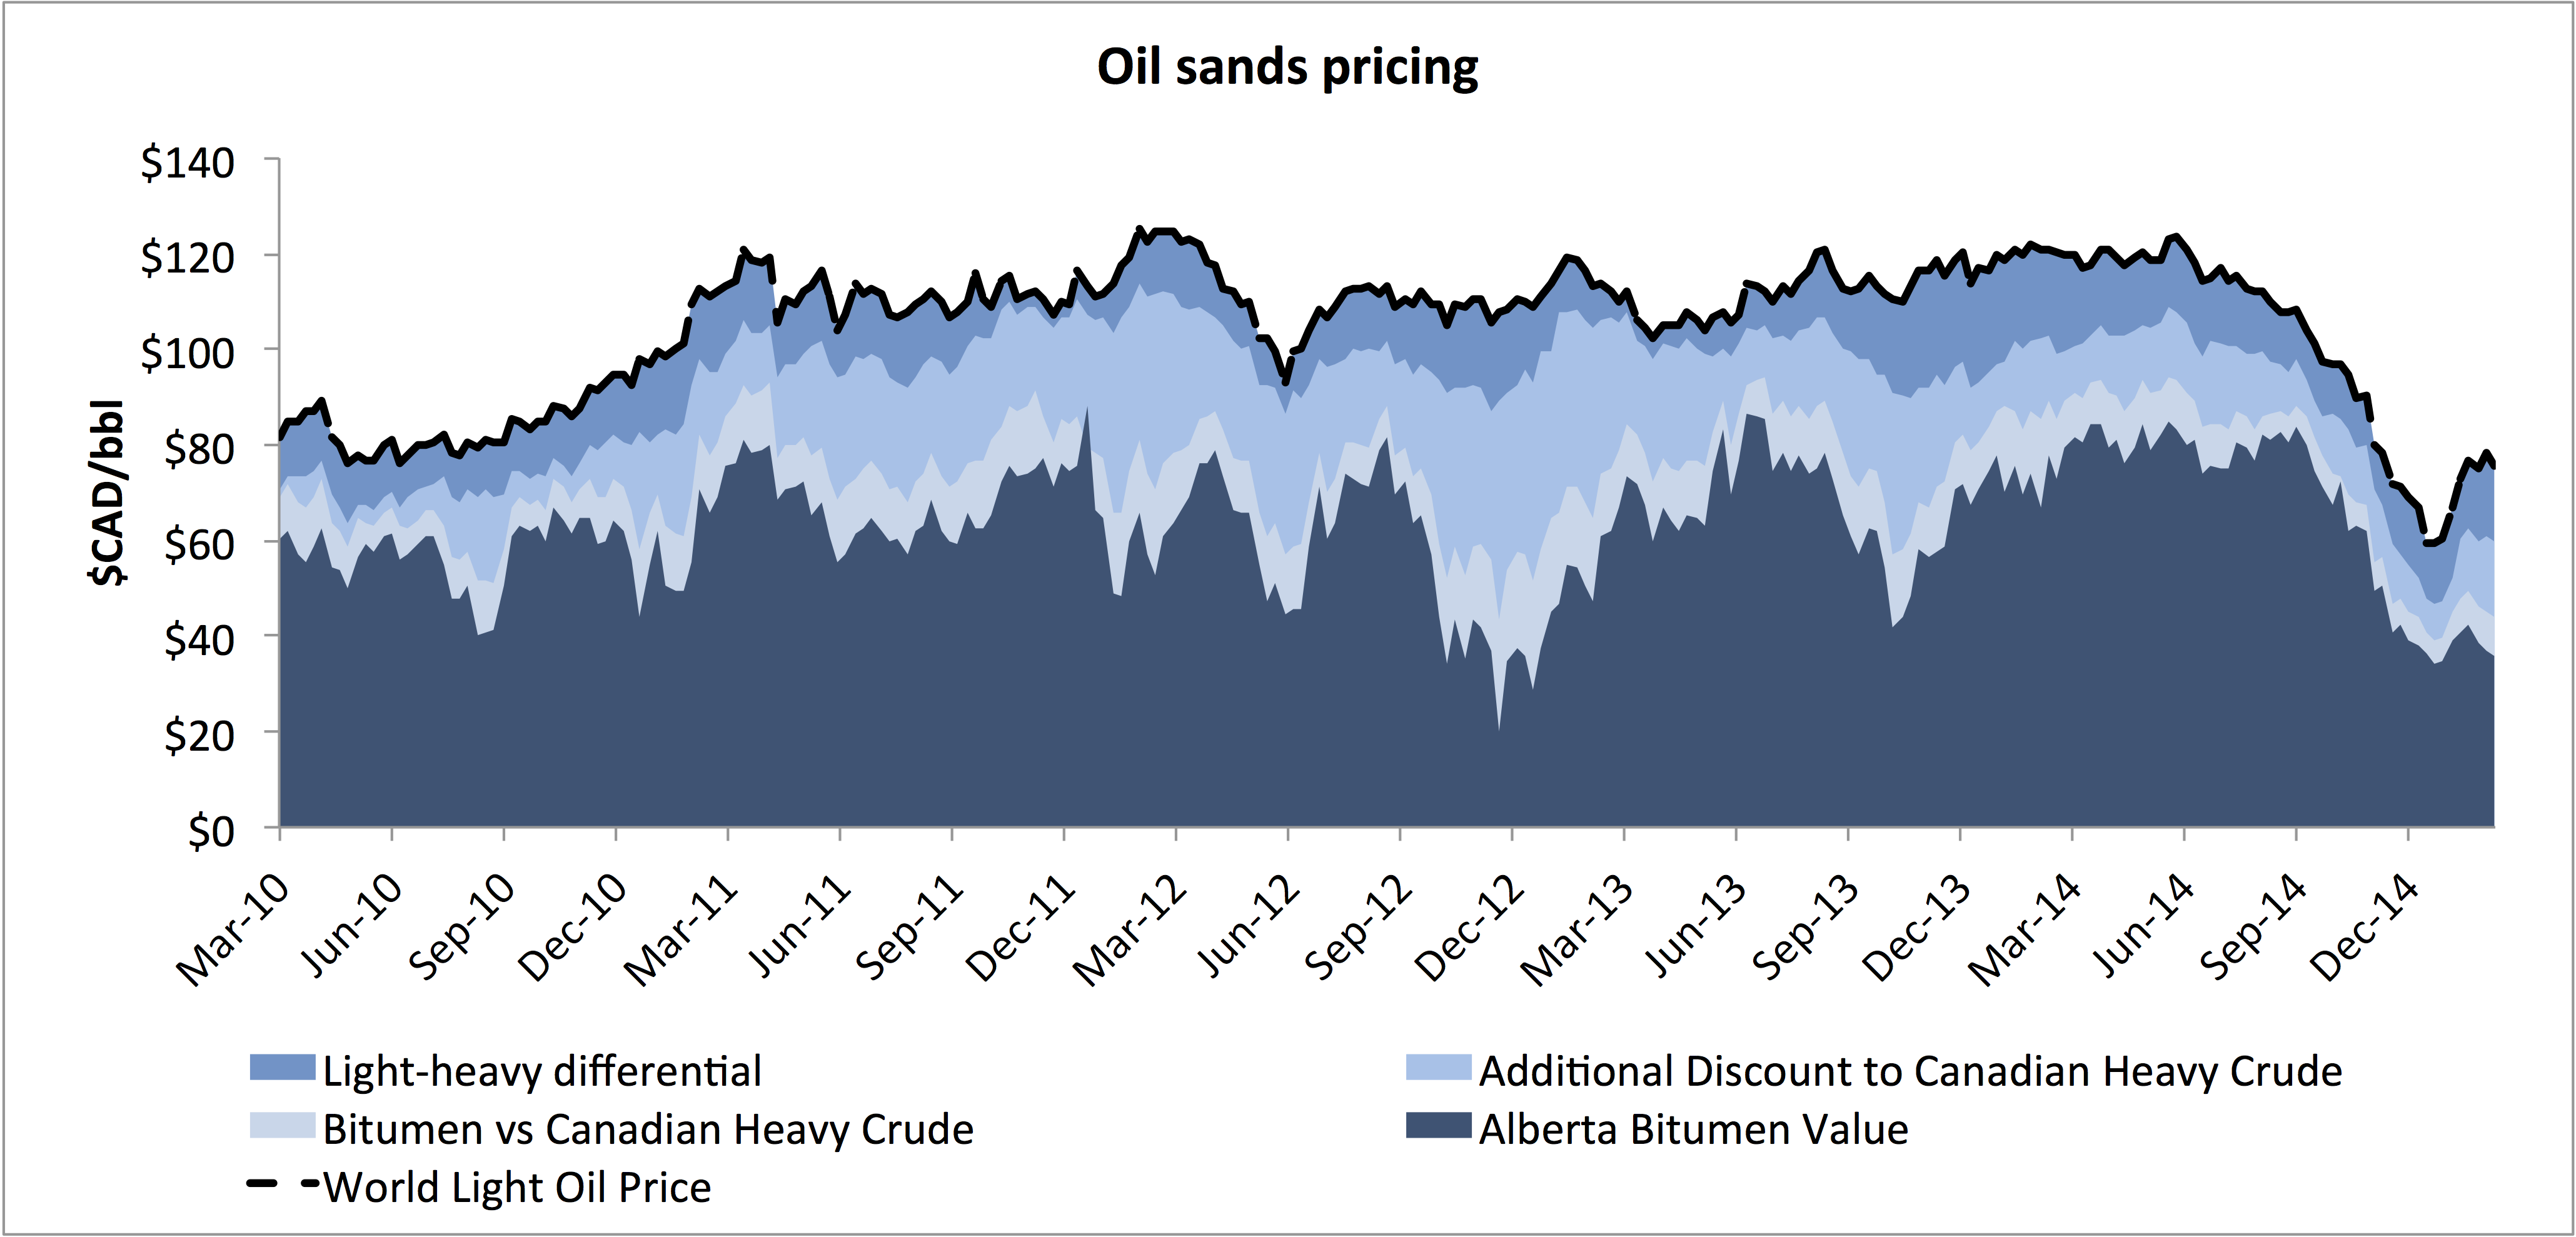
Source: Andrew Leach.
Oil sands and U.S. tight oil production have been the world’s primary marginal oil producers in recent years, by which I mean the key source to which the world could turn in order to get an additional barrel of oil produced. Ultimately in this regime it is the long-run marginal cost of the most costly producing operation that puts a floor under the price of oil. A company with sunk fixed costs will continue to produce even if price is below long-run marginal cost as long as cash flow is greater than current operating expenses. But for anybody considering a new project, the up-front capital costs and required rate of return have to be factored into new decisions. A project won’t be started if price is below the long-run marginal cost.
But oil sands and tight oil are polar opposites in one important respect. Tight oil projects can be up and running with a short lead time and have a short producing life. I expect for this reason that declines in tight oil production could be seen very soon. By contrast, oil sands represent a decades-long investment, meaning that completed projects that cover operating costs, as well as many projects that have already been started but not yet completed, will be producing for a long time. Leach estimates that operating costs are CAD $34.45 barrel for Suncor and CAD $38.31 barrel for the Canadian Natural’s Horizon project. As long as synthetic crude fetches $CAD 60, those operations are not about to shut down. Leach concludes:
So, what does this all mean? Oil sands production will continue to increase in the near term, likely through 2020 if not beyond, unless prices decrease materially relative to today. If they remain as low as they are, there’s certain to be a downward revision in the long-term growth forecasts for oil sands, but don’t expect production to decline in the near term. At today’s prices, industry forecasts of three million barrels per day by 2020 are likely to underestimate production by a bit, but the real kicker will be on the value of that production to all concerned—governments, via taxes and royalties, and shareholders will all suffer much lower returns from this development than they would have expected less than a year ago if prices stay where they are today.
But evidence of retrenchment is nonetheless unmistakable. Last month the Financial Post reported
Producers including Suncor Energy Inc, Cenovus Energy Inc and MEG Energy have slashed 2015 capital expenditures in response to the oil price slump. Wood Mackenzie estimates industry spending will drop by $1.5 billion over the next two years, down 4% from its fourth-quarter 2014 assumptions…. Royal Dutch Shell Plc said it was shelving plans to build the 200,000-bpd Pierre River oilsands mine in northern Alberta, the largest such project to be deferred.
And in another report from March 12:
About 1,000 construction workers employed by a contractor at Husky Energy Inc.’s Sunrise oilsands project were laid off unexpectedly on Wednesday, a union official confirmed…. Suncor Energy Inc said in January that it would cut 1,000 employees and contractors, while Royal Dutch Shell Plc is cutting about 300 from its oilsands operation.
And on Friday the Globe and Mail reported that China’s CNOC decided to write down $842 million in its overseas investments, including extensive investments in Canadian oil sands.
Price cannot exceed long-run marginal cost in equilibrium. But at least in the case of oil sands, it could take a long, long time to reach that equilibrium.
March 28, 2015
Estimates of the Elasticity of Employment with Respect to the Minimum Wage
Some people would have you believe the impact of a minimum wage hike on employment is known to be large and negative. A cursory acquaintance with the literature helps in immunizing one (if one believes in vaccines and the like) against falling for such assertions.
The meta-analysis of Doucouliagos, Hristos, and Tom D. Stanley. “Publication Selection Bias in Minimum-Wage Research? A Meta-Regression Analysis.” British Journal of Industrial Relations 47.2 (2009): 406-428. [ungated working paper version] is useful in this regard.
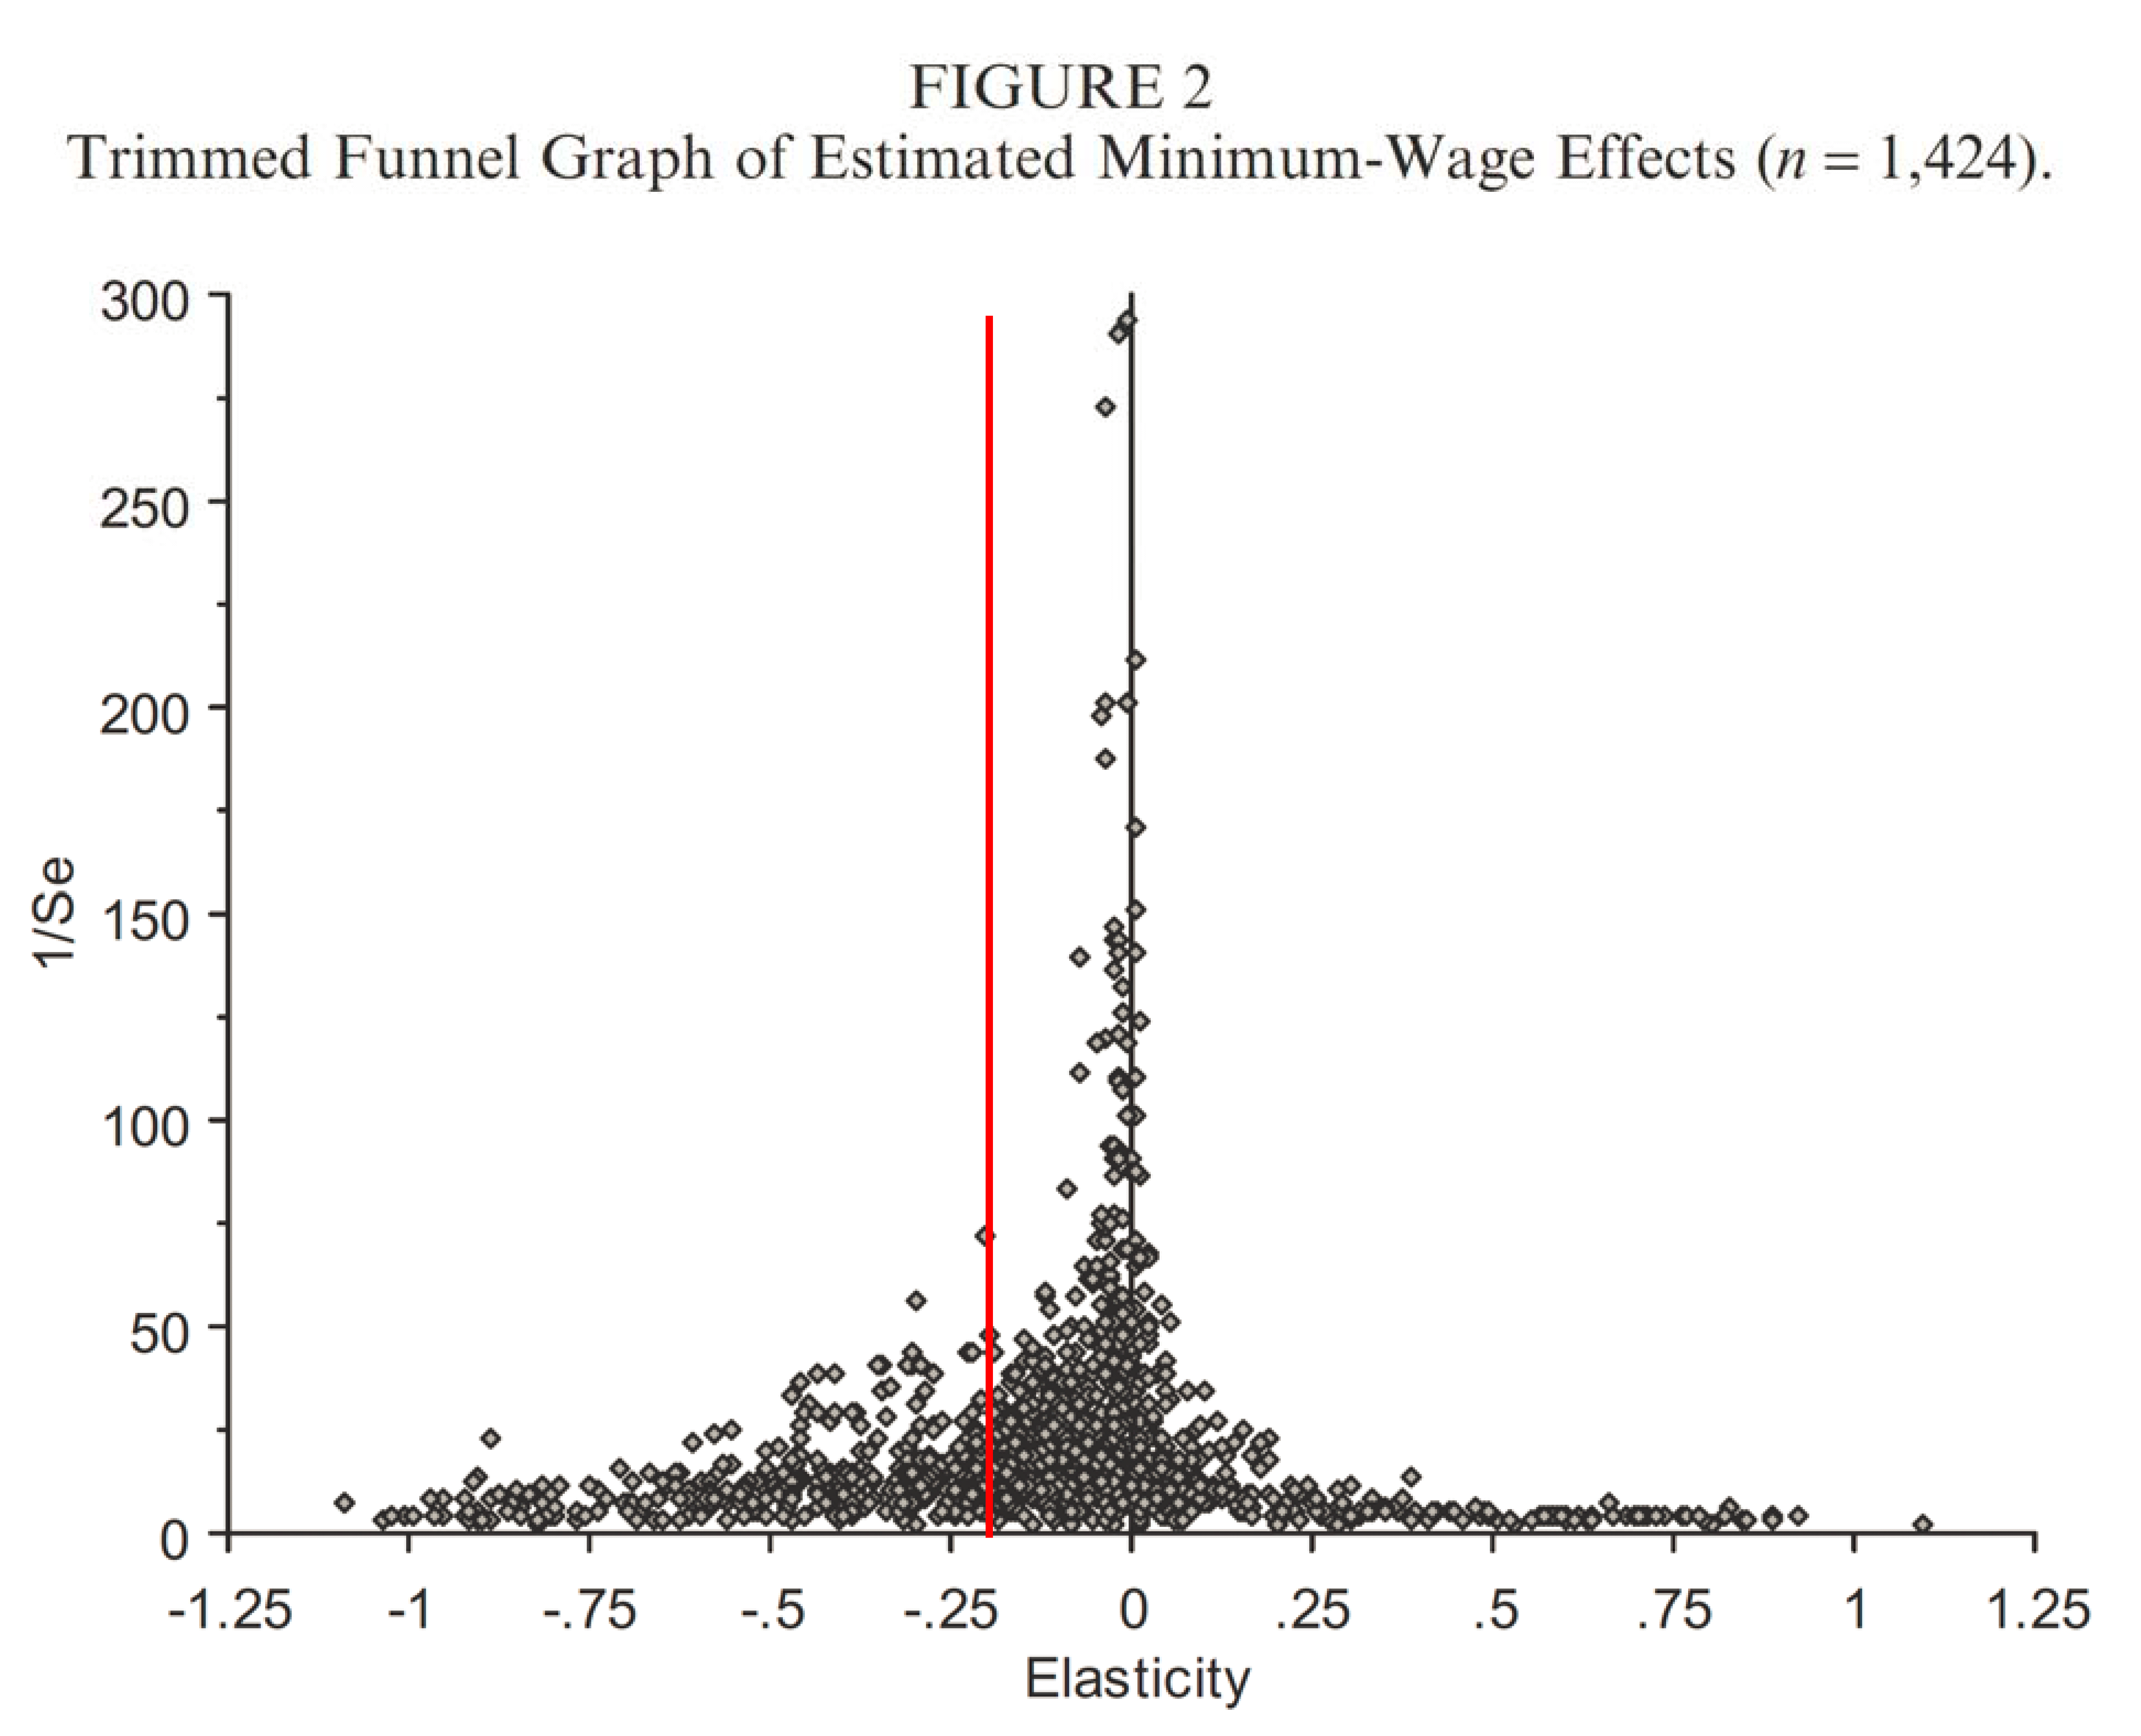
Figure 2 from Doucouliagos, Hristos, and Tom D. Stanley. “Publication Selection Bias in Minimum-Wage Research? A Meta-Regression Analysis.” British Journal of Industrial Relations 47.2 (2009): 406-428. [ungated working paper version], with red line drawn in at elasticity = -0.2.
I have drawn the mid-point of the estimate range cited by Professor Neumark (a respected researcher on minimum wages). It is useful to observe that the range he cites (-0.1 to -0.3) is substantially to the left of where the most precisely estimated locate elasticities are located. This suggests caution in attributing too much weight to one single estimate or set of estimates drawn from a single researchers. That researcher might have indeed obtained “the holy grail” of elasticity estimates; but it is useful to recognize the variation in findings nonetheless, if one is to be a social scientist.
More on this in Faith and Econometrics: Minimum Wage Edition. The true believers continue to hold strong.
Menzie David Chinn's Blog


