
Menzie David Chinn's Blog, page 27
August 26, 2015
To Log or Not to Log, Part V
The Shanghai stock market has undergone some wild gyrations over the last year… and back in 2008. Following up on To Log or Not to Log, Part IV:
Here’s the picture, as usually depicted.
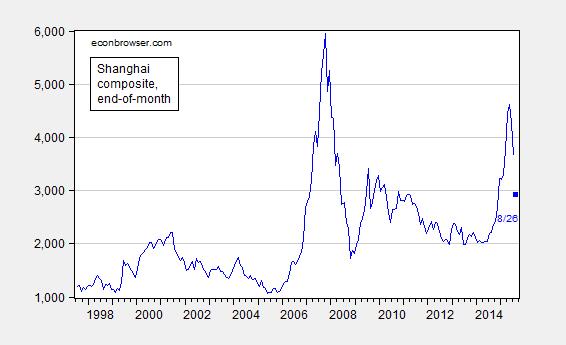
Figure 1: Shanghai composite stock market index, end of month close. August observation is for 8/26. Source: Quandl.
The movements look a bit different (but still scary) in logs.
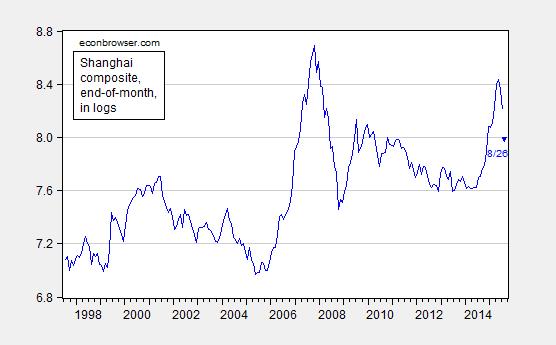
Figure 2: Log Shanghai composite stock market index, end of month close. August observation is for 8/26. Source: Quandl and author’s calculations.


To Log or Not to Log, Part IV
Do stock price indices follow a random walk? No, but log stock price indices do…kind of
Here’s a graph of the Standard and Poors 500 price index, level (blue) and the log (red).
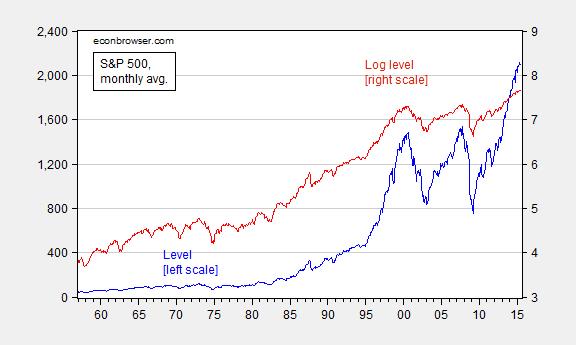
Figure 1: S&P 500 stock price index (blue, left scale) and log (red, right scale). Source: FRED, and author’s calculations.
Both processes look nonstationary, but the levels process more so (technically, “explosive”). Which one is the more appropriate to examine? A little theory might be helpful. Consider an asset pricing model for stocks. Ignoring dividends,
Pt = (EtPt+1)/(1+i)
Where P is the stock price, i is an interest or equity discount rate, and Et(.) is an expectations operator, conditional on time t information. Notice if errors are normally distributed, then the price level at t+1 is a multiple of that at time t (imposing an auxiliary assumption that the interest rate is constant and nonstochastic). Assume instead expectations errors are log-normally distributed (where p denotes log(P)). Then:
pt = Etpt+1 – ln(1+i)
pt+1 ≈ pt + i + et+1
Where et+1 is a true innovation. If one runs a regression in levels, the coefficient on the lagged variable is 1.04, and the process appears explosive. In logs, one obtains:
pt = 0.0052 + 1.0000pt-1 + ut
Adj.-R2 = 0.999, SER = 0.035, Nobs = 702, DW = 1.47.
The coefficient on lagged (log) price is not statistically significantly different from one.
Another hint about what specification is more appropriate comes from inspection of the first differences. Figure 2 depicts both.
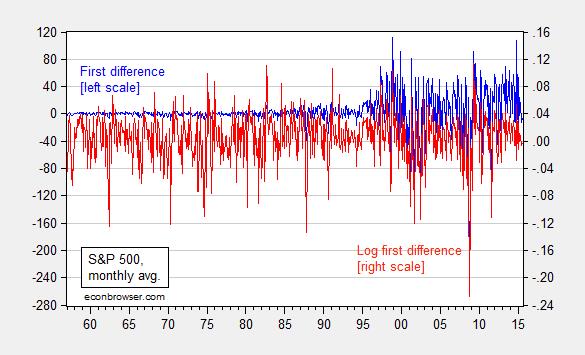
Figure 2: First difference of S&P 500 stock price index (blue, left scale) and first difference of log (red, right scale). Source: FRED, and author’s calculations.
The log first differences exhibit much less heteroskedasticity, and the distribution is less fat-tailed.
Note that in neither levels nor logs are these classic random walks (where the residuals are true innovations). The errors reject the no serial correlation null and no ARCH effects. But less so for the logs specification.
Digression: Great post from David Giles, on retrieving elasticities from different specifications (h/t Mark Thoma).
August 24, 2015
On China, and Preventing the Financial Runs of August
Reasoned analysis and careful decisionmaking is required.
The Chinese Context
The global meltdown in equity markets certainly concentrated minds. But, as I observed before, I think it’s important to keep in mind the overall context in China, laid out by Jim in his post yesterday. Here are a few additional graphs, relating to GDP growth and industrial production.
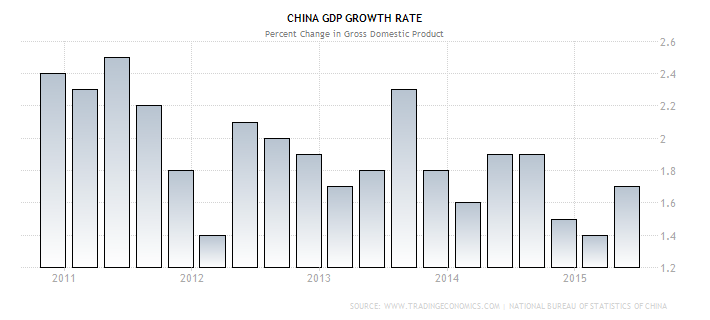
Figure 1: Q/q Chinese GDP growth. Source: NBS via TradingEconomics.
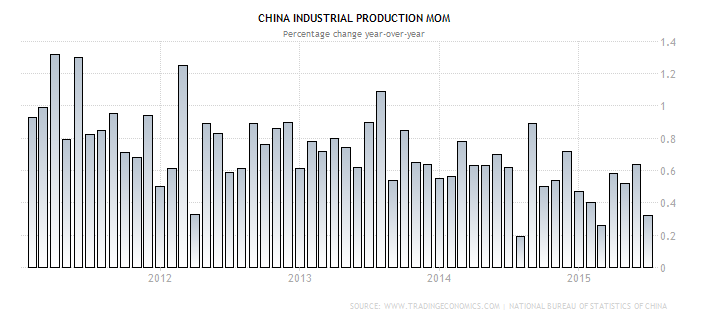
Figure 2: M/m Chinese industrial production growth. Source: NBS via TradingEconomics.
Of course, in China, statistics are difficult to interpret. An alternative indicator, looked to by those particularly wary of official statistics, is the Li Keqiang indicator, an unweighted average of electricity consumption, rail cargo volume, and bank lending (Jim shows the individual components of electricity and railway freight in his post).
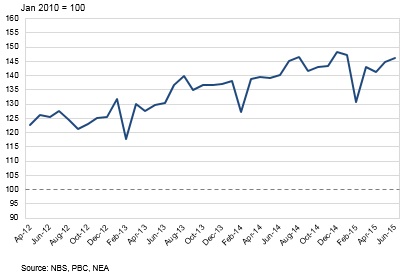
Figure 3: Li Keqiang index. Source: World Economics.
No collapse, but surely not vigorous growth. Additional indicators here, here, and OECD.
One key point to remember about forecasting the Chinese economy is that – in my view – the politics matters more than the economics. That is economics is secondary to primacy of the Party. And that primacy depends on perceived legitimacy due to improving economic fortunes. Hence, Chinese policymakers will do what it takes to “satisfice”, i.e. hit a minimum growth level, even if it delays achieving the longer term goals of rebalancing the economy.
In this sense, I think Scott Sumner’s views on the impact of policy is more relevant in China than in the US. Recall, Professor Sumner believes fiscal multipliers are zero because the Fed will adjust its policies to hit a certain target output rate. I’ve never subscribed to this view, but I think it kind of describes the Chinese approach to macro policy: it will adjust policies to make sure it hits minimum level of output viewed as consistent with social stability.
You can see this in the aggressive moves in monetary policy to date:
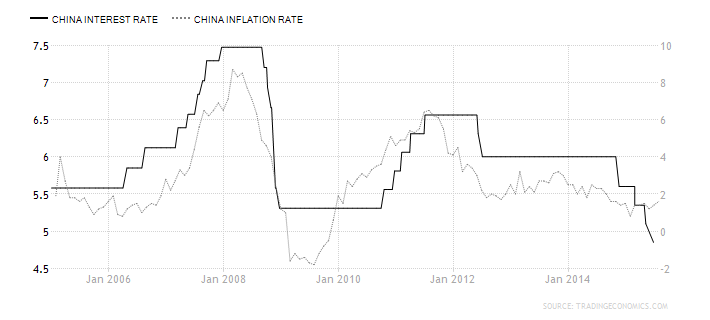
Figure 4: People’s Bank of China base rate (left scale) and year-on-year CPI inflation rate (right scale). Source: PBoC and NBS via TradingEconomics.
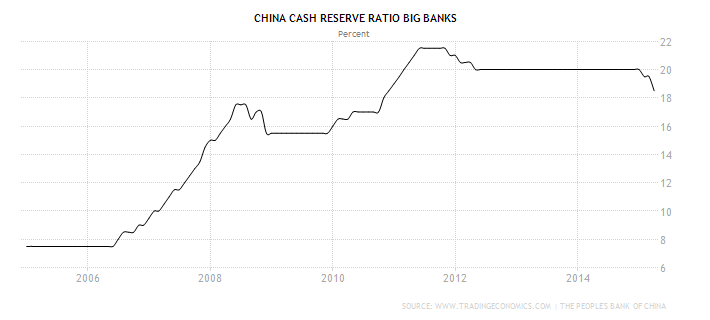
Figure 5: People’s Bank of China cash reserve ratio for large banks. Source: PBoC via TradingEconomics.
Obviously, China has room to loosen monetary policy (as well as exchange rate policy). Inflation is low (and PPI inflation is negative), and the PBoC could further reduce interest rates and the reserve ratio (which it’s indicated it will do).
Implications for the World
Commodity prices, which have been driven by China’s business cycle, have come down as expectations of growth decline. If my assessment of Chinese policymaker priorities are correct, growth should not slow too much more, putting a floor on commodity prices. I hope that’s correct, because commodity exporting emerging markets have been for years buoyed by Chinese demand. Should my (political) assessment prove wrong, then we should expect a lot more stress on emerging market currencies and foreign exchange reserves (even more than documented in this post).
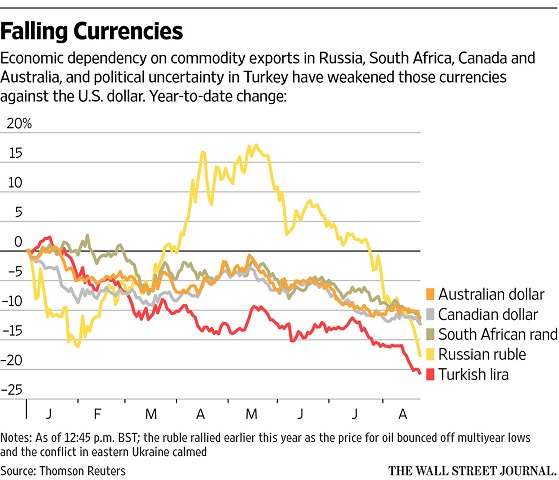
Figure 6: Falling Currencies. Source: WSJ.
I anticipate further shifts of funds to US safe assets as herd behavior takes hold. [1] In this sense, my biggest fears surround the potential runs of August. This is where US policy comes into play.
What Should the US Do?
A couple of years ago, Barry Eichengreen asked “Does the Fed Care about the Rest of the World?” His answer was – sometimes.
…[T]his longer perspective is a reminder that just because the Fed has not attached priority to international aspects of monetary policy in the recent past is no guarantee that it will not do so in the future.
My hope is that this time around, the Fed does put higher weight on the rest of the world. I’ve already recounted the reasons why the Fed should not raise rates on the basis of domestic factors (a persistent output gap). And the dollar appreciation has already depressed aggregate demand, as discussed in this post. There is no need for a rapid tightening of monetary policy.
In addition, I would say US and Chinese policymakers have to tread very careful. Irresponsible calls to cancel state visits, or to impose sanctions because of vague allegations of plots to undermine the US (as in this case) carry the risk of sparking even greater global financial turmoil.
With the world economy running on one and a half engines – the US and (kind of) Europe – further financial stress due to Fed tightening (or bellicose political language) is the last thing we need.
Update, 8/25 9am Pacific: After posting, the PBoC acted, by dropping the one year lending and deposit rates, dropping the reserve ratio, and injecting funds via repos.
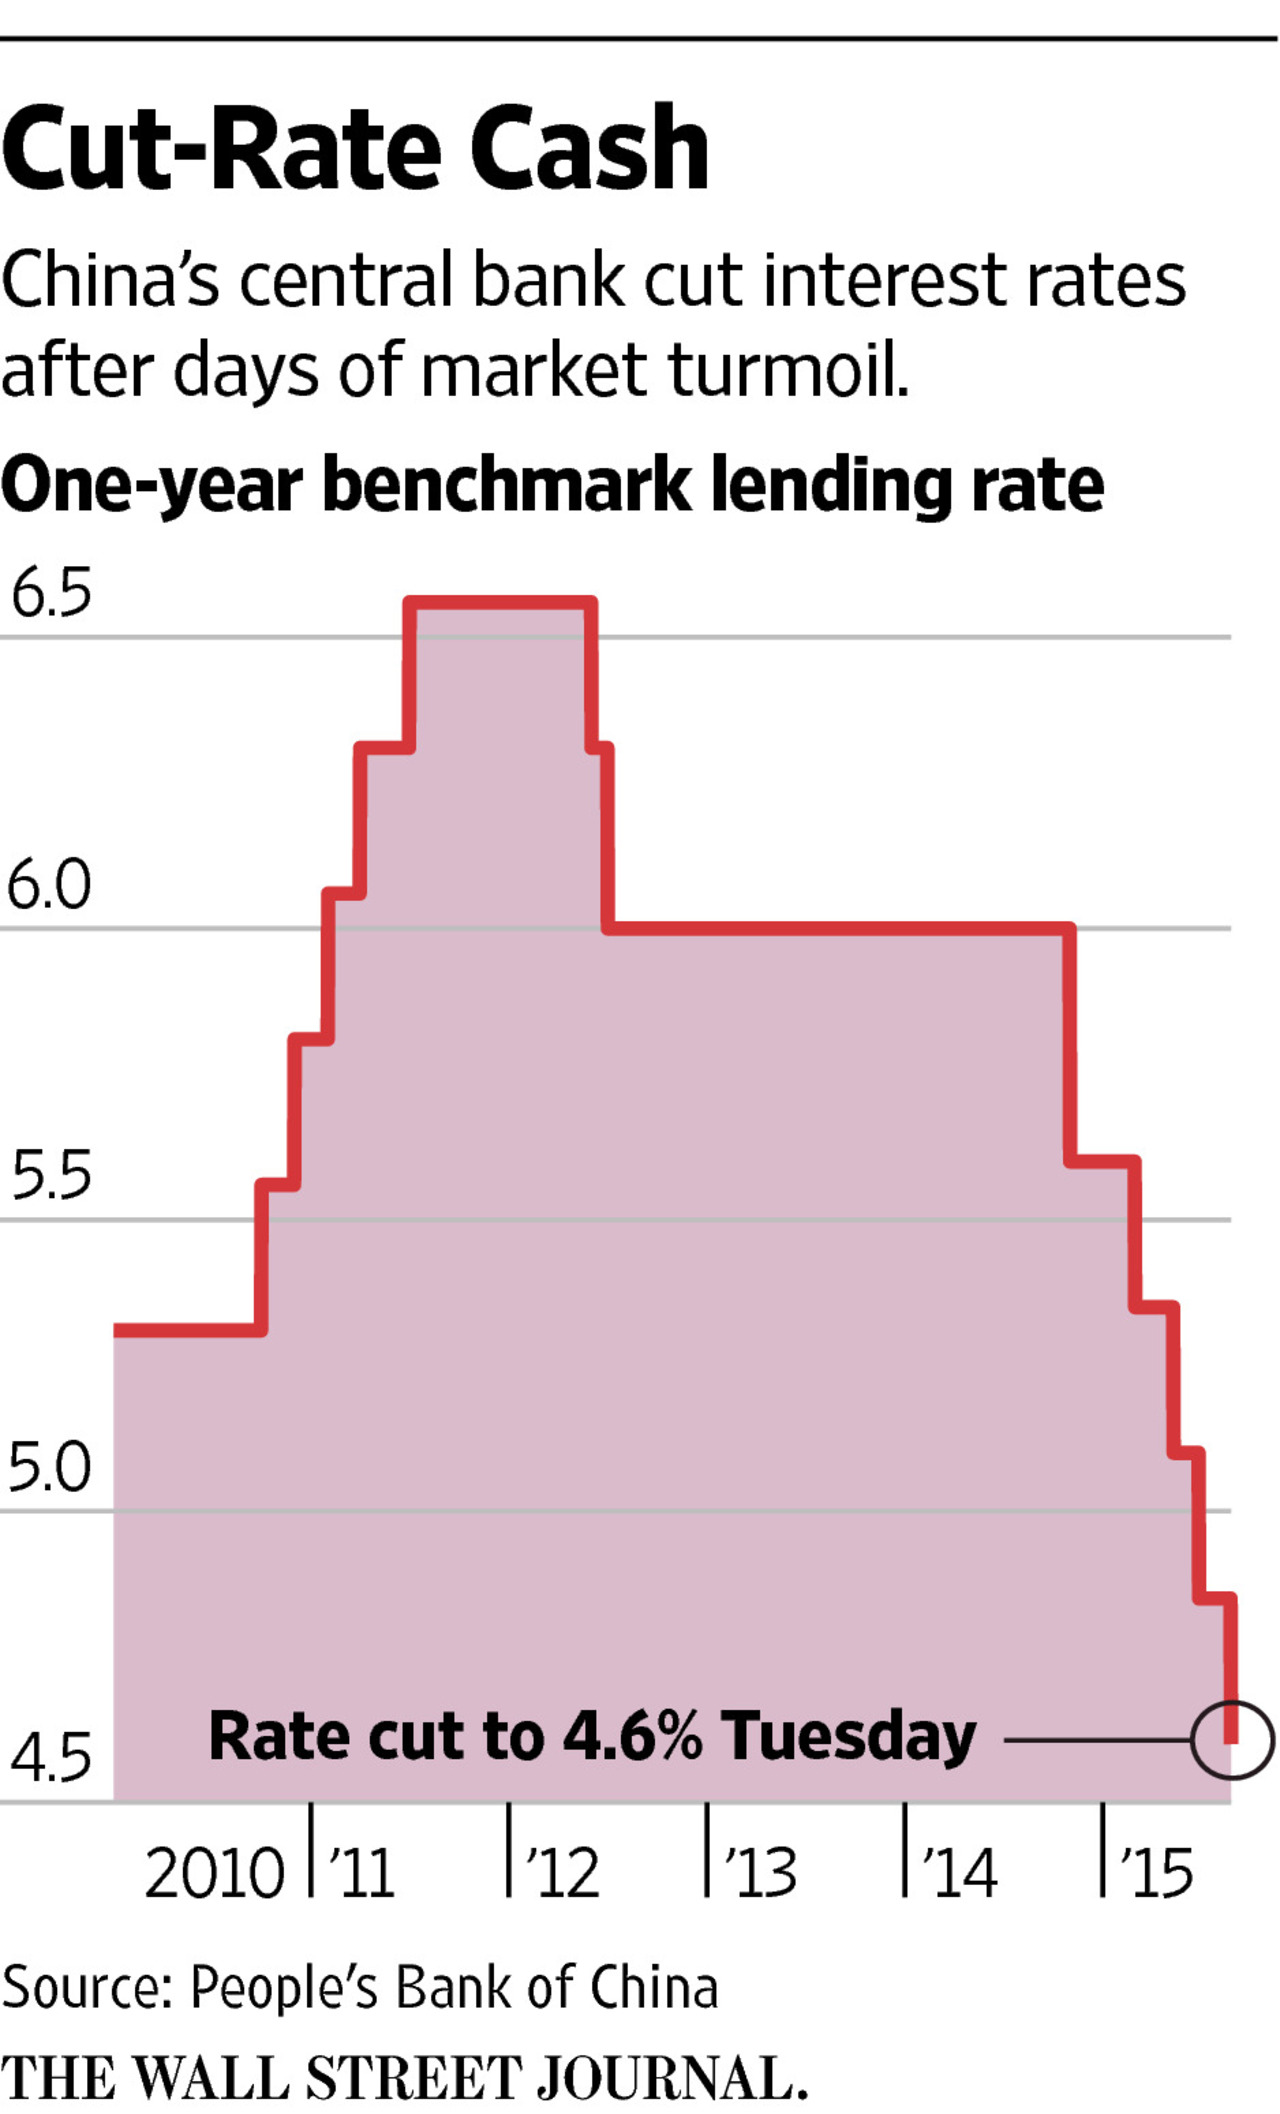
Figure 7: PBoC one year lending rates. Source: L. Wei/WSJ. See also Bloomberg, B. Bland/FT.
Governor Walker on Responding to the Chinese Economic Situation
From USAToday:
“Americans are struggling to cope with the fall in today’s markets driven in part by China’s slowing economy and the fact that they actively manipulate their economy,” the Wisconsin governor said in a statement. “Rather than honoring Chinese President Xi Jinping with an official state visit next month, President Obama should focus on holding China accountable over its increasing attempts to undermine U.S. interests.”
Does this mean Governor Walker believes the Chinese aimed to undermine the US economy by deliberately engineering a stock market collapse? I guess if one believed Chinese policymakers were incredibly cunning and devious, this makes some sort of sense. Pursuing this thought, does this imply Governor Walker believes the US Government should force the Chinese government to reflate the Chinese stock market?
Here is Governor Walker in 2013, speaking about opportunities for Wisconsin-China relations:
“This [Wisconsin Center China] strengthens our relationship with China and provides Wisconsin businesses the resources and assistance to pursue export opportunities in this growing market,” Governor Walker said. “Through the years, Wisconsin has built a strong trade relationship with China, and the opening of the Wisconsin Center China will help Wisconsin businesses continue to strengthen our trade relationships and grow export opportunities.”
More on the implications of the Chinese slowdown soon, to follow up on Jim’s post yesterday.
August 23, 2015
China’s economic slowdown
U.S. stock prices as measured by the S&P500 fell almost 7% last week. What’s going on?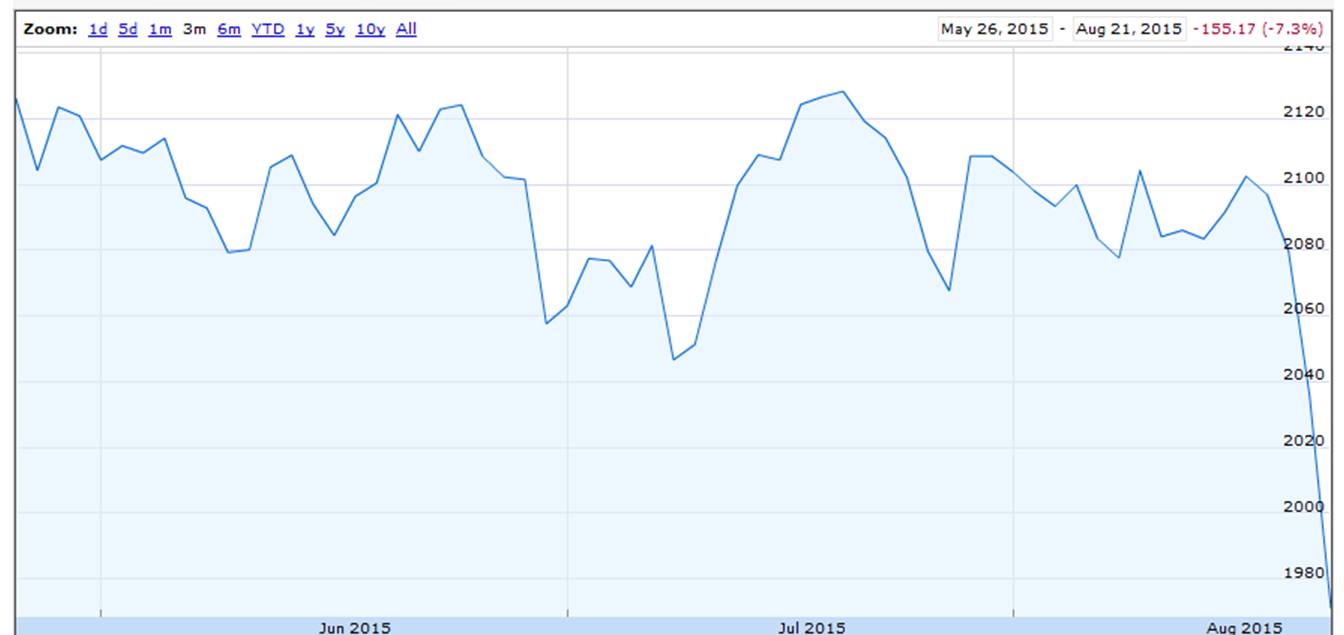
Value of S&P500 index over last 3 months. Source: Google Finance.
That’s quite a dramatic move for one week, though it’s useful to keep it in perspective. The decline barely takes a nibble out of the doubling in U.S. equity evaluations over the last 5 years.
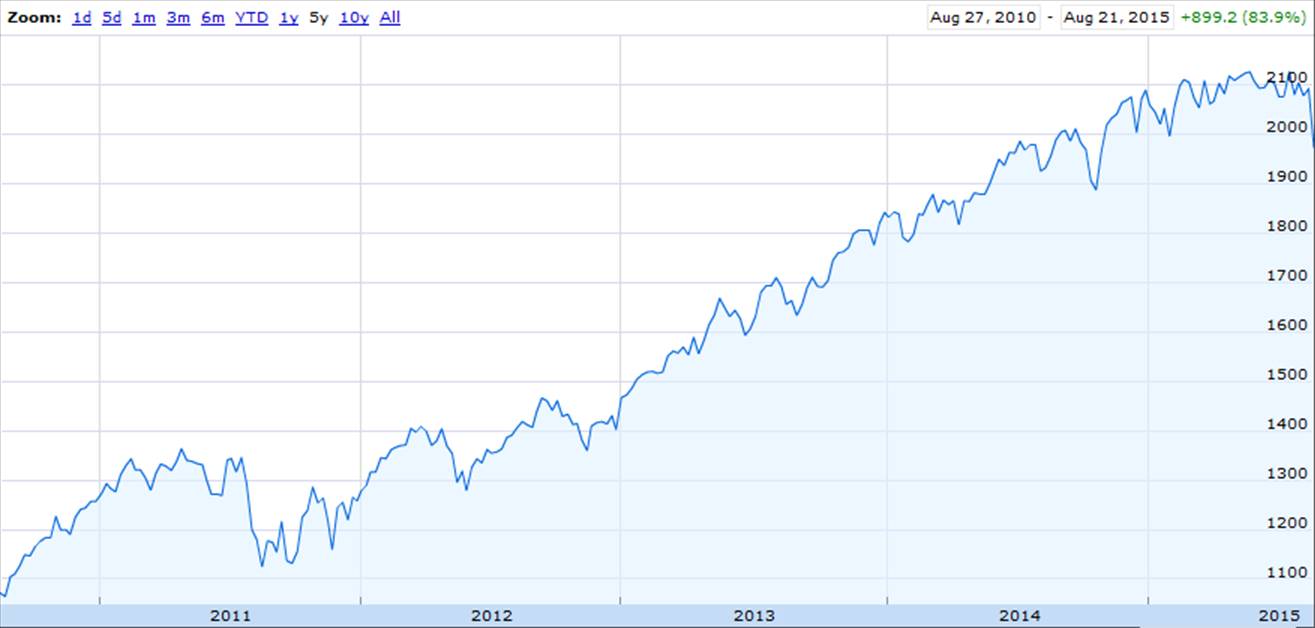
Value of S&P500 index over last 5 years. Source: Google Finance.
Center stage seems to be China’s stock market, where equities have lost about a third of their value since June 12. Though even after that loss, Chinese stocks are still up 57% from a year ago.
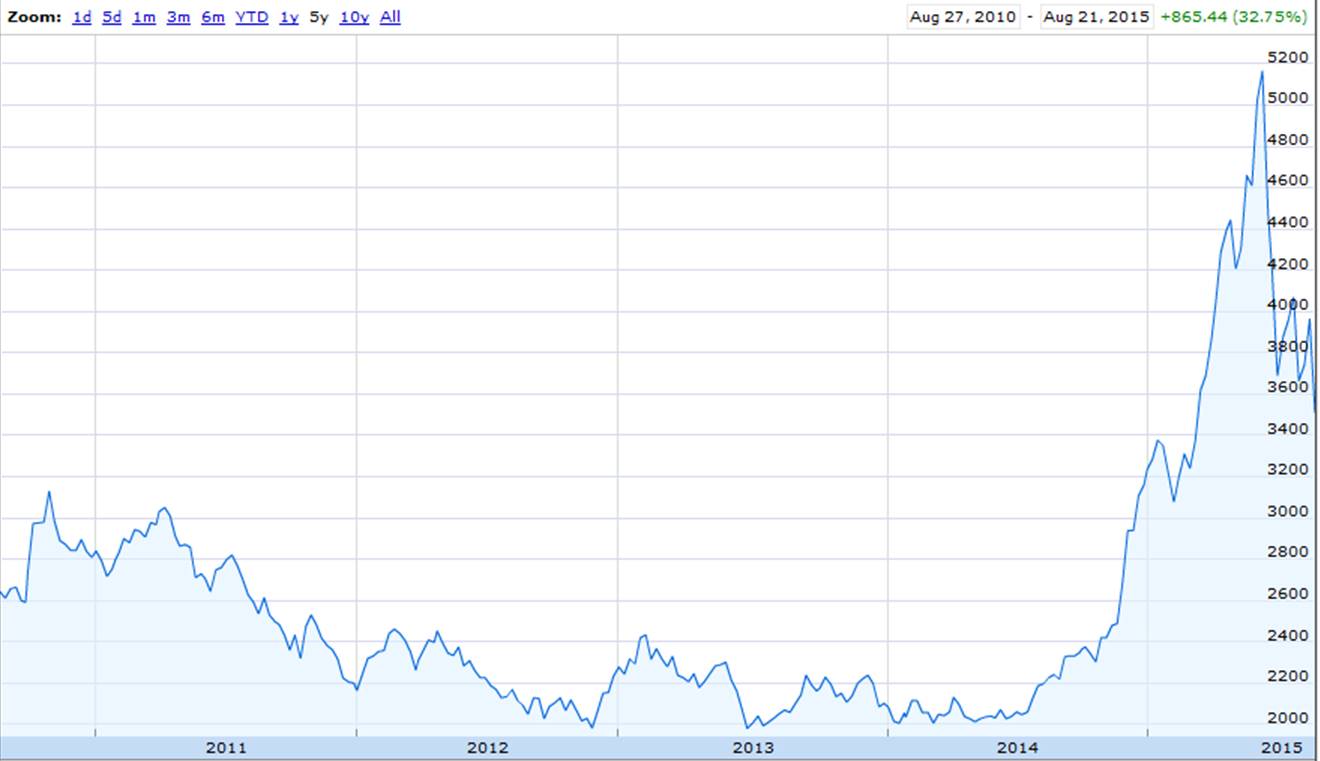
Value of SSE Composite Index of all shares traded on the Shanghai Stock Exchange over the last 5 years. Source: Google Finance.
If you believed that China had been experiencing a bubble that’s now in the process of popping, you might have expected to see a graph just like that one.
China’s economic growth has certainly slowed, and some of the recent indicators raise concerns. China’s Manufacturing Purchasing Managers’ Index fell to 47.1 in August. A value below 50 means that more establishments are reporting a drop in indicators like orders, output, and employment than are reporting increases. A value below 47 hasn’t been seen since the Great Recession, though it’s often come close to its current value without necessarily signaling anything.
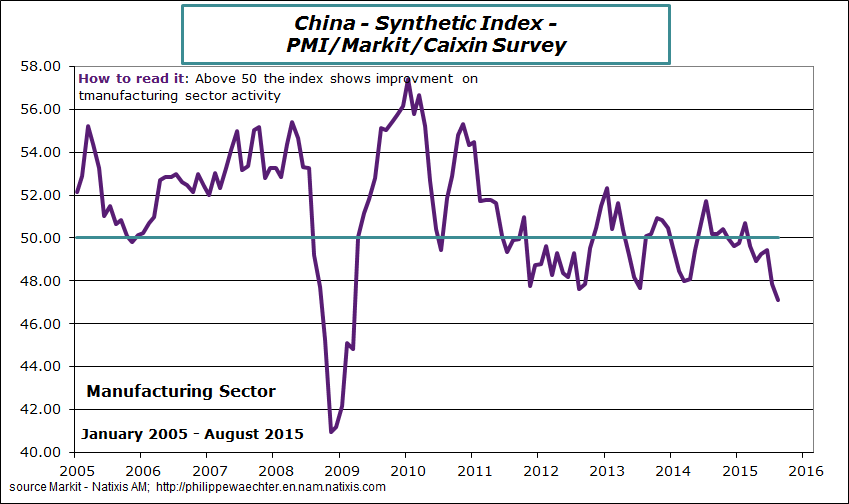
Value of China manufacturing PMI. Source: Philippe Waechter.
Rail shipments are also down, and the rate of growth of electricity production has slowed.
China railway freight traffic. Source:
Dr. Ed’s blog.
Annual growth rate of Chinese electricity production. Source: Dr. Ed’s blog.
Chinese leaders’ worries about a slowing economy likely figured prominently in China’s decision to devalue the yuan on August 10. If China’s economy is slowing significantly, it has huge implications for markets around the world. Concerns about a Chinese downturn were likely key not just in the recent U.S. stock market decline but for a host of other indicators as well. The yield on 10-year U.S. Treasuries has fallen 20 basis points since August 10, and West Texas Intermediate has dropped $4.50/barrel.
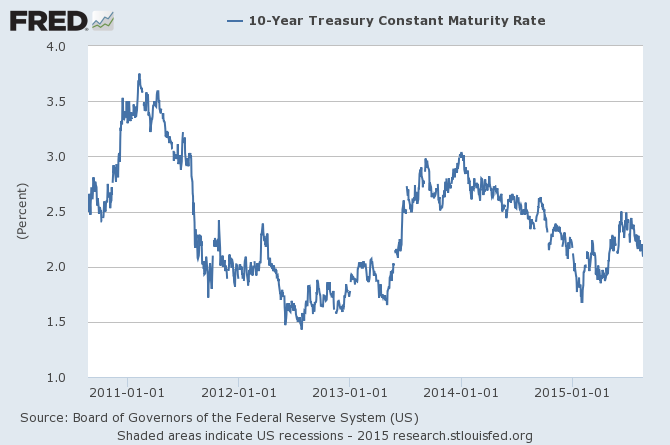
Source: FRED.
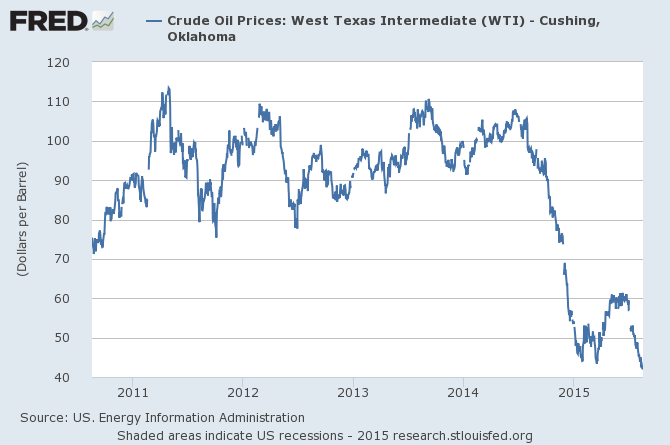
Source: FRED.
China’s changing demographics have to mean a slower economic growth rate. Coming off an apparent bubble in real estate and stock markets is clearly going to make it a challenge to manage a smooth landing.
August 22, 2015
Projecting 2015 Acres Burned and Firefighting Expenditures
Reader CoRev asserts wildfire intensity has not been severe of late. I’ll just some graph some data to bring reality to the interested.
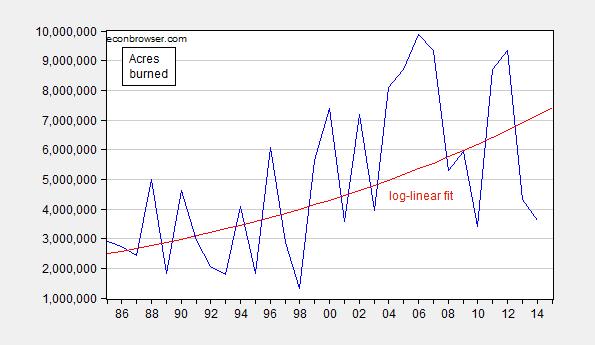
Figure 1: Acres burned (blue) and log-linear trend. Source: NIFC and author’s calculations.
Notice the upward trend; it is estimated by regressing log acres on a time trend. The t-statistic on the time trend is highly significant. The DW statistic is 1.83, the R2=0.81. Robust least squares provides a similar time trend. The coefficient on the time trend is 0.036, indicating that the acres burned trends upward at 3.6% per year (in log terms).
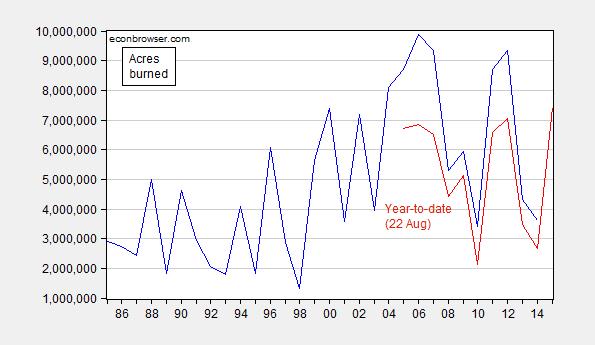
Figure 2: Acres burned (blue) and acres burned ytd (August 22). Source: NIFC1, NFIC2, and author’s calculations.
The high values for 2015 on YTD burn are the highest in 20 years. [1]
One can use the YTD burn to project total burn. I use a log-log specification (R2 = 0.95, DW = 2.07) to produce a forecast for 2015.
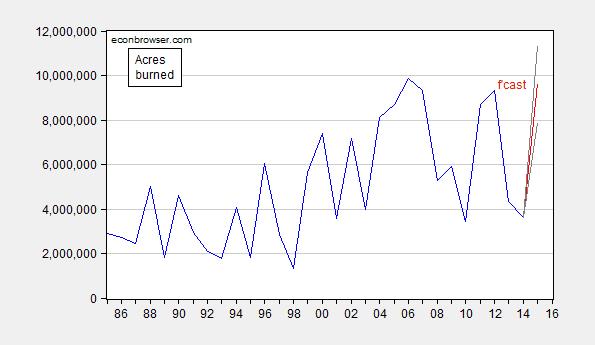
Figure 3: Acres burned (blue) and predicted 2015 based on YTD burn (red). 90% confidence band denoted by gray lines. Source: NIFC1, NFIC2, and author’s calculations.
While the 2015 mean forecast is slightly below the previous peak in 2006, a slight modification (no constant) would yield a mean forecast above the 2006 peak. And using the baseline specification, the 90% interval easily encompasses much higher values.
Finally, I can use the relationship between total firefighting expenditures, projected acres burned and the CPI to infer 2015 expenditures.
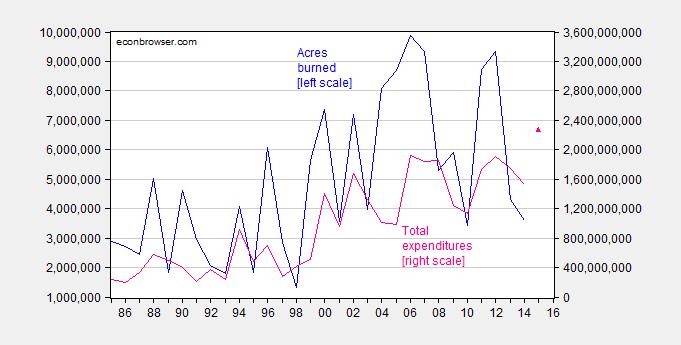
Figure 4: Acres burned (blue, left scale) and total firefighting expenditure in dollars (pink, right scale) predicted 2015 (pink triangle). 90% confidence band denoted by gray lines. Source: NIFC1, NFIC2, and author’s calculations.
My central forecast is for substantially higher expenditures in 2015.
August 21, 2015
Remember: “Global warming is a total, and very expensive, hoax!”
So said Republican Presidential candidate Donald Trump.
Here is a map of current fires:
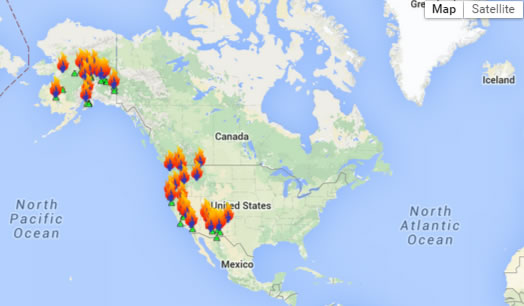
Source: NOAA.
July was the hottest on record (w/o reference to statistical significance).
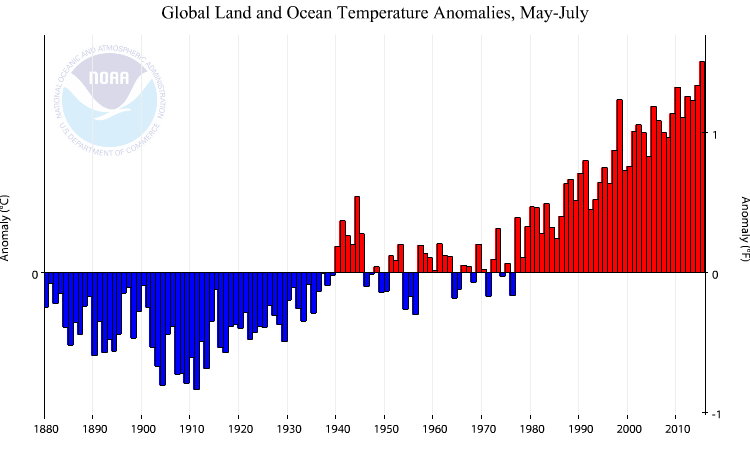
Figure 1: May-June global surface temperature anomalies. Source: NOAA.
From NY Times:
Global warming caused by human emissions has most likely intensified the drought in California by 15 to 20 percent, scientists said on Thursday, warning that future dry spells in the state are almost certain to be worse than this one as the world continues to heat up.
…
“This would be a drought no matter what,” said A. Park Williams, a climate scientist at the Lamont-Doherty Earth Observatory of Columbia University and the lead author of a paper published by the journal Geophysical Research Letters. “It would be a fairly bad drought no matter what. But it’s definitely made worse by global warming.”
August 20, 2015
Wisconsin NFP Employment Almost Reaches Prior Peak
Civilian employment falls to 1.3% below prior peak.
DWD released employment statistics today (usually it’s two or three days before the BLS release, but this time it’s just a day early).
First, note that for both nonfarm payroll employment and private nonfarm payroll employment, June figures were revised downward.
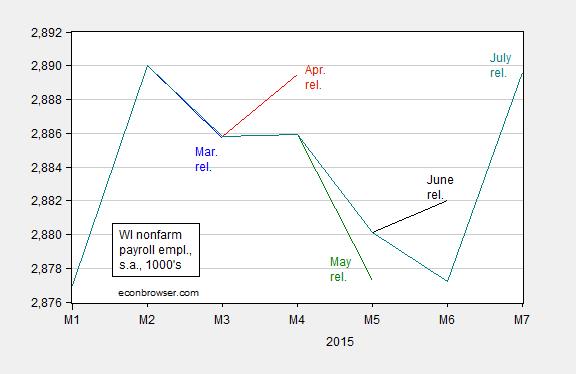
Figure 1: Wisconsin nonfarm payroll employment from March release (blue), April release (red), May release (green), June release (black), and July (teal). Source: BLS, and DWD.

Figure 2: Wisconsin private nonfarm payroll employment from March release (blue), April release (red), May release (green), June release (black), and July (teal). Source: BLS, and DWD.
An apt characterization of the situation is that establishment survey based estimated employment is treading water. However, that’s not the entire story; the household survey (which is typically less accurate than the establishment) indicates continued downward movement in civilian employment. The two surveys taken together indicate some worrisome trends are in place.
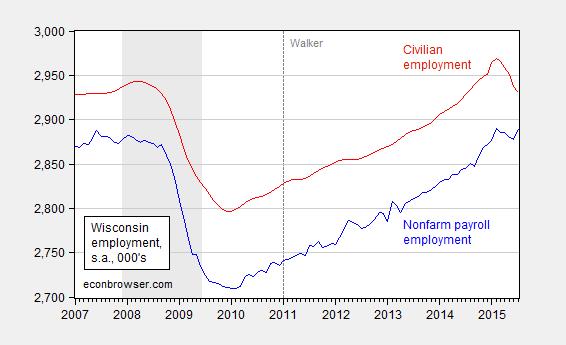
Figure 3: Wisconsin nonfarm payroll employment (blue), and civilian employment (red), s.a., in 1000’s. NBER defined recession dates shaded gray. Dashed line at beginning of Walker Administration. Source: BLS, DWD, and NBER.
While the unemployment rate remained constant (keeping in mind unemployment rate is the ratio of two variables, including labor force, which decreased 7,500).
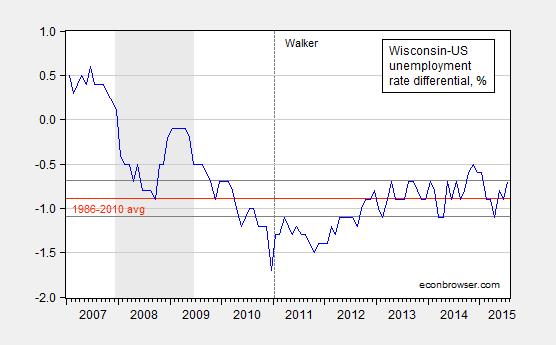
Figure 4: Wisconsin-US unemployment rate differential (blue), average over 1986-2010 period (red) and plus/minus 2 standard error bands (estimated using HAC SEs from regression of differential on constant). Source: BLS, DWD, and author’s calculations.
In addition, the Wisconsin unemployment rate is now rising relative to US, and is now borderline statistically significantly above the 1986-2010 average differential. In other words, while Wisconsin’s unemployment rate is lower than the US, it is on average lower than the US rate. And right now, the gap is smaller than it usually is.
Highlights of QCEW figures were released yesterday. I’ll try to update my estimates of implied nonfarm payroll employment when those numbers are finally posted. My previous estimates suggested a downward revision of over 10,000 for December 2014.
August 18, 2015
Wisconsin (Not) Outpacing Other States
Wisconsin is not outpacing its neighbors according to the Philadelphia Fed’s coincident indices meant to proxy economic activity; and, contrary to assertions [1], the lagging pace of Wisconsin is not apparently attributable to a milder downturn in Wisconsin.
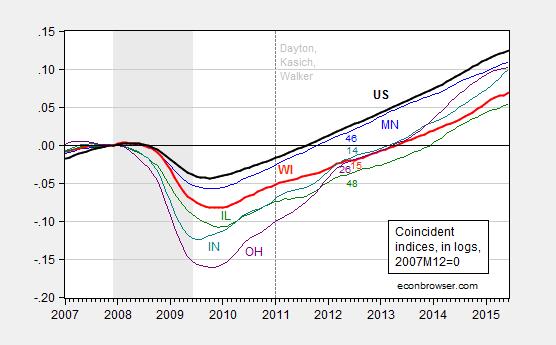
Figure 1: Coincident indices for Minnesota (blue), Wisconsin (red bold), Illinois (green), Indian (teal), Ohio (purple), and US (black bold), all in logs normalized to 2007M12=0. Numbers indicate 2013 ALEC rankings. A reading of 0.068 in June 2015 means that economic activity is 6.8% higher than it was at 2007M12. NBER defined recession dates shaded gray. Dashed line at Dayton, Kasich, and Walker administrations. Source: Philadelphia Fed, NBER, ALEC, and author’s calculations.
Because the graph is shown in logs, one can do calculations to determine how activity has evolved over time. For instance, a reading for Wisconsin of 0.068 in June 2015, and a reading of -0.05 in January 2011, means that Wisconsin activity has risen by 11.8% since Governor Walker took office. In contrast, Minnesota has risen by 13.8% over the same period. Interestingly, the much maligned (by conservatives) state of Illinois has risen 12.8% over the same period. In other words, Illinois outpaces Wisconsin.
In addition, note that Wisconsin fell further than Minnesota during and after the recession, and yet Minnesota has grown faster than Wisconsin. Hence, a milder downturn does not prima facie explain Wisconsin’s lackluster growth.
The numbers indicate the 2013 ALEC-Laffer rankings (which pertain to 2012 values). As discussed in this post, the ALEC-Laffer rankings have little informational content, and if anything, poorer ranked states have better outcomes.
Notice that Michigan is omitted from the graph. Adding in Michigan does not put Wisconsin in a better light. Relative to 2007M12, Michigan is higher than Wisconsin, despite the further drop.
For a further discussion of the other dimensions in which Wisconsin lags, see this post, as well as this post. In my assessment, Wisconsin is not outpacing its neighbors. I would also add that, according to median household income statistics, Wisconsin is not prospering (unless your household income exceeds $100,000/year, in which case the proportion has risen — just like the proportion below $25,000 has risen). That is, there are more rich, and more poor…
Governor Walker on Who Should Be Considered an American
From Washington Post:
GOP presidential hopeful Scott Walker said Monday that children of illegal immigrants who are born in the United States should not automatically receive U.S. citizenship.
Then some clarification, kind of.
… When asked whether he believes any person born on U.S. soil should be considered a U.S. citizen, Walker responded: “Well, again, I think before we start talking about anything else beyond securing the border, enforcing the laws and having a legal immigration system that gives priority to American working families. Americans aren’t going to trust politicians that talk about other things until they feel confident that they’re going to do those things.”
I can imagine implementation of laws to determine who is or is not a legal resident will be conducted in an equally nondiscriminatory and equitable fashion, paying no heed to race, religion, and creed, under a Walker administration…but I can do so only under the influence of the proper hallucinogenic drugs, of course.
The Governor is not necessarily advocating deportation of said children of undocumented immigrants:
Hunt then asked Walker whether the U.S. should deport the U.S.-born children of illegal immigrants, at which point Walker said: “I didn’t say that — I said you have to enforce the law, which to me is focusing on e-verify,” a system by which employers can check the citizenship status of potential employees.
Apparently, the children would be allowed to remain in the US, in a stateless and illegal status.
Update, 8/19 1PM Pacific: The irrepressible W.C. Varones who was worrying about hyperinflation before dollar debasement (still waitin’ for either) argues that citizenship on the basis of location of birth (essentially Jus Soli) is a minority approach in developed economies. In order to assess this assertion, I tallied population in OECD countries implementing unrestricted and restricted and mixed Jus Soli, and compared against total OECD population. The respective figures are 763.8 million population, out of OECD total 1274.7 million (60%).
Of course, this calculation is irrelevant to the main point of the post — whether one believes a Walker administration would tally up who is or is not a child of a “legitimate” US citizen, for assessing citizenship according to Jus Sanguinis (citizenship on the basis of parent’s or parents’ citizenship). It seems to me a literal interpretation would require one to track backwards in time to the founding of the Republic who was or was not a citizen at the time. In principle, if one’s parents were both “illegals”, or if one were descended from a long line of “illegals” perhaps broadly defined, one could be an “illegal” even if one’s parent, grandparents, great-grandparents, great-great-great-grandparents were born in the US. This seems unlikely, but a narrowly defined interpretation of how citizenship is conferred by Jus Sanguinis would seem to allow this possibility.
Heck, if we went to this approach, we could determine citizenship on the basis of language/ethnicity. Perhaps this is the subtext of the assault on Jus Soli implicit in various Republican presidential candidates’ calls for an end of what they call “anchor babies” — it’s just the thin edge of a broader based approach of stripping citizenship from a larger group of perceived undesirables.
For reference to similar approaches in the past, see “Exclusion Laws”, which retroactively de facto eliminated some individual’s citizenship.
Menzie David Chinn's Blog


