
Harry S. Dent Jr.'s Blog, page 125
December 10, 2015
How to Get a Leg Up on the Fed’s Next Move
 For those of us with the kind of active trading strategies Adam referenced yesterday, we don’t really care what stokes volatility, so long as it’s there.
That’s why over the past year or so I’ve been hammering on and on about the Fed, market surprises and how subscribers of Treasury Profit Accelerator (formerly Dent Digest Trader) have profited when the U.S. Treasury Bond market moves.
And since the Fed is likely to raise rates for the first time in nearly 10 years, I’m going to give you a peek under the hood of my system… because this is a market event that could really shake things up.
Like I’ve mentioned on numerous occasions, while I might disagree with what the Fed does, it doesn’t really matter. My system runs and thrives on volatility, not asinine monetary policies.
It responds especially well to excessive volatility, the kind that often results from a market surprise. When the markets are caught off guard, you’ll often see a quick overreaction in asset prices, especially Treasury bonds. And that’s how we position to make quick profits!
In my 20+ years in this business, I’ve certainly observed these reactions many times. But a Fed study actually backs me up…
In the August 2008 Federal Reserve Bank of New York publication Current Issues in Economics and Finance, a study named “How Economic News Moves Markets” supports the idea that certain economic releases impact asset prices.
The study went on to say that while these releases have an uneven effect on all classes of assets, “…unexpected changes in data have the most marked impact on interest rates…”
So we know that Treasury bonds can overreact to scheduled economic release dates. Now we just need to figure out what an overreaction in prices is, mathematically.
Don’t worry, I’m not going to get into the math. Basically, it includes the historical trading ranges for the ETF that tracks the long-term Treasury bond index, and a measurement of volatility (standard deviation based on a simple moving average).
The calculation also sets a daily price ceiling and a floor. So, if the surprise moves the price over or under the calculated range, it triggers a trade alert.
I’ll illustrate with the most recent example from just last week. I alerted Treasury Profit Accelerator subscribers on Tuesday afternoon that a lower limit calculation had been violated.
This means the system had identified an overreaction in price, and that we should bet on it going back up:

Since the price violated its lower limit, the system told us that we need to buy call options on the ProShares UltraShort 20+ Year Treasury (TBT), the ETF we track for short-term, “snap-back” trades.
That lower price limit was $43.38 on December 1. The low of the day was $43.00, which triggered the trade alert for us to execute within 30 minutes of the opening bell the next day.
Okay, now what? We bought call options on the ETF and are looking for a “snap-back.” So how do we know when to get out?
Basically, we’re looking for the price to return to the mean, or average, which is why the algorithm also calculates the daily “mid-point.” I’ve included that element in the chart here:

When the price touches that level, we send a trade alert to take immediate profits. If there’s time left in the trading day, we get out right away. If not, we set the trade up for the next morning.
In the example above, the alert was triggered and sent to subscribers at about noon, so there was plenty of time to close our call options for a quick 76% return. That whole trade lasted a little more than 24 hours!
Along with my algorithm that identifies trade alert triggers, I developed a number of rules that help manage risk, maximize profits and ignore trade alerts that are triggered when market conditions (volatility) aren’t present.
We keep it simple: I tell you when to buy with a “buy-up-to” price and when to sell. And for the short-term or snap-back strategy, you’re never in the market for more than two weeks.
Even though we only get one or two trade alerts a month, they are high probability trades. In fact the last six of eight trades have been winners! That’s 75% winners in the last six months or so. Not bad, if I do say so!
Even though investors seem pretty confident in a rate hike next week, there’s still a lot of variables.
How many times will the Fed raise rates thereafter, and how frequently? Will it be a one-and-done, like Harry says? Will it shake up the stock market? Will deflationary economic headwinds come back to bite the Fed in the rear?
There’s a ton of “what ifs,” and as the markets sort these issues out, there’s bound to be plenty of volatility for us to profit on. You can subscribe to my Treasury Profit Accelerator to see how I have my readers positioned for it.


December 9, 2015
The Markets Can’t Handle a Rate Hike
 The Fed has been “talking its book” for nearly three years now.
It began in May 2013, when then-Chairman Ben Bernanke announced the Fed would begin tapering its bond-buying program.
Global markets reacted swiftly in what has since been called the “Taper Tantrum.” Ten-year Treasury rates jumped 80% higher between May and September that year.
Now, more than 30 months later, two important questions are consuming the minds of investors around the world.
First, “Will the Fed actually raise rates in December?”
Second, “What will be the impact, if rates are hiked?”
I’ll tell you straight away that I don’t have the answers to these questions. The Fed, despite its vow of transparency, always keeps the market (and analysts) guessing.
But there’s a lot to learn from how global markets typically anticipate rate hikes… and how they’re anticipating this one.
By some measures, there’s a strong argument that the stock market can’t handle a rate hike right now.
According to Guggenheim Partners’ Chief Investment Officer, Scott Minerd, the S&P 500 has typically traded higher in anticipation of a rate hike, returning an average of 23.5% during the nine months leading up to the first increase. This comes from data collected since 1980, covering six tightening periods.
Problem is… the S&P 500 is down 2% over the past nine months – a far cry from the double-digit gains it has historically mustered heading into a rate hike.
What’s more, Minerd explains that junk bonds have outperformed investment-grade bonds by an average of 4% in this nine month period.
But the credit landscape looks starkly different this go-around, as junk bonds (JNK) have underperformed investment-grade bonds by nearly 8%!
This gap – between historical pre-hike performance and current pre-hike performance – drives at the competing narratives surrounding the Fed’s mid-December decision.
On one hand, a rate hike theoretically suggests the U.S. economy is strong and getting stronger.
That’s an optimistic conclusion, which should prompt investors to have higher hopes for the future.
Thus, they should be willing to pay higher prices for stocks today… with expectations of increasingly positive trends tomorrow.
And those positive expectations indeed drove stock prices higher during the “anticipation” period of the last six tightening cycles. But not this time around.
This time, severe underperformance from global equity markets and junk bonds suggests investors are not optimistic about a post-hike world.
Instead, investors are downright scared of it.
This points to a conclusion that falls in the “this time is different” category. And Rodney recently put his finger on why – even though markets have pleasantly absorbed rate hikes in the past.
He wrote…
“We don’t have precedence for the Fed raising rates at this point in the business cycle (low rate of growth) at odds with other central banks, and certainly not when the world of capital is so interconnected.”
That’s a poignant statement, with three main points to break down.
For one, the Fed typically raises rates only after the U.S. economy appears to be on the verge of overheating. Today though, economic growth is nowhere close to overheating.
Secondly, most central banks around the world tend to move in the same direction – either lowering or raising rates together. Today though, U.S. monetary policy is set to go headlong against the grain of all other central banks, which are still lowering rates (many of them into negative territory).
Lastly, and now more than ever, global markets are eternally intertwined. That’s why even though there are valid arguments that the U.S. economy could handle higher rates… everyone is concerned about emerging markets imploding as soon as the Fed makes its move.
So while it’s typically a no-no to say “this time it’s different,” I believe we truly are in uncharted territory this time around.
And judging from the market’s performance over the last nine months, investors have very little confidence in the Fed’s ability to smoothly transition out of one of the most accommodative periods in financial history.
This paints a pretty bleak picture of what’s ahead. But even if the Fed has been backed into a corner, with no good solutions to the problem it created, I’m still optimistic about our ability to find opportunity in today’s wacky markets.
That’s because volatility and divergences create opportunities for active trading strategies, like ours. And the Fed’s decision next week will no doubt put many markets on the move… in different directions.

Adam O’Dell, CMT
Chief Investment Strategist, Dent Research

Rate Hike: How Will the Markets Respond Next Week?
 First of all, I think we’re all a little sick of hearing whether the Fed will raise rates this month – or whether they should’ve done it sooner. We’re talking about 0.25% if they do it!49
After seven years of zero interest rate policies, economists should be much more worried about the damage done from speculative bubbles and mal-investments created from such rates.
December 7, 2015
Economic Reporting: It’s Just a Big Sensation!
 When my children were young, one of the books we read to them was: “When You Give a Mouse a Cookie.” The point of the book is to follow a chain reaction stemming from providing a treat to a rodent. He will want a glass of milk, a napkin, have to sweep up crumbs, etc. It was odd, but entertaining.
December 4, 2015
Investors Are Playing Russian Roulette
 Understanding crowd psychology is a big part of successful investing. So investors’ opinions can be useful on the direction of the market when they’re at extremes. In the August sell-off, both professional and retail investors got nervous and sentiment became way too bearish.
Like clockwork, everyone raced to cash and took their chips off the table.
Then the market took off and zoomed to new highs. I thought the market was overdue for a bounce in September, but stock prices regrouped much faster than I would have thought.
October ended up being the best month for stocks in four years!
So, now that the market has had a nice run, I decided to take a look at several sentiment indicators to see where we’re at today.
First, it’s important to note that individual investors are quite bullish on stocks, and that this generally isn’t good for future market returns. At the beginning of 2015, they were 69% invested in stocks, which is the highest investment level since the previous stock-market high in 2007.
Currently, individuals are 66% invested in stocks, meaning that the allocation has come down – but not by much.
How low would the investment allocation have to go for people to move against the crowd and go all in on stocks?
In 2009 the percent invested was just 41% and in 2011 it was 51%, just before a huge move higher into the fourth quarter.
Today, cash levels stand at about 18%. Over the last 28 years, the average has been 23.8%.
Higher-than-average stock allocations and lower-than-average cash on hand typically means sub-par returns for stocks until investor sentiment swings the other way.
When you look at them as a group, professionals tend to be way worse than individuals because they’re even more bullish. After the market got hammered in August, for example, professional investors were only allocating 15% to stocks. Now that the market has hit new highs, that number is up to 70%.
That isn’t actually an extreme level. Historically, anything around 72% has yielded annualized returns of just 0.5%. Considering that the current dividend yield is about 2%, the returns for stocks are pretty much negative.
So what is there do?
Sentiment is high but not outrageously so, and the market has become increasingly bullish as stocks have recovered from the summer slump. That doesn’t mean you should follow suit. The risk to adding to stocks here is high, so be on the alert to cut back existing positions if the market starts to roll over again.
John Del Vecchio
Editor, Forensic Investor

December 3, 2015
China Could Deliver Another Blow to the U.S. Housing Market
The New York Times ran an article on Sunday talking about how the Chinese invasion of U.S. real estate is only expanding.
They aren’t just buying condos in Manhattan or McMansions in Silicon Valley – they’re buying properties in new developments in places like Plano, TX, just north of Dallas.
In the market for homes over $1 million, the Chinese make up one out of every 14 buyers – which is huge. In the top tier markets in San Francisco, Orange County or Manhattan, they can be 50% or more!
In the past year they paid $831,800 on average for an American home for a total of $28.6 billion. That’s more than double their level just two years prior!
The next biggest buyers, Canadians, only spent $380,300 on average. The average U.S. buyer: just about $250,000.
As you can imagine, a lot of Americans in these cities the Chinese are buying into aren’t much too happy. With that kind of buying power, they’re jacking up costs across the board. But it gets worse.
69% of their purchases are entirely in cash. Local buyers can’t do that! They have to apply for a mortgage. So they’re pissed off because so many Chinese can close a deal in a weekend.
But we need to consider why the Chinese are trying to get the hell of out dodge in the first place.
Many know like I do that China’s economy is a time bomb, so they’re trying to get their money out – especially before, worst case scenario, the government starts taking it.
Others just want to get their kids into American high schools or colleges to give them a world-class education. And some are just escaping the growing smog!
There’s also the fact that since 2009, U.S. real estate has only become more attractive as Chinese property got more expensive. So this trend of the Chinese buying over here has just accelerated since.
And it shows in the exodus of money coming out of China in the chart below.

You can see it started to heat up between 2012 and 2013, and going into 2015 it’s just been berserk! (Though we have data only up through Q2.)
The New York Times articles argues that the Chinese government has been making it easier for affluent Chinese and corporations to move money overseas. And the U.S. government helps by offering EB-5 Visas or green cards for foreigners who invest $500K to $1 billion in projects that employ at least 10 people. In fact, 86% were granted to Chinese last year!
But it finally seems like the Chinese buying might be slowing down.
That’s the point of another article in The Wall Street Journal by Laura Kusisto and Alyssa Abkowitz, which is more in line with what I’ve been hearing.
They’re saying in recent months the Chinese government has been making it harder to get money out of China.
The government is cracking down on the $50,000 per year limit they enforce on transferring money overseas. Up until now, people have been pooling money through friends, relatives, and employees to get around that limit.
And then there’s the fact that China’s stock market crashed. That’s made the Chinese more cautious about any and all investments. Real estate agents have noticed a marked decline since.
So the question is – will this stall be more temporary or more permanent?
First, I think the government is going to crack down even more seriously about the money flowing out of their country.
Outflows recently totaled $580 billion in 12 months. How can you continue to let your most affluent take their wealth out of the country under the guise of their kids’ education?
But more importantly, I think another shock is coming to China’s stock bubble burst. And that will create more uncertainty among the affluent. They can’t be feeling too secure about their financial assets, and some are already getting less comfortable with speculation.
My forecast: Look for another stock crash in China starting by late January. And then an acceleration of the real estate crash in China that has already begun.
This happened with the Japanese in the early 1990s…
When such a crash and implosion of wealth happens where it really matters – real estate – it will cause global speculation to come to a halt, and fast.
And that means curtains for many of the bubbliest cities around the world… even Plano, TX.

Harry
December 2, 2015
The Financial Sector Might Be Catching a Lucky Break
Financial institutions have had an incredibly tough time turning a profit since the Great Financial Crisis of 2008.
Some of that challenge was the banks’ doing… as they had to clean up the messes they made for themselves during the lending spree that led to the U.S. property bubble. But not all of it is the banks’ fault.
The rest of the blame falls on the shoulders of the Federal Reserve, which reacted to the financial crisis by pinning interest rates just a sliver above zero – in turn, killing the golden goose that banks have relied on for centuries.
So while the Fed succeeded in breathing life back into the stock market, financial stocks have sucked wind. Take a look at this chart, which shows the S&P 500 (SPY) about 35% above its October 2007 prices, while the financial sector (XLF) is still 31% below that level.

Financial stocks have been out of favor for nearly the entirety of the current bull market. But that tide has started to turn in anticipation of the Fed’s looming rate hike.
And regional bank stocks, in particular, are doing even better. These stocks are up nearly 12% year-to-date, easily beating the S&P’s measly 2% gain.
Here’s a ratio chart, which plots the price of regional bank stocks (KRE) divided by the price of the S&P 500 (SPY). As you can see, regional bank stocks have thrived alongside speculation of a 2015 rate hike. Take a look…

If the broad stock market manages to catch (and maintain) a bid for the next several months, through its seasonal sweet spot, regional bank stocks are poised to outperform.
Adam O’Dell, CMT
Chief Investment Strategist, Dent Research

Retail Sales Over Black Friday Weekend Were a Bust
Thanksgiving Day, Black Friday, and Cyber Monday for 2015 are all history, and if recent reports are correct, they each were disappointing when it came to commerce.
We, as consumers, apparently are not holding up our part of the bargain by braving the early morning hours, sometimes inclement weather, and wrath of other shoppers, to elbow our way to unbelievable savings on that G.I. Joe with the Kung Fu grip (do they make those anymore?).
Apparently, we are still cheating our employers by spending hours on Cyber Monday trolling the net for a proverbial door-buster, but not enough to offset the slower sales on Turkey day and Black Friday.
If the goal is a healthy economy, then this trend should worry us all.
Retail sales make up about 70% of all economic activity. Every time we buy a doll, car, home, pizza, or gallon of gas, we are putting money to work in the economy. In doing so, we create income for other people, and tax revenue for the relevant city, county, state, transportation district, special commerce zone, and redevelopment enterprise. When we spend less, businesses, workers and taxing authorities all lose out.
A company with lower sales has some decisions to make. Should they cut prices, cut workers, cut orders, etc.? Each action goes up the line, affecting employees and suppliers, who then have to make their own choices.
Taxing authorities (except the federal government, apparently) also have to make choices, since they typically have balanced budget requirements.
If tax revenues come up short, then cuts must be made. Services might shrink, along with headcount, and once again this travels up the line to whomever was receiving services along with employees.
Of course, all of this ignores the basic question of why retail sales might fall in the first place.
It could be a perfectly logical reason, such as consumers aren’t in a position to spend more because median family income remains stagnant. Or perhaps consumers, who are the same people that must prepare for their golden years, have decided that spending more today is a bad idea when those same dollars could help fund a more comfortable retirement tomorrow.
But logic has no place here. According to our all-knowing government officials, at this time of year consumers are supposed to spend more no matter what.
If their earnings are light, then they should dip into savings. If that doesn’t do the trick, then they should turn to credit. Anything less is a sign of irrational fear of the future, instead of simply good stewardship.
This view must be the case, or else our financial system would have built in the possibility of higher savings and – gasp! – lower retail sales. We would have large reserves for those times when consumers decided to defer their material gratification by using their funds to pay down existing debt or sock away more for the future.
Instead, what we have is a system with no room for error, and certainly no room for contraction. Like a shark, we must move forward, or risk death.
So as you spend the next two weeks contemplating what to get your nephew’s fiancée for Christmas, or if you should be buying presents for such distant connections at all, understand that the world rests on your shoulders.
We can’t have you taking the high road, cutting back on spending and building a bigger nest egg. That’s for worriers and planners.
What we need, what we must have, are profligate spenders who get the greatest joy from the next dollar spent, the next reward point cashed. We need those people who don’t calculate how much they spent at a sale, but how much they saved! The bigger the number, the better!
For all of you feeling weary of spending, which is obvious from the flat nature of retail sales over the past few months, take a moment to breathe.
Step away from the cash register or the keyboard, and consider for the moment that we collectively hold the fate of the economy in our hands. Should we jump back in, credit cards in hand, spending with abandon to keep the ship afloat – or should we build ourselves a financial life raft and jump overboard?
Tough call.

Rodney
December 1, 2015
The Consensus Still Points to a Rate Hike in December
Friday’s Bureau of Economic Analysis (BEA) October Personal Income and Outlays report was most important to the Fed.
The Fed has been talking about a rate hike in December for a long time. They say the decision is based on improving data. They’re especially focused on wages and prices (inflation), but they are also worried about creating a market melt-down (which is probably why they haven’t already hiked rates).
The good news was that personal income was up in October, as expected – a healthy 0.4%.
The bad news was that spending was lower than expected and doesn’t bode well for the holiday season. That figure confirmed the poor retail sales figures from a couple weeks ago.
Worse yet, the Fed’s favorite inflation indicator, the PCE price index, also disappointed. The headline number was up only 0.1% with expectation at 0.3%. The core number, which excludes food and energy, was unchanged while it was expected to be up 0.2%. The Fed is looking for an annual inflation rate approaching 2%, but it’s coming in at just 1.3%!
So what was the reaction in the markets to Friday’s data? Nonexistent. That day the bond market barely moved and now sits right at 3%.
Still, U.S. Treasury bond yields have been falling steadily for the last two weeks.
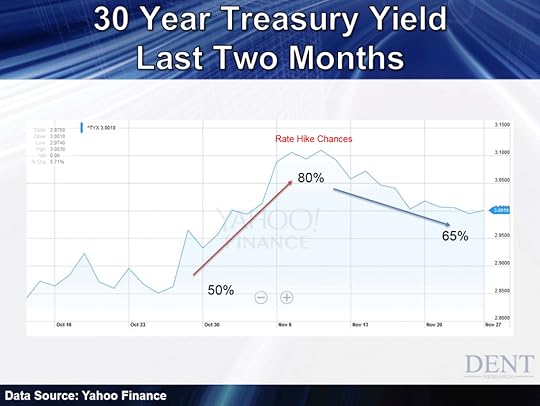
When yields spiked last month on a strong jobs report, the odds of a rate hike moved from about 50% to over 80%. Now, that likelihood has fallen back to about 65%. But the overall consensus is that the Fed will most likely hike.
Still, the market isn’t so concerned about the first rate hike, but what comes later. Bond yields have already priced in a December hike, so when it happens traders will be focusing on future action. And right now, because of weak inflation and wage growth, a future rate hike isn’t a big worry.
Again, we don’t care what the Fed does! We’re looking for an overreaction in the long-term bond market. Surprises create these overreactions, and there are always opportunities for surprise.
Japan’s Back in a Recession: We’re Next
As we forecast decades ago, Japan was the first developed country to go off the demographic cliff. Their massive baby boom and the real estate and stock bubbles that came with it, all burst.
Japan has already gone through what the rest of the developed world has since or will go through shortly… but nobody gets it. Japan didn’t see it coming, and neither will Germany, Europe, or the U.S. ahead.
I just spoke in South Korea at the World Knowledge Forum and my message was that they’re Japan on a 22-year lag for the peak in their two baby booms.
They actually seem to get it more than most.
Never has an emerging country rose to wealth and developed country status as fast as Japan, in just three decades from the 1960s through the 1980s. And never has such a major economic and military power fallen so rapidly.
Japan’s steep demographic slide was so strong that, even while the rest of the world saw the greatest global boom in history (as we also forecast), everything crashed.
Japanese stocks went down 60% in the early 1990s and real estate followed the same amount. Stocks eventually went down 80% in 2003, and real estate has never bounced – still down 60% today in residential, and 80% in commercial.
But Abe Shinzo, Japan’s prime minister, and Haruhiko Kuroda, its central bank head, still think they can just stimulate their way out of the endless demographic landslide. They’re convinced this is just a monetary problem of not enough inflation to get consumers to spend.
Hate to break it to them, but not only do aging consumers spend less and less, especially on real estate – they die.
How do you get them to spend then?
In early 2013 this dynamic duo declared war on deflation (which is laughable) and aggressively increased QE, to more than double that of the Fed and the ECB at their peak rates. But then, they increased it another 60% in late 2014 to triple.
And sure, their stock market doubled – as pumping up stocks seems to be about the only thing QE’s capable of – but their debt has risen to the highest in the world at 246% GDP, and 680% for total private and government!
Look at some stats since the tripling of QE in early 2013, compared to growth in private consumption and GDP.

The Bank of Japan’s balance sheet has increased by 120%, which just blows my mind. No government has ever come close to these extremes. And yet, inflation has only risen 2% in this time frame of just over 2 years. How could this be with such massive money creation?
The answer is that they’re fighting massive deflationary forces from aging and record debt levels.
Private consumption from consumers has actually fallen 2%, or just less than 1% a year. Economists blame this on the rise in sales taxes from 5% to 8% in early 2014 to help offset their huge government deficits and debt. That’s when they upped QE another 60%. That didn’t work either, as aging and demographics is the real problem.
And through this massive Abenomics program, GDP has only grown 1% over 2.25 years, or about 0.4% a year. This makes Europe look strong!
Make no mistake: Japan’s efforts have been an abysmal failure. They’re mortgaging their future with QE and rising debt as their population and workforce ages predictably, even decades into the future. And it gets worse. After their millennials end their upswing from 2003 to 2020, their demographics worsen forever!
We’ve witnessed a great country rise in three decades, and fall in three decades… and they’ll continue to fall as far as the eye can see.
That’s the power of demographics, and they just don’t see it. They think that as long as they get inflation up to 2% – which they haven’t even come close to – consumers will spend more.
How little could you understand about your economy?
The final judgment is coming. Japan just entered an official recession with 0.8% declines in GDP in each of the last two quarters. The worst sector, business investment, is down 5% in Q3 and Q2. No wonder, considering businesses never fully supported QE in the first place! Now, they’ve lost confidence in their economy.
I would too!
This is the best evidence that artificial stimulus cannot create a sustainable recovery – not against rising debt levels and falling demographics.
We continue to not learn from Japan’s lead. We’re following them into a coma economy with similar policies of denial, instead of restructuring our debt and deleveraging it.
Only that would clear the decks for a more sustainable recovery.
Harry


