
Harry S. Dent Jr.'s Blog, page 121
January 14, 2016
Can Stocks Come Back After the Worst Start to a Year Ever?

Adam O’Dell
Stocks began the year with a thud. In fact, it was the worst start to a trading year… ever.
That of course means that the “First Five Days” forecasting tool, which I wrote about back on December 31, came in decidedly negative this year.
So let’s talk about what that means for stocks in 2016.
First, I should clarify what I mean by “forecasting tool,” because unfortunately, it’s just an indicator – NOT a crystal ball.
It’s not as simple as saying: If the first five days of January are down, then the entire year is destined to be a loser.
(That would be too easy.)
In fact, there are plenty of examples of when stocks fell for the first five days of January… only to go on to produce positive returns by year-end.
1927 is one example – stocks fell 1.1% in the first five days, but ended the year up 27.7%.
The next year, 1928, is another example – stocks started with a stumble, then gained 49.5% by year-end.
But those are extreme examples. In fact, those were the two strongest years that followed a negative first-five-days period.
Now, consider an example from the other extreme: 2008.
In 2008, stocks fell 5% during the first five days of January. They then went on to fall a devastating 33.8% throughout the year.
My point in walking you through examples on both ends of the spectrum is to show that the stock market has produced a wide range of returns – both positive and negative – following a negative First-Five-Days period.
But that doesn’t mean we should give up and resort to throwing darts at the wall. There’s still a lot of value in taking a “temperature check” of stocks after the first five days of January… and then deciding how much you want to risk in the stock market throughout the year. Because a deeper analysis – beyond one-off examples – shows that stocks are a less-favorable bet in years that begin soft.
Stocks might go up this year… but the probability of them doing so is only 56%, compared to 73% when stocks start the year strong.
Stocks might produce a positive return this year… but historical statistics show that if stocks go up, they’re more likely to produce a below-average return.
That means long-term, buy-and-hold investors are facing rather unfavorable odds in 2016. Basically, weaker returns… if any at all.
And while poor performance isn’t a guarantee, it sure makes sense to take protection actions today. And it’s certainly a great time to consider a more nimble approach to investing in the markets.

Adam O’Dell, CMT


Oil Hit $32 As We Predicted… But This Isn’t the End!
 On August 5 last year I forecast that oil would hit $32 or a bit lower by January.
And it’s happened right on cue!
Along with iron ore and coal (down 70%-plus), oil has been one of the worst-performing commodities – down 80% from its 2008 top. And ultimately it’s headed lower, all the way to $10 or $20. I’ve been saying this since oil was $115, and look where we are now!
The reason I’ve been so bearish on commodities, including gold, is simply my 30-year Commodity Cycle. It works like clockwork, which is why I’ve been forecasting since early 2013 that the continued commodity collapse would be one of the key triggers for the next larger crisis. No one else saw it coming, and sure enough it’s turning out to be the next stealth crisis in a global economic turndown – like the U.S. subprime crisis before it.
Falling oil prices might seem pretty okay right now since you’re not paying as much at the pump. But just you wait!
Whatever consumers might be able to save from low oil prices, it doesn’t make up for the devastating net effect to the economy and markets.
Low oil prices basically ensure the demise of the U.S. fracking “revolution” as well as the tar sands in Canada.
These two alone have added six million barrels of oil a day to global supply just since 2009, with another million about to come out of Iran with sanctions being lifted.
How is that supposed to play out with Saudi Arabia hell-bent on wiping these high-cost producers out by refusing to cut production to prop up prices like in the past? Global supply keeps going up while prices and demand are falling.
This doesn’t end well for the frackers, or the U.S. economy. Fracking is a $1 trillion industry – and worse, it’s a bubble industry. The only reason they’re still around is because global QE helped prop up the price of oil and made junk bonds so affordable. Now that the bubble is clearly popping, the frackers don’t stand a chance as they have always been among the highest cost producers! They’ll keep pumping their wells until they run dry because their operating costs are low. But their up-front costs of creating new wells are gargantuan. And with the junk bond market cratering, who in their right mind would give this doomed industry a loan? Nobody!
Just think: the fracking industry in the U.S. is a trillion-dollar sector, with hundreds of trillions of junk bond and leveraged loans, and many jobs in high growth states like Texas. All of it’s going to disappear.
And it’s even worse for the emerging countries that are big commodities exporters.
So where is oil likely heading next? To our original target near $20. I was thinking this would happen in 2017 or even later in the next great downturn. But this could happen after a near-term bounce later this year. And like Rodney said yesterday – don’t be surprised if oil stays down for years. This Commodity Cycle points down into 2020 to 2023, and demand won’t come back in a depressed global economy.
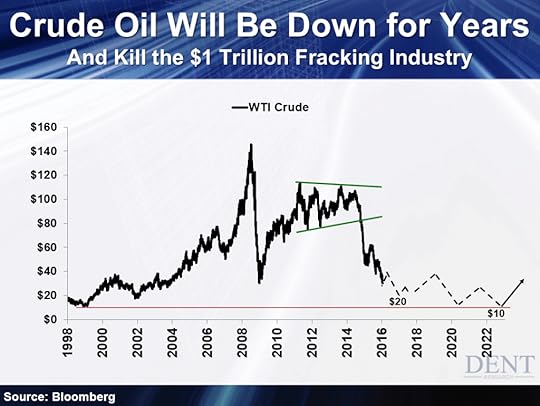
Oil is likely to bounce from this $30 level or a bit lower merely from being oversold. But any sign of the global recession worsening – which is very likely between now and the summer – should send oil to the next support level between $18 and $20.
Ultimately oil could go all the way down to its previous low in 1998 of $8 to $10…
Don’t tell me that will help consumers more than it hurts the economy. We’re talking about the destruction of a major industry in the largest oil producing countries like the U.S., Saudi Arabia and Russia. Those top three produce 36.5 million barrels of oil a day. The next 12 produce about the same at 37 million. That includes China, Canada, UAE, Iran, Iraq and Brazil. It’s not like these countries don’t have enough problems already.
In a growing world not awash with debt, falling oil prices could be a net positive, or if China and the emerging country commodity exporters were not already at the center of the emerging slowdown.
But that is not what we have today. The whole world has unprecedented debt concentrated more than ever in the emerging countries, especially China. And this global debt is most leveraged in the energy sectors that have both been further magnified by endless QE and zero interest rate policies.
If the minor subprime crisis of 2008 could trigger a global financial crisis and meltdown, what do you think the collapse of the highly leveraged global oil industry could do?
Like 2008, the stage has already been set. All we’re waiting for is the trigger.
Harry
January 13, 2016
Don’t Expect Much This Earnings Season!
 Earnings season has started. For the next few weeks, the focus of the market will be heightened around these profit releases.
Last week I talked about how jobs growth is starting to slow and how the average American is pretty much broke. Both of these facts do not bode well for corporate profits and pushing the stock market to new highs.
For one, corporate profit estimates are too high. In 2016, the expectation is that operating profits will climb by 18% for the S&P 500. The rub is that “operating profits” leave out a lot of items that impact a company’s bottom line.
It’s accounting magic. Or as George W. Bush once said: “Voodoo math.”
Not only will companies not hit their estimates, but corporate insiders know it.
Profit margins look to have peaked. Revenue growth is very sluggish. The strong dollar is acting as a huge headwind against profits. And so many share buybacks were made when stocks were at all-time highs – a horrible misuse of the company’s cash on the balance sheet!
These corporate insiders wouldn’t increasingly be playing games with their numbers if they didn’t know all this. And it shows in that their accounting shenanigans are getting more aggressive.
According to statistics from Business Insider, the percentage of companies using adjusted earnings has risen from 70% in 2010 to 90% today. Yes, 90%!
When scouring a company’s profits, you need to do a much deeper dive into the press release than just the headline numbers.
If a company is buying back a lot of stock, look at the operating cash flow and free cash flow to make sure the underlying business is healthy. Otherwise, the company could be buying back stock just to boost its earnings per share.
Also dig around to make sure the revenue and profit margins are strong. These indicate that the company is operating well and has pricing power.
Pay close attention to any unsustainable sources of earnings. They’ll help you avoid stocks that could torpedo your portfolio.
Best of luck this earnings season!
Gas Isn’t Even What It Cost in the Great Depression: It’s Less!
 I know gas is cheaper than it was a year ago, and even six months ago. With the price falling through $2 per gallon, I’m feeling pretty good when I fill up my car. Since I currently support five drivers, each with their own vehicle, cheap gas is one of my best friends.
But I want it to go lower. I want gas to be as cheap as it was when I first started paying for it myself.
As it turns out, it already is.
At just under two bucks a gallon, gas is cheaper than milk, shampoo, soda, and in some instances bottled water. Gas is so cheap that SUVs and big trucks are popular again.
But that still doesn’t register in my mind as cheap compared with historical levels. So I pulled up average annual prices going back to the late 1920s, then used the Bureau of Labor Statistics’ consumer price index calculator to adjust the prices for inflation. The current level of $1.96 per gallon isn’t an all-time low, but we’re getting close!
In 1929 autos had reached 90% market penetration in urban settings, but obviously the industry was still new and there were a lot more cars to be sold. Almost half the country still lived on the farm. In today’s dollars, gasoline was $2.91.
Then the Great Depression hit.
Everything dropped and the U.S. suffered its worst bout of deflation in history. Gasoline fell 20%, bringing it down to $2.65. So today, we are paying less for gasoline than Americans did during the Great Depression!
Gasoline prices remained low – but so did inflation – throughout the 1930s. The onset of WWII brought modestly higher fuel prices and rationing. When things settled down in the 1950s, gas was about $2.50 per gallon.
This had more to do with the strong U.S. dollar than anything else. As other countries struggled with deflation after the war and finally broke their fixed exchange rate with the dollar, their currencies would fall. This pushed up the value of the buck and we were able to buy foreign goods, including petroleum, at lower prices.
The goods times ran until the early 1970s when our domestic oil production peaked, Nixon closed the gold window stoking inflation, and Middle Eastern countries punished the U.S. for supporting Israel by drastically increasing the price of oil. In 1970, gas was $2.14. By 1975 it was $2.34 – if you could get it (think rationing and long lines).
Gas hit a top in 1982 at $3.22. At that point I was in high school southwest of New Orleans. Yes, there really is land down there. My father was a ship captain in the oil fields of the Gulf of Mexico. Everything was humming, and money was flowing. U.S. companies were drilling like crazy, but so were the Saudis and every other country with a proven oil reserve. New supply flooded the market, driving down the price of oil and gasoline for years. Sound familiar?
In 1987 gas had fallen to $1.80, and by 1998 it dropped to $1.54. At that point oil was $10 per barrel, or $14.56 in today’s dollars. In March of 1999 the Economist ran a cover depicting the world “Drowning in Oil,” and forecast the price to fall as low as $5 per barrel. It didn’t happen.
Oil has zigged and zagged with world events since then, dragging the price of gasoline with it. The highest annual average price of gas I found was $3.76 in 2012, which makes our current cost of $1.96 just a few short years later look dirt cheap.
The current situation is an unusual mix of historical time frames. We’re in the economic winter season, complete with deflationary pressures and stagnant wages, just like the 1930s. As China joins the “low-growth” club, the global slowdown will only get worse.
At the same time, vast new supplies have been added to the markets through technological breakthroughs such as fracking. That’s more reminiscent of the 1990s than any other period. With both forces weighing on the markets, slowing demand at the same time that we have greater supply, oil and gas could remain low for years.
While that spells long-term trouble for the oil patch – which now extends from the tip of Texas through North Dakota, and as far east as Pennsylvania – it will give consumers like me and my family a welcome break from what seemed like a steady march higher in the cost of living.

Rodney
January 12, 2016
U.S. Treasury Yields Are Down, But Not as Much as You’d Think
 China’s stock crash spread throughout the world last week as money moved to the safety of U.S. Treasury bonds. That’s normal when investors are skeptical of stocks. So is the resulting drop in yields, but yields didn’t drop as much as you might expect.
Warning: The Broader Stock Market Has Already Turned Bearish!
Large-cap stocks opened this morning in the green, seeming to offer a little reprieve from an ultra-violent start to 2016. Small- and mid-caps weren’t so lucky. They’re continuing to rip through fresh new lows.
This has been the toughest bull market and bubble to call, as many leading indicators that we have used in the past simply don’t work since central banks hijacked the markets after 2008. But with these major divergences continuing to build, and after many years of the Fed’s zero-percent interest rates, it seems we’re
January 11, 2016
Bear Market Checklist: Have You Done These 3 Things?
 The S&P 500 is only down about 10% from its all-time high. Yet it feels like the market is down a lot more than that.
That’s because a handful of expensive, high-flying tech stocks are supporting the index. And even then, we’re still only talking about the heavy hitters. The average stock is already well into bear market territory.
Bespoke Investment Group ran the numbers and found that the average large-cap stock is down 22.5%. For small- and mid-cap stocks, it gets a lot worse. Mid-caps are down 26.5% and small-caps are actually down more than 30%. That’s not just your garden variety correction. That’s a deep bear market.
Looking at individual sectors, it doesn’t get any better. Across all market caps, there is not a single sector close to its 52-week high. Energy stocks are down a staggering 52%, followed by materials at 34%. The best – or should I say “least bad” – sector, utilities, is down by 14%. Not quite bear market territory, but close enough.
So, is this it? Is the great bull market that started in 2009 officially over? Or is this just a much-needed pause before the next leg up?
We won’t know for sure until after the fact, but for now there appears to be no end in sight. 2015 was a rocky, trendless market, and 2016 has gotten off to a brutal start. But rather than wring our hands and cry about it, let’s sit down and make a bear market action list:
Review Your Portfolio. When the market is rising you have less incentive to really look at your portfolio. But a bear market forces you to snap to attention. So take some time today to review your portfolio. If you don’t recall why you bought a stock, it probably makes sense to sell it and move on.
Rethink What It Means to “Invest.” If you’re not comfortable investing new money in the market right now, consider diverting those funds to paying down your mortgage or other debt. If you’re paying 4% on your mortgage, you effectively earn a 4% “return” on the debt you retire.
Don’t Neglect Your 401(k) Plan or IRA. The market might be nasty right now, but your 401(k) plan is more than just an investment account. It’s also a tax shelter. And your returns are effectively 100% on employer matching. So, even if you opt to hold the funds in cash, continue pumping as much money as you can into your 401(k) plan. When you’re ready to jump back into the market, you’ll have the cash on hand.
Bear markets aren’t fun. But they can be profitable. If you want to try your luck shorting stocks, and actually make money while the market falls, you should read my friend John Del Vecchio’s Forensic Investor. He’s armed, and ready, to make money while this thing falls.

Charles Sizemore
Editor, Dent 401k Advisor

It’s the Current Boom in the Spending Cycle, But…
 In November of 2001 I was on an investment panel with three other people, including David Tice of Prudent Bear fame. He was riding high because, in addition to the recession of 2001, the markets had sold off after 9/11. His fund was doing well and he saw nothing but bad news for the economy and for him in the years ahead.
Relying on demographics, I told him and the audience that America’s economy would rebound as consumers spent more, but would then suffer a terrible blow between 2008 and 2010.
David countered that consumers were tapped out, so they had no resources for future spending. How could I expect them to blow more cash?
It was simple. Because they wanted to.
Consumer spending didn’t unfold exactly as we expected during the 2000s, but there’s no doubt that consumers ramped up their spending to dizzying heights in the housing boom, using zero-down loans and home equity lines of credit. The crash of 2008-2010 happened as expected, and consumers pulled in their spending horns.
But just as demographics pointed to an overall drop in spending, they also revealed that certain areas would rebound quicker than others.
A case in point is RVs. Nine million American households now have one.
There’s only one reason for this. Because they want to.
Statistical Surveys, Inc. reports that for the first 10 months of 2015, RV sales were up 11% over 2014 to 335,528 units. That tops the previous record in 2007, and is 78% higher than 2009, when the market crashed because buyers couldn’t get financing. Sales soared in 2010, up 46.2%, were up modestly in 2011 at 4.1%, and then have increased by double digits every year.
I don’t currently own an RV, but as I get a little older they are catching my attention on the road. There’s something about almost camping that’s appealing, as well as the freedom to change locations as I choose, and go home when it suits me.
This desire for flexibility and control says more about my age than my personality.
In 2001 we believed consumers would keep spending because the peak number of boomers were still raising their kids. They wouldn’t reach their top spending years until age 47-49, or 2008 to 2010.
After that point, we have different priorities. We want to pay down our debts and save for retirement. But we don’t go into a spending-bunker, refusing to part with our hard-earned dollars for any reason. We simply choose to spend differently. An RV is one of the things on the shopping list of empty nesters, which is why we’ve highlighted this industry for growth.
But the story doesn’t end there. Anyone thinking that they’ll jump on the bandwagon and start selling RVs needs to look a little deeper.
More Americans might want to hit the open road dragging a second home, but wages have been flat for years and lenders are still cautious when extending credit.
Buyers are scouring the Internet for deals and the average sale price is declining. We’re buying more units, but we’re choosing more modest accommodations.
This is the face of an economic winter season. Commerce continues, it just takes on a different tone.
As Chaucer wrote: “Time and tide wait for no man.” Our internal clocks tell us that time is passing. If we want to take advantage of our newfound freedom from kid-related responsibilities while we still have the stamina and physical capabilities, we can’t wait forever.
So, we compromise a bit, buying something a little smaller, or perhaps with fewer amenities, than we had originally planned. This favors retailers who focus on price, which typically means big dealers that can use their size to buy at lower prices from manufacturers. Small RV lots will find it tough to compete in this environment.
The flip side of this is service. RVs aren’t cars, they’re more like homes. There’s always something that needs fixing. An RV buyer might wait for months and travel hundreds of miles to make a purchase, but he probably won’t, or can’t, be as picky when repairing a broken water line.
So instead of opening an RV lot, those with an entrepreneurial bent might consider an RV service business instead. With so many new units hitting the road, chances are this will be a growth opportunity for at least the next 10 years.
And if you do, just remember to give me a discount if I ever need a repair!
Rodney
January 8, 2016
This New Technology Could Make Paralysis Yesterday’s Issue

Usually when people become paralyzed due to a stroke or an accident, their brain still functions normally. It’s just the brain’s pathway to the rest of the body that’s broken.
But that could soon change, as the Center for Sensorimotor Neural Engineering is leading the charge on some cutting edge research to get around this problem.
Now, I’m not talking about creating a real-life RoboCop experience. Rather, they’re developing tiny, implantable devices that will communicate with the parts of the body that are “offline.” Think of it as building a new bridge for transporting information.
Basically, these devices will enable the brain to “talk” to the paralyzed regions using wireless transmission. They’ll decode electrical signals from the brain, such as: “Hey, pick up that fork.” Or: “Hey, turn that faucet!” Then they’ll transmit what the brain wants to the nervous system for action.
Can anyone say “bypass surgery?”
This technology comes with some much-needed updates. Today’s implantable devices can lead to unwanted side effects (and drain batteries), because they’re constantly bombarding the brain will electrical impulses. But this new technology will only work on-demand. That means less battery power, less maintenance – and less “wear and tear” on the body’s already damaged neural network.
I’m currently tracking the on-demand implant technology via my social media collective intelligence tool. In the past we’ve been able to get a jump on the market by discovering emerging trends in social media before they hit mainstream news.
Researchers estimate this new technology is still about five years from fielding. But with advances in biotech we expect to see in 2016, we may see a fast track!
Hit ‘Em Where It Hurts: A Move From Russia’s Playbook
There’s an Internet myth about the U.S. space program spending millions to perfect a pen that works in space, while the Russians simply used a pencil.
It makes a nice story, but it’s not true (read to the bottom for more on that). However, there are instances where we can learn from the Russians. They go at problems in a very direct way, while we dance around them, sometimes never reaching a solution.
Take dealing with debtors, for instance.
As with America, Russia has a problem with scofflaws who don’t pay their bills, like credit cards and bank loans.
We go through the arduous task of filing court papers, requesting documentation, and desperately trying to chase people down for what they owe. The Russians just hit people right where they live.
Their latest tactic is to put deadbeats on a “no-fly” list, barring them from leaving the country. Russia’s not worried about these people fleeing and not returning. Their goal is to make it difficult for the debtors to go on a nice vacation.
The problem of overdue debt exploded in Russia over the last two years as oil prices fell and the country entered a severe recession. During 2015, some 1.7 million Russians, or roughly 1.5% of the population, spent some time on the “no-fly” list, up from 0.7 million in 2012. Presumably these people were encouraged to stay close to home, spending their extra rubbles repaying what they owe.
Maybe we could do the same sort of thing with student loans.
Credit card debt in the United States is rising very slowly. Consumers are wary about taking on more revolving debt. The two categories rocketing higher are auto loans and student loans.
With cars, at least there is an asset that can be repossessed. With student loans, there’s nothing but air. At $1.3 trillion, student loan debt now surpasses every other category of debt in the United States except mortgages. And the repayment history of borrowers is difficult at best.
The U.S. government reports the default rate on student debt is around 11.5%. That would be awful if it were true, but it’s actually much worse. That figure includes loans not yet in repayment, meaning the borrowers are still students or have some other deferment. 17% of borrowers currently in their repayment period haven’t made a stroke on their debt in over a year, making them seriously delinquent. On loans issued at least five years ago, the default rate is 28%.
Now that the U.S. government is essentially the sole issuer of student debt, these defaults mean more burden placed on all taxpayers.
Maybe we could take a page from the Russians’ playbook.
I’m not suggesting a “no-fly” list for deadbeat student loan borrowers. We can do better than that. As a parent of three kids in their late teens and early 20’s, I think I found a solution. Let’s strip social media and texting off of their smart phones, or at least put limits on them.
Think of all the people you see walking down the sidewalk or sitting in restaurants – not alone, mind you – looking down at their phones. If we could find a way to block texting and social media, then a lot of young people would suddenly have more free time to focus on things like work.
We don’t have to ban social media and texting altogether – we’re not ogres! We could just limit the time of day that such programs are available, like nights and weekends. This might greatly increase productivity in the country, and quite possibly generate a few more bucks in student loan repayments!
Obviously, I’m kidding. I’m thrilled to live in a society where such actions are illegal and aren’t tolerated.
But it does leave us with a problem. Millions of borrowers aren’t repaying their student loans, and it’s going to get worse – more debtors with bigger loans – as time goes on. If we don’t want taxpayers on the hook for those burdens, we’d better come up with an alternative solution – and fast.
As for the pen versus pencil problem in space, it wasn’t the American or Russian government that came up with a solution. It was a private American citizen.
Until 1968, both Americans and Russians used pencils in space because typical ballpoint pens would not work in zero gravity, but there were safety concerns. Pencil shavings and points could break off and float in the capsules, harming astronauts by drifting into their eyes or noses, or fouling electronics. There was also the danger of fire since pencils are flammable. Paul Fisher, owner of Fisher pens, spent roughly $1 million of his own money developing a pen that would work in space. Once perfected, he sent it to NASA for testing. After they approved of the writing utensil, Mr. Fisher sold them to the U.S. and Russian governments for about $2.95 apiece. He never charged for the R&D.
Rodney


