
Harry S. Dent Jr.'s Blog, page 117
February 19, 2016
The Housing “Recovery” Is on Shaky Ground
 Every few weeks I look forward to the jobs report that comes out the first Friday of every month. It’s not because I particularly like this report. It’s because the markets pay so much attention to it. Though I find it odd they typically only look at how many jobs were added, not the quality.
But that’s how you have to trade in today’s markets. You’ve got to know what the investment community is looking at, and how it responds. It’s a tireless job. Besides employment, other economic reports come out every day, and the markets have a different way of responding to each one. GDP, housing, consumer pricing – there’s a lot to look out for.
There’s been a lot of anxiety surrounding the housing market in particular since it crashed and dragged the global economy down with it 10 years ago. And Harry hasn’t been its biggest fan amidst talk of the “housing recovery,” because like many things in our artificial, Fed-driven economy, it’s been questionable.
So let’s take a look at where we were before the financial crisis of 2008/2009 and the top of the housing bubble in 2006/2007 to give us some context for where we are today.
First, look at the chart below showing construction jobs before and after the crisis:
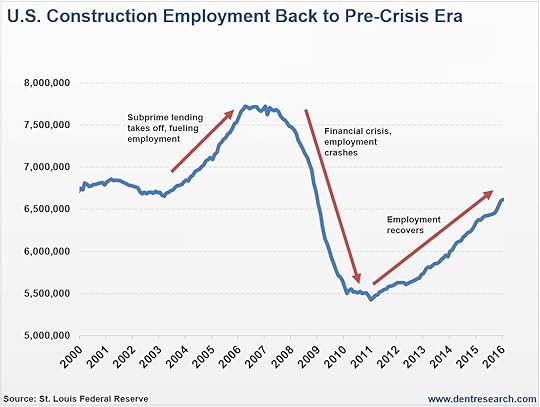
Construction jobs have grown steadily since bottoming out in 2010/2011. You can see how this sector really bubbled up during the era of subprime lending that led to the crisis. Today, employment’s back to where it was before the bubble really got crazy.
Seems okay. Next, look below at home prices over the same period:
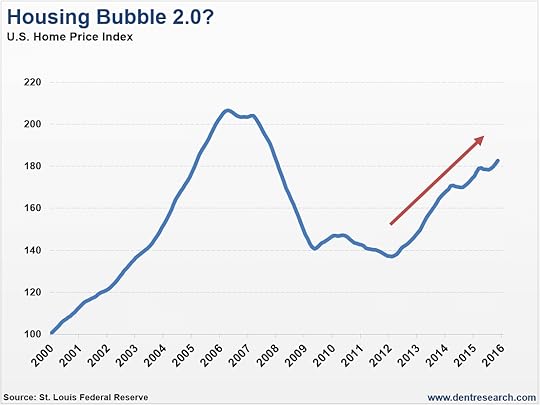
It follows a similar pattern, except it seems as if we’re quickly approaching price levels seen at the top of the bubble! After peaking in 2006, housing prices bottomed in 2012, and then the hedge funds started buying single-family homes as investment properties. This started the price rise, and the Fed’s continued low interest rate policy has fueled the rise.
So you can make the case that the Home Price Index seems high. But, just looking at the two previous charts, you would believe that our economy has completely turned around and good times are certainly ahead.
Think again.
Take a look at the chart below showing New Home Sales from the year 2000 to present:
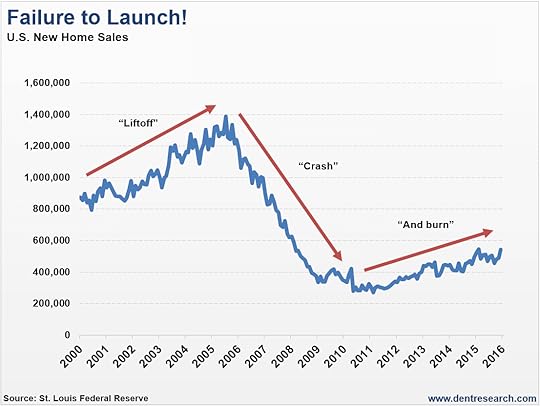
Even though new home sales are up about 80% from the bottom in 2011, sales are still 60% lower than they were at the top in 2005. And they’re about 35% lower than sales in 2000. That’s 16 years ago!
If you think about it, a lot of money and jobs revolve around the sale of a single new home. They’re vitally important to our economy. You’ve got furniture and appliance sales… utilities services… and before all that, construction and landscaping.
So you can probably understand that with fewer new homes, it would weigh down U.S. Gross Domestic Product (GDP) as well.
Well, if you look at GDP from 1960 to present, you’ll see in the chart below how housing contributes as a whole, and it’s not pretty:
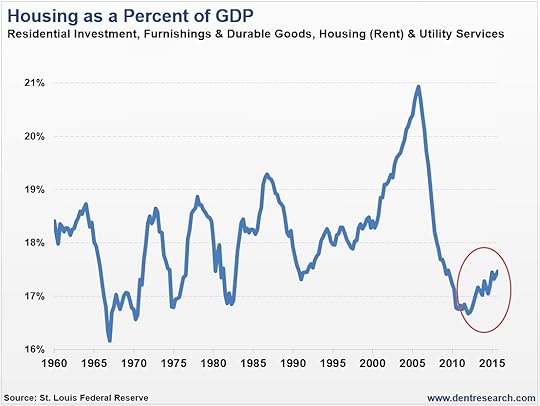
As you can see, as a percentage of our entire economy, housing is only around 17.5% of our GDP. We are back to levels seen in the 1990’s, more than 20 years ago!
Some “recovery.”
It’s true you’d expect this percentage to be less after the bubble burst. But when you think of the ripple effect that happens every time there’s a new home, you understand the problem by having less of them.
The statistics get worse. Home ownership as a percentage of households peaked in 2004 at 69.2%. Since then, it’s fallen to 63.8%, a level not seen since the mid-1960s!
Our research and demographics show that home ownership will keep falling. Our population as a whole is getting older, meaning we’re not buying new homes as much, and the younger generation certainly isn’t in a hurry to buy them either. Eventually they’ll inherit homes from their parents. All of which goes to show that the demand for new homes will fall further in years to come.
And if demand for houses is falling, it makes sense that prices will eventually fall as well.
So will construction jobs.
So will all the related industries I mentioned earlier that ripple from the new home market.
Given the trends in recent years, expect another upset in the housing market. This week alone we had a couple housing reports disappoint: the Housing Market Index and Housing Starts, which will be followed by Existing Home Sales and New Home Sales next week.
Lance Gaitan


February 18, 2016
The Recession Isn’t a Few Months Away… It’s Already Started
 So the S&P 500 is out of correction for now and the coast is clear. NOT! This is exactly what we’ve been predicting would happen – after reaching new lows, stocks would have to bounce before they inevitably resume their longer-term trend, which is down.
But stocks haven’t been the only victims of late. Just a couple weeks ago the January nonfarm payroll report came in at 151,000 jobs. So much for the expected 190,000! And of the ones reported, they were mostly low-wage jobs.
Pile that on top of the disappointing Christmas and retail sales in December. Not to mention falling stock earnings and sales growth, the worst December-to-January stock performance to date, and another banking crisis looming in Europe, especially Italy. There’s economic weakness everywhere you look!
All of this is leading me to believe that the next recession – which will lead into an even greater DEPRESSION – is not a few months away. I think it’s already begun.
Think back to the Great Recession in 2008. By the time we figured out it had started, it was months after the fact. It officially started in January 2008, three months after the stock market peaked in early October. And jobs didn’t peak and start to decline until four months later that May. Only then did the stock market see its sharp and deep crash between June and early November.
Well, of course it did! The jobs report is a lagging indicator! It doesn’t tell us anything about where we are now, which is probably why the Fed and markets-on-crack love it. Yet they think it’s the most important report that comes out. Go figure. (By the way, real estate is another lagging indicator, and Lance will have more on that for you tomorrow to tell you where we’ve been, and to give you an idea of where we’re going.)
David Stockman recently pointed out a better indicator for jobs that his colleague Lee Adler tracks.
Unlike the nonfarm payrolls report, where there’s a lot of room to fudge the numbers, this other indicator is in real time and goes right to the source: payroll! Specifically, payroll taxes that the IRS withholds from businesses.
It’s pretty obvious that if the IRS is withholding fewer payroll taxes, then there aren’t as many people on payroll. As it turns out, the trend in monthly data has been clearly downward since 2011. And the last two months are worse. Lee Adler’s daily data shows that jobs flattened in December and declined 5% in January.
Given that this is in real time, sounds like we’re already in a recession!
But let’s take a look at another indicator that shows we’re already there. This one most surprised me: the Restaurant Performance Index. What sector would you expect to benefit more from freed-up spending thanks to lower oil prices? But look where it is today:

By falling below the 100-level line, restaurants are officially in a period of contraction. The index fell to a negative reading of 99.7 in December from 101.3 in November. That’s a 1.6% drop in a month! We haven’t seen a drop this steep since late 2007!
It gets really ugly when you start digging into the index. Among the eight indicators that make it up, the December decline occurred in all of them.
For example, 73% of restaurants reported higher same-store sales in July. As of December, only 42% of them do. Ouch.
And whereas only 13% of restaurants were reporting lower same-store sales in April, now it’s 43% – more than the 42% on higher same-store sales I just mentioned. Sure, it’s higher by just a percent, but still, that’s a pivotal shift in momentum!
Digging deeper, 33% of restaurants reported higher customer traffic, but 51% reported a decline. And a quarter of them see worsening economic conditions in the next six months. Only 12% see better.
That likely points to a key tipping point in December. All of which suggests that a recession either started in that month or January.
Of course, most of the economists or analysts in bubble land aren’t seeing this. I can’t say none of them because a few are finally starting to wake up!
After stocks broke below the support level at 1,820 on the S&P 500, we were bound to get another bounce. But a much sharper and larger crash is growing very likely between sometime next month and July – and that won’t be the end of it.
We are not out of the woods yet. And we’re in for a lot of volatility ahead, so don’t expect things to settle down anytime soon.

Harry
February 17, 2016
4 Reasons You Should NOT Buy This Rally
 The market appears to be bouncing. Last week my inbox was flooded with investment firms recommending I buy this dip in the market and load up on stocks for the rebound. Doing that’s been a great strategy over the past few years, they tell me.
And they’re right.
Without fail, each dip led to a big rebound in stocks, pushing indexes like the S&P 500 and the Dow to higher highs each and every time.
Except, in the last really big dip, it didn’t happen.
And it’s doubtful the market will achieve higher highs this time either. It’s either got to go up or down. It can’t stay in limbo forever.
So, I doubt we’ve seen a bottom. There are plenty of factors working against the market in 2016 that weren’t the case before. Let’s review those headwinds.
For starters…
This market is long in the tooth. The S&P 500 bottomed out nearly seven years ago. With a few hiccups, there hasn’t been a major scare until the start of 2016 when we got off to the worst start to the year ever.
Flash crashes don’t count.
Like I said, stocks quickly rebounded from every dip lower in recent years. Yet, we are about double the amount of time we’d normally expect to have a significant pullback in stocks. After this rebound, the next one might be it.
U.S. stocks are not cheap. It boggles my mind when Wall Street strategists say that stocks are reasonably valued or (gasp)… “cheap.” They clearly need to wipe the smudges off their rose-colored glasses.
Forget about earnings, because we know earnings are heavily manipulated. Before I’ve discussed how 90% of companies are using “adjusted earnings.” It’s bogus. And in my research advisory,
February 16, 2016
Remember, Gold Is Still Down 37%
Gold is up about 14% since the year started. Today the market is a little higher so gold is down slightly. But it has momentum and could go a little higher from here.
Gold Bugs: Don’t Get Too Excited
 After looking dull for years, gold is finally sparkling again. With the market in convulsions, and Fed Chair Janet Yellen broaching the possibility of negative interest rates, the yellow metal is up over 14% in the few short weeks of 2016.
Hey, I get it. People are scared. And justifiably so.
Frankly, I’m a little scared about where all of this is going.
But before you run out and fill up the trunk of your car with precious metals (and maybe some canned goods and ammo), let’s look at gold with a cold, analytical eye.
Gold isn’t so much an investment as it is an emotional ideology. Being a “gold bug” isn’t just a matter of passionately believing in the investment merits of gold. It’s an identity, and an extreme one at that. It reminds me of a radical political movement or even a religious cult.
Investors already have an odd way of developing feelings for the assets they buy, and not just gold. Even if you insult a man’s stocks, you might as well be insulting his wife or mother. A weird possession takes hold.
But with gold, the attachment goes deeper. There is a fundamental belief that gold is the “one true store of value” or the “one true currency,” and that all imposters are heretical.
Don’t be that guy. I’ve met him. He’s a buzzkill at parties and way too intense.
But I digress.
Let’s strip away all the ideology and try to look at gold on its own merits. I would argue that the “barbarous relic” does indeed have its uses but that it’s still
February 15, 2016
And Who Said You Can’t Get Something for Nothing?
 Bill Gates once said: “Give me a lazy person to do a hard job, because they will find the easiest way to do it.”
The words of my people! Why write a letter when you can send an email? Or go to the store when you can shop online? Unless you’re slow-roasting a turkey for Thanksgiving (as any good American should), why do anything that takes longer than it has to?
But clearly this doesn’t apply just to billionaire entrepreneurs or Amazon Prime junkies. The key point in all of this, is NEVER underestimate the power of a consumer’s burning desire to be lazy.
Today, that holds especially true in the field of health and biotech.
Twenty years ago, you had to be an Olympic athlete to access the kind of tracking equipment that plugs you up to a machine and measures your heartrate. Most consumers take this technology for granted today with items like Fitbit.
Remember the Soviet Ivan Drago prepping to fight Rocky in the movie Rocky IV? Rocky is out in Siberia training with logs in the snow, while Drago is running around on incline treadmills with electrodes strapped to his body. The difference is night and day.
Nobody went running or to the gym expecting to track their steps, heart rate, calories burned, and exact GPS distance. Why do consumers want this now?
Simple…
Because they want something for nothing.
Harry talks a lot about how everyone wants to go to “financial heaven” by watching the stock market go up and never having to work again.
It’s kind of the same thing today with fitness! Most people want to carry on with their normal work, home, and recreational lives, while a tiny device measures how many steps they took to the bathroom or to get to their car. At the same time, this automatically generates health and lifestyle data they can leverage to their advantage.
I don’t know if that’s lazy or smart! A little of both, maybe?
But right now, there’s a brand new market for this so-called “lazy” lifestyle data that’s starting to change the way we live our lives. It’s as simple as punching an app on our smart phone or wearing a smart watch.
And already there are a number of practical applications for it. For example…
Some health insurance companies will actually give you a premium discount if you agree to provide them your daily step activity.
Physicians can now monitor your heart rate and other key vitals remotely. You don’t even have to go into their office for a check-up.
Or maybe you just want to tell yourself it’s OK to eat five plates of food at Golden Corral. After all, your smart watch said you already burned 1,500 calories that day.
But I haven’t even gotten to the king of couch-potato data. Measuring your steps is one thing. Nowadays, you can get a personal human genome test for a couple hundred bucks!
Companies such as 23andMe, Knome, and Sure Genomics are chomping at the bit for you to spit in a cup, and have them process it for insight into your genetic blueprint.
Seriously, all you have to do is spit, ship, sit, and watch the insight come flying in!
When fully processed, this gem of information for a single person is about 100 Gigabytes, which is roughly equivalent to the storage capacity of the highest tier iPhone.
Once processed, these companies offer services such as ancestry and genealogy linkages for as little as $199.
And for just $2,500, Sure Genomics will process over 70,000 biomarkers in your DNA, and automatically send you updates when hazardous gene mutations (like the ones that cause cancer) are found through ongoing research.
But wait, there’s more! They will also store your family medical history, personal health information, and ancestry to provide you a comprehensive genetic picture, on-demand.
If new medical research finds potentially harmful links associated with any of your genes, family health history, or ancestry, they will notify you and your physician of the possible issue.
Kind of like having your own proactive personal assistant scouring medical research for stuff that might kill you. And all you have to do is sit there? Talk about a life hack! They couldn’t make this easier.
As an investor, I’m waiting to see how these sorts of disruptive technologies will present opportunities in company stocks. But that’s for another time. It’s a holiday, and I’ve got four kids to chase.

February 12, 2016
Two Shining Opportunities in Today’s Fear-Driven Market
 Do you feel like there’s been no place to hide in 2016!?
The S&P 500 is down 11%. Eight of its nine sectors are firmly in the red. And two-thirds of individual stocks have already slipped into a bear market.
As the list of stocks hitting new lows grows by the day, the smell of fear in investor’s behavior is getting stronger and stronger. And that means panic behavior might be just around the corner.
So today I want to show you how to profit from fear and panic, rather than succumb to it.
I want to show you how to rise above the “caveman mentality” that stands between you and investing success.
You see, individuals tend to mimic the actions of those around us… even when those actions are irrational or in direct conflict with our best interests.
This “herding” phenomenon is precisely what sends financial markets into bubble territory, with historical examples dating as far back as the infamous tulip mania bubble in 1637.
But there’s a more subtle aspect to the herding phenomenon that often goes unnoticed…
It’s a phenomenon I call “scatter fear.”
And by detecting this fear among investors, I was able to identify two of the year’s top-performing investments by mid-January – the only stock market sector in the green so far and a bond market that hit new highs just yesterday.
So let me tell you about “scatter fear,” which really just comes down to one thing…
And that’s human nature.
The herd mentality and herding behavior exist because human beings are hard-wired to stick close to the group.
In caveman days, individuals who lumped themselves in with the group were better protected from predators than those who boldly struck out on their own. Over time, more of the “I’m-with-the-group” individuals survived and reproduced than those of the “I’m-on-my-own” kind.
That’s why, even in today’s supposedly civilized society, we’re conditioned to find safety and comfort in the group. And the tighter, more close-knit that group is… the safer we feel.
Interestingly, I’ve found threads of this hard-wired behavioral phenomenon in my research into stock market sectors – the main focus of my trading service, Cycle 9 Alert.
Over the years, I noticed that individual stock sectors move in a tight-knit, herd-like fashion some of the time. Other times, individual sectors “scatter” from the herd… meaning some sectors perform very strongly, while other sectors perform very poorly.
After thinking about this for a while, and meshing it with what I know about human behavior, I came up with a hypothesis: investors are probably most nervous when individual stocks are “scattering”… more so than when everything’s herding.
Think about it…
You wouldn’t worry too much to hear that the nine market sectors had returned between 5% and 10% over the last quarter (a 5% spread – low divergence).
But wouldn’t it make you scratch your head if the nine market sectors had returned between -10% and positive 15% over the last quarter (a 25% spread – high divergence)!?
So I did some research and I found that during periods of high divergence, when the sectors are scattering… defensive, “risk-off” assets tend to outperform aggressive, “risk-on” assets.
This shows that investors are indeed most nervous during high-divergence (scattering) periods. And that’s because sector scattering feels scary… and sector herding feels safe.
Just take a look at the results of my research…

Clearly, “risk-off” markets perform better during periods of high divergence. By “high divergence,” I’m referring to any point when the spread between the top and bottom sectors is 16% or more. Sometimes it’s as low as 7%, other times it’s higher than 40%. But 16% is right in the middle, so I consider anything above that to be high divergence.
As you can see, during periods of high divergence (scattering), the safest sector of the stock market, the utilities sector (XLU), earns an annualized rate of outperformance of 9.6%. And the safest bond markets – U.S. Treasuries (TLT and IEF) and municipal bonds (MUB) – earn an annualized rate of outperformance, averaging 3.2%.
And on the other side of the coin, “risk-on” markets, such as high-yield junk bonds (JNK) and the S&P 500 (SPY), underperform to the tune of 2.9% and 3.6%, annualized.
The actionable opportunity here is simple…
Invest in utilities stocks and high-quality U.S. bond markets when divergence is high (above 16%). And avoid high risk markets, like junk bonds and stocks.
Pretty interesting, right?
But this research isn’t just hypothetical. I actually used it to point Cycle 9 Alert subscribers into two top-performing “risk-off” markets in mid-January… just as we entered a high divergence environment.
Specifically, on January 19, I told them to make a bullish play on the SPDR Utilities Sector ETF (NYSE: XLU) and the iShares Municipal Bond ETF (NYSE: MUB).
And so far these have been doing quite well for us.
In just under a month, we locked in a partial profit of 61% on one of these positions. And the other one is currently up 22%… and it just hit a new high yesterday!
Even though those are great returns in just three weeks’ time, I still think both of these risk-off markets are poised to outperform for a while longer… so there’s still time to get in.

Adam O’Dell, CMT
Chief Investment Strategist, Dent Research

February 11, 2016
The Windy City Has Reached the Boiling Point
 In the 1890s Charles Dana, editor of the New York Sun, referred to Chicago as the “Windy City.” Chicago was one of many cities competing to host the World’s Fair, and clearly the writer intended the double entendre to apply to the city’s weather as well as its mouthy politicians.
When it comes to Chicago’s weather, anyone who has visited “Chi-town” (as the city is known in CB-lingo) can attest to the screaming wind off of Lake Michigan. It howls for what seems like days at 40 mph, carrying with it sub-zero temperature in the winter.
As for Chicago’s politicians, spouting hot air just happens to be a trait common to people in that profession.
But now it might be time to paint some more of them with that broad brush.
Chicago Schools Are Dead Broke
There you have it. The Chicago Public School system (CPS) is broke. Even after Mayor Rahm Emanuel took a knife to the CPS budget last summer, cutting away almost half a billion in spending, the system still faces a $500 million shortfall.
District officials have come up with the brilliant solution to fund their operations by issuing bonds, as if that will bring in more tax revenue or lower their expenses. Bond buyers would have the promise that CPS will use its “full faith and credit” to repay the bonds.
There’s only one problem. It’s a lie, and the district officials know it.
The term “full faith and credit” means that a borrower will use all assets available to repay a debt. But Chicago’s school system, in the footsteps of Detroit two years ago and now Puerto Rico, has no intention of foregoing other expenses to pay bondholders.
Hook, Line, and Sinker
Their plan, just like Detroit and Puerto Rico, is to con whomever they can into giving the system cash. They have one goal: hold off bankruptcy just one more day, until there’s not another sucker willing to take the bait.
In this case, the bait is pretty tempting. The Chicago Public School system is offering an 8.5% yield on a municipal bond, which equates to a 12.3% taxable yield at a 35% tax rate.
With property as valuable as Chicago’s backing such an offering, Chicago’s school system is counting on investors to give into greed, rather than the fear of non-payment. Many of them will. But just as
February 10, 2016
The Most Useless Question in Retirement Planning
What’s your number?
No, I’m not planning to ask you out on a date. Nothing personal, but my wife has a South American temper and is definitely the jealous type.
Rather, I’m referring to the single most common question I see in retirement planning: “What’s your retirement number?” Said another way: what size nest egg do you need to quit working?
It sounds like a reasonable and straightforward question.
The problem is, it’s completely useless.
Like so many things in the financial planning business, the question takes something complex and full of nuance, and effectively dumbs it down to the point where it doesn’t mean anything. And that’s because it misses the bitter truth about retirement: you never know how much you’re going to need.
Think about it. Who wants to spend their golden years slowly depleting their nest egg hoping they don’t outlive it? No one wants to live out their best years that way!
Some say that to retire successfully you should multiply your final salary by a factor of 10. So if in your late 60s you expect to be earning $150,000, you’d need $1.5 million to retire.
But does that actually work? Using the standard “4% Rule,” which means you withdraw no more than 4% of your portfolio value per year, that would give you an annual income of $60,000. That might be just fine.
Or it might not.
What if you need more than $60,000 to pay your bills? What if the stock market has a major setback early in your retirement and your $1.5 million gets chopped down to $750,000 or less?
You might roll your eyes now, but that’s exactly what happened to millions of people that retired or were planning to retire during the last two bear markets.
The bigger, more fundamental problem with the “number” approach is this: it makes no consideration of market valuations or expected returns.
Let’s say stocks are cheap and priced to deliver returns of 10% per year or more. Taking out 4% per year in retirement would be perfectly prudent and reasonable.
But today, using common valuation metrics like the cyclically-adjusted price/earnings ratio (“CAPE”), stocks are priced to deliver returns of less than 1% per year. That means that even a 4% withdrawal rate risks depleting your nest egg early in retirement.
This is no way to plan for your golden years. It’s income that pays your bills, not a big ol’ fat nest egg full of assets. Focusing on an asset number rather than an income stream is like putting the cart before the horse.
If this were a raging bull market, this would matter a lot less. In that scenario you could reliably sell off assets along the way to meet your income needs. But in today’s market, that’s a risky proposition.
I’m not willing to leave my retirement to the whims of chance. Are you?
This is what I recommend you do…
Step #1: Grab a piece of paper. Write down a yearly income number you think you can live on in retirement. Try to be honest and reasonable and let your current monthly expenses be your guide.
Now, once you have that number… add 20% to it. You know as well as I do that expenses always seem to find a way of turning out to be more than you expected.
Step #2: OK, now that you have your “real” income number, start subtracting any “guaranteed” income sources. This includes things like Social Security or any pensions you have.
So, let’s say you need $100,000 to live every year (after adding in your 20% cushion). And let’s assume you expect to get $40,000 per year from Social Security, and another $20,000 from a private pension.
That just leaves you with $40,000 to come up with every year to meet your $100,000 goal. And that’s Step #3.
Of course, with bond yields scraping along near all-time lows, securing a safe $40,000 (or whatever the figure is for you) may seem easier said than done. But it’s really not difficult if you know where to look.
Some people prefer annuities. I’m really not their biggest fan as a savings vehicle, but as an income vehicle it’s an entirely different story. With an immediate annuity, you give a block of cash to an insurance company, and they in turn promise you a guaranteed monthly income for the rest of your life. Or, if you’re the “do it yourself” type, you can try a rental property or two.
But whatever’s left in your portfolio, have fun.
Take a little risk, or try an active trading strategy. With your basic income needs met, you can use any trading profits for little luxuries like travel or as gifts to your kids and grandkids.
I, for one, am planning a little getaway to the Dominican Republic later this spring. So your next Economy & Markets might be delivered on a post card.

Charles Sizemore
Editor, Dent 401k Advisor

February 9, 2016
The Fed’s All Talk, But That Might Be the Point
A couple weeks ago the Bank of Japan made a startling move when it pushed a key interest rate into negative territory. After one of its officials had said just a week prior that the central bank wasn’t considering this option, the world was needless to say a little stunned.
Now there’s a lot of speculation on whether the bank was planning it all along. And of course the speculation has filtered its way over here with everyone wondering now whether the Fed will raise rates in March, June, or not at all. Many are now wondering whether the Fed will go negative as well.
But speculation’s not really my thing. We can spend hours talking in circles about what the Fed will do and when. Everyone seems to get all worked up about what the group says to get an idea toward future policy. What is important, though, is having an idea about how the market will react.
Don’t get me wrong, I’m always hopeful the Fed will say something interesting when they release their policy statement, although it’s usually pretty mundane… even boring. But what they say and do can have a huge impact on the market, so it pays to listen.
Since last month’s Fed meeting was the first of the year, I want to give you a little background on the organization that seems to hold so much influence over the direction of the economy.
Most of it is pretty cut and dry. The Federal Open Market Committee (FOMC) meets about eight times a year to discuss policy.
The committee consists of 12 voting members, eight of which don’t change, while the remaining four rotate among the Fed’s regional banks. They meet behind closed doors, and at the end release a policy statement and usually talk it out with the press.
But every now and then, the Fed holds an unscheduled policy meeting. The last time was March 4, 2014 before their regularly scheduled meeting was held two weeks later. The unscheduled meetings themselves aren’t that big of a deal. But it gives you an idea of just how careful the group is with everything they say.
Back then, everyone was still wondering when the Fed would lift rates off zero, and since unemployment was near their target of 6.5% unemployment, they had to say something.
In this case, they didn’t want to shake up the financial markets by leaving everyone to believe that a rate hike was imminent. So they met to discuss what to do with their policy language.
If you look in the minutes from that meeting, one participant wanted to stress the importance of referencing “financial conditions” instead of “financial stability.” The idea was to make it as clear as possible that factors beyond monetary policy, which is the Fed’s wheelhouse, could influence financial conditions.
If you’re wondering why all the fuss over a word, you’re asking the right question.
Ever since the Fed took up the mantle of patching over the economy’s problems under the leadership of former chair Ben Bernanke, the Fed has become as much a political organization as an economic one.
So, these dozen or so masters of the universe spend a lot of time getting the wording just right in their policy statements. They don’t want to communicate panic or joy because investors will certainly overreact! I guess their job is just to try and remain credible and keep the financial system relatively calm.
I’m not sure if the Fed has gained or lost credibility over the last 10 years. But ever since they let the genie out of the bottle by papering the landscape with quantitative easing, they sure have gained power.
In fact, central banks around the world are manipulating their currencies and trying to prop up their economies by using the same tactics that didn’t work here.
But just because central bank stimulus doesn’t actually improve the economy – just patch things over – the markets are addicted to it!
What’s interesting is that in the Fed’s last meeting, there was no mention of quantitative easing. I guess they figured out that policy has run out of juice. The talk has turned to negative interest rates, which now seems to be the policy tool of the day.
It’s likely the Fed could implement a negative interest rate policy in the future. In fact, they have already discussed the possibility. But the Fed stressed that it would take a severe global recession, unemployment at 10%, a 50% drop in stock prices, another 25% plunge in real estate prices, mounting credit losses, etc. before resorting to this tactic.
Not that they’re expecting that or anything…
Lance Gaitan


