
Michael Roberts's Blog, page 41
November 21, 2020
G20: the debt solution
This weekend, the G20 leaders’ summit takes place – not physically of course, but by video link. Proudly hosted by Saudi Arabia, that bastion of democracy and civil rights, the G20 leaders are focusing on the impact on the world economy from the COVID-19 pandemic.
In particular, the leaders are alarmed by the huge increase in government spending engendered by the slump forced on the major capitalist governments to ameliorate the impact on businesses, large and small, and on the wider working population. The IMF estimates that the combined fiscal and monetary stimulus delivered by advanced economies has been equal to 20 per cent of their gross domestic product. Middle income countries in the developing world have been able to do less but they still put together a combined response equal to 6 or 7 per cent of GDP, according to the IMF. For the poorest countries, however, the reaction has been much more modest. Together they injected spending equal to just 2 per cent of their much smaller national output in reaction to the pandemic. That has left their economies much more vulnerable to a prolonged slump, potentially pushing millions of people into poverty.
The situation is getting more urgent as the pain from the pandemic crisis starts to be felt. Zambia this week became the sixth developing country to default or restructure debts in 2020 and more are expected as the economic cost of the virus mounts — even amid the good news about potential vaccines.
The Financial Times commented that: “some observers think that even large developing countries such as Brazil and South Africa, which are both in the G20 group of large nations, could face severe challenges in obtaining finance in the coming 12 to 24 months.”
Up to now, very little has been done by the G20 governments to avoid or ameliorate this coming debt disaster. In April, Kristalina Georgieva, the IMF managing director, said the external financing needs of emerging market and developing countries would be in “the trillions of dollars”. The IMF itself has lent $100bn in emergency loans. The World Bank has set aside $160bn to lend over 15 months. But even the World Bank reckons that “low and middle-income countries will need between $175bn and $700bn a year”.
The only co-ordinated innovation has been a debt service suspension initiative (DSSI) unveiled in April by the G20. The DSSI allowed 73 of the world’s poorest countries to postpone repayments. But pausing payments is no solution – the debt remains and even if G20 governments show some further relaxation, private creditors (banks, pension funds, hedge funds and bond ‘vigilantes’) continue to demand their pound of flesh.
In advanced economies and some emerging market economies, central bank purchases of government debt have helped keep interest rates at historic lows and supported government borrowing. In these economies, the fiscal response to the crisis has been massive. In many highly indebted emerging market and low-income economies, however, governments have had limited space to increase borrowing, which has hampered their ability to scale up support to those most affected by the crisis. These governments face tough choices. For example, in 2020, government debt-to-revenue will reach over 480% across the 35 Sub-Saharan Africa countries eligible for the DSSI.
Even before the pandemic broke, global debt had reached record levels. According to the IIF, in ‘mature’ markets, debt surpassed 432% of GDP in Q3 2020, up over 50 percentage points year-over-year. Global debt in total will have reached $277trn by year end, or 365% of world GDP.
Much of the increase in debt among the so-called developing economies has been in China where state banks have expanded loans, while ‘shadow banking’ loans have increased and local governments have carried out increased property and infrastructure projects using land sales to fund them or borrowing.
Many ‘Western’ pundits reckon that, as a result, China is heading for a major debt default crisis that will seriously damage the Beijing government and the economy. But such predictions have been made for the last two decades since the minor ‘asset readjustment’ after 1998. Despite the increase in debt levels in China, such a crisis is unlikely.
First, China, unlike other large and small emerging economies with high debts, has a massive foreign exchange reserve of $3trn. Second, less than 10% of its debt is owed to foreigners, unlike countries like Turkey, South Africa and much of Latin America. Third, the Chinese economy is growing. It has recovered from the pandemic slump much quicker than the other G20 economies, which remain in a slump.
Moreover, if any banks or finance companies go bust (and some have), the state banking system and the state itself stands behind ready to pick up the bill or allow ‘restructuring’. And the Chinese state has the power to restructure the financial sector – as the recent blockage on the planned launch of Jack Ma’s ‘finbank’ shows. On any serious sign that the Chinese financial and property sector is getting too ‘big to fail’ , the government can and will act. There will be no financial meltdown. That’s not the picture in the rest of the G20.
And most important, globally the rise in debt was not just in public sector debt but also in the private sector, especially corporate debt. Companies around the world had built up their debt levels while interest rates were low or even zero. The large tech companies did so in order to hoard cash, buy back shares to boost their price or to carry through mergers, but the smaller companies, where profitability had been low for a decade or more, did so just to keep their heads above water. This latter group have become more and more zombified (ie where profits were not enough even to cover the interest charge on the debt). That is a recipe for eventual defaults, if and when, interest rates should rise.
What is to be done? One offered solution is more credit. At the G20, the IMF officials and others will push not just for an extension of the DSSI, but also for a doubling of the credit firepower of the IMF through Special Drawing Rights (SDRs). This is a form of international money, like gold in that sense, but instead a fiat currency valued by basket of major currencies like the dollar, the euro and the yen and only issued by the IMF.
The IMF has issued them in past crises and proponents say it should do so now. But the proposal was vetoed by the US last April. “SDRs mean giving unconditional liquidity to developing countries,” says Stephanie Blankenburg, head of debt and development finance at Unctad. “If advanced economies can’t agree on that, then the whole multilateral system is pretty much bankrupt.”
How true that is. But is yet more debt (sorry, ‘credit’) piled on top of the existing mountain any solution, even in the short term? Why do not the G2 leaders instead agree to wipe out the debts of the poor countries and why do they not insist that the private creditors do the same?
Of course, the answer is obvious. It would mean huge losses globally for bond holders and banks, possibly germinating a financial crisis in the advanced economies. At a time when governments are experiencing massive budget deficits and public debt levels well over 100% of GDP, they would then face a mega bailout of banks and financial institutions as the burden of emerging debt came home to bite.
Recently, the former chief economist of the Bank for International Settlements, William White, was interviewed on what to do. White is a longstanding member of Austrian school of economics, which blames crises in capitalism, not on any inherent contradictions within the capitalist mode of production, but on ‘excessive’ and ‘uncontrolled’ expansion of credit. This happens because institutions outside the ‘perfect’ running of the capitalist money markets interfere with interest and money creation, in particular, central banks.
White puts the cause of the impending debt crisis at the door of the central banks. “They have pursued the wrong policies over the past three decades, which have caused ever-higher debt and ever greater instability in the financial system.” He goes on: “my point is: central banks create the instabilities, then they have to save the system during the crisis, and by that they create even more instabilities. They keep shooting themselves in the foot.”
There is some truth in this analysis, as even the Federal Reserve admitted in its latest report on financial stability in the US. There has been $7 trillion increase in G7 central bank assets in just eight months in contrast to the $3 trillion increase in the year following the collapse of Lehman Brothers in 2008. The Fed admitted that the world economy was in trouble before the pandemic and needed more credit injections: “following a long global recovery from the 2008 financial crisis, the outlook for growth and corporate earnings had weakened by early 2020 and become more uncertain.” But while credit injections engendered a “decline in finance costs reduced debt burdens”, it encouraged further debt accumulation which, coupled with declining asset quality and lower credit underwriting standards “meant that firms became increasingly exposed to the risk of a material economic downturn or an unexpected rise in interest rates. Investors had therefore become more susceptible to sudden shifts in market sentiment and a tightening of financial conditions in response to shocks.”
Indeed, central bank injections have kicked the problem can down the road but solved nothing: “The measures taken by central banks were aimed at restoring market functioning, and not at addressing the underlying vulnerabilities that caused markets to amplify the stress. The financial system remains vulnerable to another liquidity strain, as the underlying structures and mechanisms that gave rise to the turmoil are still in place.” So credit has been piled on credit and the only solution is more credit.
White argues for other solutions. He says: “There is no return back to any form of normalcy without dealing with the debt overhang. This is the elephant in the room. If we agree that the policy of the past thirty years has created an ever-growing mountain of debt and ever-rising instabilities in the system, then we need to deal with that.”
He offers “four ways to get rid of an overhang of bad debt. One: households, corporations and governments try to save more to repay their debt. But we know that this gets you into the Keynesian Paradox of Thrift, where the economy collapses. So this way leads to disaster.” So don’t go for ‘austerity’.
The second way: “you can try to grow your way out of a debt overhang, through stronger real economic growth. But we know that a debt overhang impedes real economic growth. Of course, we should try to increase potential growth through structural reforms, but this is unlikely to be the silver bullet that saves us.” White says this second way cannot work if productive investment is too low because the debt burden is too high.
What White leaves out here is the low level of profitability on existing capital that deters capitalists investing productively with their extra credit. By ‘structural reforms’, White means sacking workers and replacing them with technology and destroying what’s left of labour rights and conditions. That might work, he says but he does not think this will be implemented by governments sufficiently.
White goes on: “This leaves the two remaining ways: higher nominal growth—i.e., higher inflation—or try to get rid of the bad debt by restructuring and writing it off.” Higher inflation may well be one option, one that Keynesian/MMT policies would lead to, but in effect it means the debt is paid off in real terms by reducing the living standards of most people. and hitting the real value of the loans made by the banks. The debtors gain at the expense of the creditors and labour.
White, being a good Austrian, opts for writing off the debts. “That’s the one I would strongly advise. Approach the problem, try to identify the bad debts, and restructure them in as orderly a fashion that you can. But we know how extremely difficult it is to get creditors and debtors together to sort this out cooperatively. Our current procedures are completely inadequate.” Indeed, apart from the IMF-G20 and the rest not having any ‘structures’ to do this, these leading institutions do not want to provoke a financial crash and a deeper slump by ‘liquidating’ the debt, as was proposed by US treasury officials during the Great Depression of the 1930s.
Instead, the G20 will agree to extend the DSSI payment postponement plan, but not write off any debts. It will probably not even agree to expand the SDR fund. Instead, it will just hope to muddle through at the expense of the poor countries and their people; and labour globally.


November 15, 2020
Covid 2021: more calamity ahead?
The news that a COVID-19 vaccine could well be available by the start of 2021 sent the stock markets of the world shooting up to new record levels. However, the rally was quickly tempered by the rocketing rise in COVID-19 infections as the northern hemisphere enters its winter. The rise is most heavily exhibited in the US and most parts of Europe. The death rate from these new infections may be lower than in the first wave last March-April, but hospitalisations are reaching new peaks in the US and parts of Europe.
This is serious for health outcomes because hospital capacity was already low in many countries, after privatisations, public sector spending cuts and outsourcing of health services conducted by most advanced capitalist governments over the last 30 years before the pandemic. India is at the bottom of the pile for hospital beds per 1000 inhabitants, not surprisingly, but note that, among ‘developed economies’, Sweden, the UK, Canada, New Zealand and Denmark are also near the bottom, with the US not much better.
That explains why these countries had to resort to lengthy and severe ‘lockdowns’ in the first wave to cope. New Zealand and Denmark did so with relative success, but the US, the UK and Sweden did not in the first wave, with a relative failure in keeping deaths down. The countries with relatively low death rates from the first COVID wave were also ones with plenty of hospital bed capacity – Japan, Korea and Germany.
In this new ‘winter wave’, health systems are better prepared and resourced but even so, patient numbers are rising fast. And now many hospital staff have been infected and forced to self-isolate, reducing the ability of health systems to cope with the winter wave of COVID-19. This is forcing many governments in Europe and states in the US to resume new lockdowns of varying severity. At the same time, people are voting with their feet and millions are staying at home, not travelling, or shopping and working on-line, and not going to cafes, restaurants, etc. This combination of lockdowns and self-isolation has stopped the nascent recovery in economic activity that began in the summer. Economic activity, as measured by mobility and spending trends, is dropping back in the major economies of the northern hemisphere.
Covid is likely to get worse before it gets better. Daily infection rates, hospitalisation and positive testing all point in this direction. The R0 (infection) rate remains well above 1.5 globally and closer to 2.0 in the US and Europe. The vaccination story provides no palliative for this in the next six months.
The hopes of further economic recovery in the last quarter of this year and next are being dashed. The European Commission has lowered its Eurozone 2021 GDP forecast to +4.2% from +6.1%. The Commission cut the GDP forecast because of the new wave in COVID-19 and the return of lockdowns. “Going forward, remaining idle capacity in capital-intensive sectors, lower profitability and elevated uncertainty are expected to weigh on investment intentions.” The Commission goes on: “The low growth momentum expected implies an annual output level in 2022 that is slightly below that of 2019 for both the euro area and the EU and thus well below the pre-pandemic growth trend, such as the one derived from the autumn 2019 forecast.” So no V-shaped recovery for Europe as the pandemic wave rises.
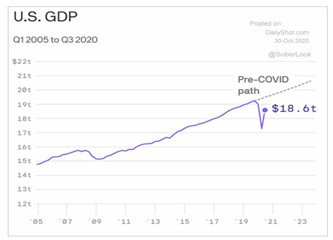
It’s a similar message for the US. Oxford Economics reckons that the ‘recovery’ is plateauing and even with a vaccine, there is no prospect of the US economy returning to its pre-virus GDP path (weak as that was) for the foreseeable future!
And that is even taking into account any future policy measures by the new Biden administration to ‘stimulate’ the economy through more government spending. As it is, even the palliative emergency spending package being disputed between the Republican Senate and Democratic House seems locked into paralysis going into 2021.
The stalled ‘recovery’, such as it was, is going to leave permanent scars on the ‘labour market’ (ie people’s livelihoods). The latest US jobs figures for October suggest that the return to work for millions has begun to fade. By last April, 22m Americans had lost their jobs or been laid off. So far, less than half of them have returned to those jobs.
The rest remain on unemployment benefit and/or emergency assistance.
The number of unemployed actually understates the problem as millions of individuals have left the labour force. Many rejoined over the summer, but the total potential labour force is still more than four million workers smaller than it was prior to the crisis, and it contracted in September, a disturbing stall in momentum.
The number of individuals who say they are on permanent layoff has also grown considerably, from 1.5 million in March to 3.8 million in September. This rise in permanent layoffs is unusually swift. In the first six months of the Great Recession, the number of permanent layoffs grew just half a million. Furthermore, research suggests people overestimate the likelihood of re-employment and each month they are out of work reduces the chances their layoff is in fact ‘temporary’. As time passes, improvements in the labour market will become harder.
One factor that has kept some afloat while being laid off has been the relative rise in real household incomes in the couple of years before the pandemic hit in 2020. According to the US Census Bureau, US median household real incomes rose 6.8% between 2018 and 2019. This rise can be disputed as it is based on inadequate surveys. Also, the rise only meant that households had clawed back their living standards after deep losses following the Great Recession ten years ago. In 2019 the unemployment rate was at a record low, while inflation had also fallen to near historic lows. As a result, households had two or even three earners, maybe at low wage rates, but combined, that improved the household income levels.
There was also a rise in wage levels from the lows post-Great Recession, and in the two years before the 2020 pandemic, that benefited the lowest paid quartile most – although with wage rises still way below the period before the Great Recession.
But the pandemic has brought that relative recovery in real incomes to an end, especially for the lowest paid. It’s low wage employment in key services and industries that is taking the biggest hit, as better paid technical and professional workers can stay at home and work and have suffered fewer job losses.
With the supply side of economies falling back as we go into the winter and 2021; demand for basic essentials still strong; and some ‘effective demand’ still there as some people run down savings and others continue to work through, there is also every prospect that the very low inflation levels of 2020 will turn up in 2021. For example, Oxford Economics forecasts a spike in US annual inflation to 3% as food and commodity prices rise because supply will lag demand and international trade growth will be weak. Even ‘core inflation’ (excluding food and energy) could jump to 2% in 2021. This matches a recent tentative forecast made on this blog using a Marxist model of inflation.
So in 2021, wage growth will slow, high unemployment will remain and inflation will pick up. It’s three-way hit to living standards for the average American family and that story applies to Europe as well.
But what about the billions who live in the so-called ‘developing economies’ of the so-called Global South? Many of these countries have been even more badly hit by the COVID-19 pandemic. Countries in Latin America lead in COVID death rates (Peru, Bolivia, Ecuador, Brazil, Argentina, Mexico), because their mainly privatised health systems cannot cope and because millions there on casual labour have been forced to go to work, if they can, to survive. Only a relatively younger population and more dispersal geographically (as in India, South Africa etc) has kept mortality rates down.
But there has been no escape economically. The economies of the global south have been trounced by the COVID pandemic as international trade closed down (-10%) and domestic economic activity collapsed. For the first time in records, the so-called emerging economies combined will suffer a contraction in real GDP, and that average includes giant China where success in dealing with COVID has meant that China is one of the few countries that will grow in 2020 (if only by about 1.5%). Among the worst hit are supposedly dynamic emerging capitalist economies like India (-10%), Brazil (-6%), Mexico (-9%), South Africa (-9%).
Inevitably this is leading to defaults by various national governments on the debts owed to private sector creditors (banks, hedge funds etc). And this is despite the claims of the IMF and World Bank that it will save such countries from the burden of servicing their debt in the pandemic. Only this week, Zambia is expected to default on its payments, thus joining a long list of past defaulters in ‘emerging economies’. As I have explained before, it’s a debt disaster, no longer waiting to happen, but already here.
Private sector bond holders are demanding their payments and there is little help from the international agencies. New World Bank chief economist Carmen Reinhart has warned that the global south faces “an unprecedented wave of debt crises and restructurings”. Reinhart said: “in terms of the coverage, of which countries will be engulfed, we are at levels not seen even in the 1930s.” “It is unthinkable that in a global pandemic, the world’s poorest countries are having to choose between making debt service payments and keeping their economies afloat,” said Gayle Smith, president of the One Campaign against poverty. It’s unthinkable, but it is happening.
As I explained in a previous post, this disaster will reverse what little progress has been made in reducing world poverty, where near 4bn people live on less than $5 a day (a more realistic threshold for poverty than that of the World Bank).
And now we have the shocking report just issued by UNICEF. UNICEF reckons that approximately 150 million additional children are living in multidimensional poverty – without access to these essential services – due to the COVID-19 pandemic, Around 45 per cent of children were severely deprived of at least one of these critical needs before the coronavirus pandemic even hit. UNICEF: “the situation for children living in multidimensional poverty is likely to worsen unless national governments and the international community step up to soften the blow.” 188 countries have imposed countrywide school closures during the pandemic, affecting more than 1.6 billion children and youth.
At least a third of the world’s schoolchildren – 463 million children globally – were unable to access remote learning when COVID-19 shuttered their schools. Schoolchildren in the poorest countries have already lost nearly four months of schooling since the start of the pandemic, compared to six weeks in high-income countries. “Even short disruptions in children’s schooling can have long-lasting negative impacts due to factors including the lack of structured programmes for catching up. In the past, school closures have led to an increase in child marriage and child labour which often prevent children from continuing their education.”
According to a study covering 118 low- and middle-income countries by the Johns Hopkins Bloomberg School of Public Health, an additional 1.2 million under-five deaths could occur in just six months due to reductions in routine health service coverage levels and an increase in child wasting. As many as 132 million people may go hungry in 2020, of that 36 million are children. And 370 million children may miss out on nutritious school meals. The nightmare of global capitalism that billions in the ‘developing countries’ already suffer is going to be intensified for years ahead.
But wait, what about the vaccine – is it not arriving as a white knight to save the world, or like a silver bullet to kill the disease of the ‘vampire’ bats? History is littered with vaccines that once introduced had to be withdrawn because they failed — and, more often than not, did harm. Vaccines are more likely to fail if they are developed under great pressure from government and the populace with trials and approvals being expedited in the name of expediency. In the development of Covid-19 vaccines it is noteworthy that so much of the testing is being done in poor countries where ‘life is cheap’. Moreover, much of the original science was done by publicly-funded institutes, but it is governments that will pay millions in exorbitant prices being charged by big pharma for the vaccines.
The intention of any vaccination is to achieve ‘herd immunity’. This calls for the R0 infection rate to fall below 1.0 and the pandemic to fade away. At a guess, herd immunity might be achieved at 50% of the population (though some say 70%). To achieve herd immunity for the one billion or so people in rich countries would therefore take 1.2 billion inoculations if two doses per person are needed, or 600 million doses if only one is required. This assumes an 80-90% efficacy rate for the vaccine. An efficiency rate closer to 50% would need double the amount of people to be inoculated and a lot more vaccines.
Extending coverage to middle-income and poor countries would multiply the required doses to between three to six billion. Theoretically, based on five to six successful vaccines being developed by mid-2021, herd immunity in rich and most middle-income countries could be achieved by production of one billion doses of each vaccine per year. This might be possible within 12-18 months according to statements of the drug companies involved. All the ‘front runner’ vaccines will be unveiled or disproven by June 2021. If successful, ramping up production to say one billion units per vaccine could take another 6-12 months.
One significant challenge in switching from laboratory to mass production scale is preserving the purity and efficacy of the product. Distribution is also a big issue. Some of these vaccines need deep-freeze, long-range distribution and transport. The Pfizer-BioNtech product — for example, needs to be kept at very low temperatures before use (as low as minus 70C).
Then there is the willingness of individuals to take vaccines. Apparently 30-50% of people in the US and Europe say they won’t take it. Up to 30% of US nurses have indicated they would not take a vaccine! There is also the issue of each vaccine’s effectiveness. It is easier to achieve herd immunity with an 80%-90% effectiveness ratio than it is with 50%. And of course, there is also the question of how long it is effective for. Current indications for most of the front-runner vaccines under development is for them to last for one to two years.
And here is the big problem. COVID-19 emerged, like other new pathogens for which human beings had no immunity from their transfer from wild animals in remote parts of the world through to animals being ‘industrially farmed’ and food markets into humans. There are many other pathogens out there still, with nothing being done to stop the transfer mechanism because nothing is being to done to curb or stop fossil fuel explorations, logging, deforestation for plantations and livestock, all in the drive for more profit for agro and energy industries.
Moreover, just as worrying is that it seems these viruses can mutate as humans infect animals in a vicious cycle, leading to further infections in humans that the current vaccines cannot be effective against. The shocking example of the Danish mink industry confirms this serious risk. It seems that caged minks (kept in tiny cages to be killed for the international fur trade) caught COVID-19 which then mutated into a variant of the virus, infecting fur farm workers. The government has been forced, in the teeth of opposition by fur farmers, to cull more than 15 million of the animals, due to fears that a Covid-19 mutation moving from minks to humans could jeopardise future vaccines.
So, as we head towards 2021, the pandemic infection rate shows no sign of stopping or even slowing. Hospitals in the northern hemisphere are under pressure and economic activity is dropping back. Employment levels are still down and real incomes are set to fall, especially for the lower paid as jobs disappear and inflation rises. For the billions in the ‘global south’ the spectre of poverty, illness and exploitation will be realised. The scarring is long term.
What can be done? Some have called for a ‘war economy’ where the state replaces the capitalist sector and directs and controls national and global resources towards people not profit. I prefer the term ‘social economy’.
This would mean: 1) emergency action to provide funds for millions north and south who have lost their livelihoods; and immediate cancellation of the debts ‘owed’ by governments of the poor south; 2) national and international plans through state projects to employ people, restore proper health and education systems free at the point of use and invest in industry, particularly ‘green’ industry; 3) take the major financial institutions into public ownership and control, along with big pharma and other strategic companies in energy, food, manufacturing and communications and 4) longer term, initiate state-led plans internationally coordinated to deliver social needs and environmentally harmonious results (ie stop deforestation and fossil fuel exploration etc) rather than expansion for private profit that will deliver yet more disasters.
Of course, nothing like this is set to happen in the near future, let alone 2021, and so we all roll on to more calamity.
November 8, 2020
US election: women, the young, the working class, the cities and ethnic minorities get rid of Trump
The Democratic party candidate, Joe Biden has beaten the Republican party incumbent Donal dTrump for the US presidency in 2020. What can we learn from election result about the United States of America, the world’s greatest imperialist power, in the third decade of the 21st century?
First, the voter turnout. With not all the votes even now yet counted, it seems that about 150m Americans of voting age will have cast their ballots. Given that there were 239m eligible to vote, that means there was about a 62% turnout (VEP).
That’s better than in 2016 at 59% and the best turnout since 1960, but it’s not as high as many media forecasts were claiming on the day of the election. It means that 37% of Americans entitled to vote did not do so. That compares with 31.4% who voted for Biden and 29.6% who voted for Trump. So once again, the No Vote party polled the highest national vote in the US election.
Moreover, there were another 20m voting age Americans excluded from the poll for various nefarious reasons (they had committed a felony or the state administration had refused their registration). So the voting age turnout was just 58%, implying that a sizeable section of America’s working classes did not vote and/or were not allowed to vote. Indeed, the ‘greatest democracy in the world’ has one of the lowest levels of voter participation of the major so-called ‘liberal democracies’.
One large slice of the population that does not exercise its right to vote is young Americans. Less than half — just 43.4% — of eligible Americans under 30 voted in the 2016 presidential election. This was much less than the 71.4% of over-60s who voted. It was even lower in this election.
Trump is saying that the election was rigged and in a way he is right. It is always rigged because the candidate with the majority of votes, let alone just the largest vote, seldom wins. In this election, Trump polled over 71m votes, the highest vote ever for a Republican. But Biden polled 75m votes, the highest vote ever for a president. But that’s because just more people voted in this election than ever before.
In the last eight presidential elections, the winner has polled less votes his main opponent. This is because the winner is the one that receives most ‘electoral college’ votes. And those votes are recorded from each state of the 50-state union. It is the United States of America, a federal union of sovereign states as formed in the American revolution of the 18th century, with each state having its own laws and electoral procedures. So building up huge votes in New York and California, the most populous states, for the Democrat candidate does not guarantee victory when narrow winning margins are achieved in lots of small states by the Republican candidate that add up to a majority in the electoral college.
So in 2016, Democrat Hillary Clinton polled 3m more votes than Trump overall, but Trump took 306 electoral college votes because he won very narrowly in a series of small to medium size states in the middle West. This time, Biden has polled even more of majority, probably about 4m, but the result appeared close because of the narrow margins in key ‘swing states’. But this time Biden took those states back from Trump and on 6 January when the electoral college meets, he will get 306 electoral votes to win, the same as Trump got in 2016.
Another reason the election result was close is that in the Republican-run states, there has been significant gerrymandering of the voting boundaries, deliberate blocking of voter registration and in this election a desperate attempt to foil massive postal balloting during the COVID pandemic. US ‘democracy’ is a joke. According to the Economist, it is at the bottom of the pile as a ‘liberal democracy’, with only Albania scoring lower!
The reason the turnout was higher this time is partly the intense polarisation in America during the COVID pandemic and the economic collapse; fuelled by Trump’s demagogic tirades. But also the COVID pandemic lockdowns led to a massive increase in postal voting, an easier process for voters than going to the polling centres. There were also significant grassroots campaigns in the big cities to get people registered and voting.
Can we learn anything from the demographics and economic composition of those who did vote? The Votecast survey of voters gives us some clues. According to the survey, male voters (47%) split 46-52 for Trump, but female voters (53%) split 55-45 for Biden. So women voters ensured a Biden victory.
The youth vote, as usual, was low, just 13% of the total vote, but those under 29 years voted 61-36 for Biden. And those aged 30-44 years (23% of the vote) also backed Biden 54-43. Those aged 45-64 (a huge 36% of the vote) went narrowly for Trump 51-48. And those over 65 years (another sizeable chunk of 27%) again narrowly voted for Trump 51-48. So 63% of those who voted were older than 44 years and backed Trump (narrowly); while those under 45 (just 37% of the vote) heavily backed Biden. That was enough to overcome the small majorities for Trump in the older age groups.
What about ethnic groups? Well, the survey found that 74% of the voters were white and they backed Trump 55-43. But all other ethnic groups overwhelmingly backed Biden. Black Americans constituted only 11% of those voting, but they backed Biden 90-8. Hispanic voters were only 10% of the total but they backed Biden 63-35. Asian voters were only 2% of the vote but backed Biden 70-28. This 25% of the voters (and growing in size in each election) so overwhelmingly backed Biden that it was enough to overcome the smaller Trump majority among the white voters.
Much has been made of the supposed increased vote for Trump by black and Hispanic Americans this time compared to 2016. But the evidence for this is dubious and even if true, the shift is tiny. According to the Edison exit poll, there was a fall-off in support by white men for Trump compared to 2012 from 62% to 57% and small rise from white women from 52% to 54%. The supposed rise in support for Trump from black men was 13% to 17% and from black women was from 4% to 8%. But considering that white voters were 75% of the vote and black voters were only 11%, the supposed shift to Trump from black voters is less than half the loss by Trump from white voters. More Hispanic voters backed Trump this time, it is claimed, but still around two-thirds did not.
What about classes and incomes? Well, by level of education, high school leavers (27% of voters) backed Trump 52-46; and those with some qualifications (34% of voters) again backed Trump but narrowly 50-48. College graduates (a sizeable 24% of voters) heavily backed Biden 56-42 and postgraduate voters (some 14%) were even more strongly pro-Biden 56-42. The more educated, the more Biden.
But that did not mean that working class Americans backed Trump more than Biden. Those voters earning $50,000 a year (the median average income) or less backed Biden significantly 53-45, and they were 38% of voters. Those in the middle-income group of $50-99k a year (36% of voters) narrowly backed Trump 50-48, while those earning over $100k a year (25% of voters) actually backed Biden 51-47. The lowest paid Americans, the largest group of voters voted for Biden by a good margin, while the small-business people and middle income earners narrowly backed Trump. The better-off backed Biden (but I suspect that the higher up the income scale, the more votes for Trump, as other surveys show that millionaires heavily backed Trump).
Yes, there is a sizeable minority of working-class Americans that backed Trump, mainly in small towns and rural areas. But the majority of working-class Americans rejected Trumpism. The urban areas (65% of votes) heavily backed Biden while the small towns and rural areas heavily backed Trump. It was here that the polarisation in the vote was greatest.
Religion also played a role. Protestant Christian believers and evangelicals (45% of voters) voted heavily for Trump while Catholics (22%) were split 50-50 and muslims, Jews and declared atheists (25% of voters) backed Biden hugely.
What were the main issues of the election? Two stand out: the COVID-19 pandemic and the state of the economy. The pandemic was considered the most important by 41% of voters and those that thought so backed Biden heavily. The economy and jobs were regarded as the most important issue by 28% of voters who heavily backed Trump. Here was another clear cause of polarisation in America: lockdowns to save lives; or no lockdowns and save jobs was how many Americans saw it in 2020.
To sum up, Americans turned out for this election in slightly larger numbers, but the turnout was still way down compared to other ‘liberal democracies’. They voted even more strongly for the Democratic candidate than in 2016, but the constitutional peculiarities of the election system made the result quite close – although, more or less, in line with pollster forecasts. Biden won because America’s ethnic minorities overcame the white majority. Biden won because younger Americans voted for Biden sufficiently to overcome Trump majorities among older voters. Biden won because working class Americans voted for him in sufficient numbers to overcome the votes of the small town business-people and rural areas.
The US election was a mess; mirroring the mess that US imperialism is now in, with the COVID pandemic running riot across America and the economy on its knees with millions unemployed, wages slashed and public services paralysed.
Biden had the backing of the majority of workers, ethnic minorities, young people and city dwellers. They voted to get rid of Trump: but they may not expect much from Biden and they will be right.
November 3, 2020
The US economy – some facts
As we await the result of the US presidential election, here are some facts about the US economy within a world context.
Share of world GDP
In 1980, it looked like this:
The US had more than twice of the share of global GDP than Japan, and more than Japan, Germany and France combined. China’s share was less than 2% and virtually the same as India.
Now in 2019, pre-COVID, it looked like this:
The US still has the largest in constant dollar terms. Although the share has declined, the US share is larger than the rest of the G7 combined. But China has rocketed up to over 16%, leaving India in its tracks.
GDP per capita growth rate 1980-2020
The US real GDP per person growth rate has averaged less than 3% a year and has been slowing consistently, while China’s has averaged around three times as much.
Share of world manufacturing output
At the start of the 1980s, US manufacturing had more than 25% of world output, with Japan at 11% and Germany 7%. China was nowhere. By 2017, the US share had slipped to about 18%, with both Japan and Germany below 10%. China had rocketed to over 25%.
Share of world exports
The US share of world exports in 1980 was over 13% with Germany and Japan well behind. China had only 1% of world exports.
In 2019, China overtook the US with nearly an 11% share while the US share slipped to 10%
Life expectancy
Life expectancy is an important measure of the quality of life. Back in 1980, the US was 21st in the world with life expectancy at birth of 73.6 years, behind most European countries and even Cuba.
By 2019, the US had dropped to 43 in the rankings with 78.5 years and China was catching up at 76.7 years.
Inequality of income and wealth
Of the G7 economies, the US has the most unequal distribution of both personal wealth and incomes.
Military expenditure
The US spends three times as much on military expenditure than China and more than the rest of the world put together!
Carbon emissions per head
The US is the world leader in carbon emissions per person, followed by the energy and minerals exporters, Australia and Canada. China’s emissions per head are less than half that of the US.
Robots per capita
Korea leads the world in robot density with more than three times the number per 10,000 employees than the US. The US lags behind Germany, Japan and Sweden. China is catching up fast and will surpass the US next year.
Homicide rate
The US has the highest homicide rate among the G7 economies, with nearly five times the average G7 rate and nine times the rate in China.
November 1, 2020
Bidenomics: boom or bust?
With just two days to go, all the public opinion polls indicate that Democratic Party candidate Joe Biden is going to win the US presidential election and oust incumbent Donald Trump. The Democrats will also solidify their majority in the lower house of the US Congress, the House of Representatives; and perhaps take over the upper house, the Senate. But even without the latter, Biden and the Democrats will have the political power to change the course of the COVID pandemic and the US economy over the next few years. But can they or will they do so?
First, let us remind ourselves of the challenges they face. The US economy is suffering the worst economic slump since the 1930s. The US Q3 GDP figures released a few days ago show that the US economy is still well below its pre-pandemic level.
US GDP is still 3.5% below its pre-pandemic level, while business investment is still some 5% below. Indeed, US real GDP is really back only to levels near the bottom of the last slump in the Great Recession of 2008-9.
And out of more than 22 million jobs lost in March and April during the lockdowns, only around 11.3 million have been recovered so far, while a new stimulus bill in the old Congress supposedly to help the unemployed was never approved.
Employed persons (000s)
While the Federal government has been supplied with funds from Congress, raised by the Federal Reserve through the purchase of government bonds, the states and local counties have been starved of funds and forced to lay off hundreds of thousands of public employees.
Meanwhile, the COVID pandemic continues to rage across the country with infection rates at record highs, encouraging people to stay at home to work (if they can); not to meet up, travel or spend on restaurants and leisure activities – even if many state governors continue to say it is fine to do so. As a result, the recovery in transactions and activities that began over the summer has stopped in its tracks. And there is still no ‘silver bullet’ of an effective vaccine in sight.
With business investment in productive activities showing little sign of recovery and employment well down, a return to the pre-pandemic trajectory of economic growth and employment is years away. Indeed, according to Oxford Economics, real GDP growth won’t return to its previous trend at all. Far from a V-shaped economic recovery, or even a U-shaped one, it’s a reverse square root trajectory, as I argued it would be.
It’s the same trajectory of economic growth that emerged after the Great Recession of 2008-9 that I spelt out in my book, The Long Depression. The US and other major capitalist economies appear to be entering another leg of that depression, ie low growth, low productive investment, low wage employment and, behind all that, low profitability in productive assets – even if the pandemic comes under control.
Remember before this pandemic erupted across the world, most capitalist economies, including the US, were already tipping into a recession, with investment slowing or even falling and production and trade stagnating.
Can a Biden administration do anything about this and is it willing to do so? According to the Biden economic team, the administration plans to increase public sector spending to compensate for the capitalist sector ‘investment strike’. Biden proposes to spend $2trn on infrastructure spending (something Trump never got round to) including ‘clean energy’ projects; just under $2trn on education and child care; $1.6trn on health care; $700bn on research and development; and $500bn on social security and housing. That’s a total of $6.8trn., or just over 30% of current GDP.
Wow! That sounds great. But hold your train; this spend is over 10 years! And this is just a proposal. Nobody expects all of this extra 2% of GDP spending a year to be implemented by Congress. Most estimates reckon that Biden’s proposals would be cut by 60% to about $3tn. The infrastructure and education proposals would be reduced by half, the health proposals would be lowered by 60% and the proposals to invest in R&D and buy American goods would be cut by two-thirds.
And then there is the method of paying for this. Biden proposes to raise taxes by $2.4trn over ten year (or $1.2trn if the spend measures are reduced). So nearly half of the spending plans would be clawed back in taxation. Most of the tax revenue would come from the top income earners particularly those in the million-dollar bracket. Also, corporation tax would be raised from the current 21% under Trump to 24% – but it would still be well under the 28% under Obama, so corporations would continue to benefit from windfall profits. Indeed, the increase would raise only a paltry $725bn over ten years. There would be no increases in property taxes for the rich. Overall, the most likely net spend after taxes under the Biden plan would be just around $1.8tn over 10 years, or no more than 0.8% of GDP a year!
So everything depends on the ‘Keynesian multiplier’ ie the increase in real GDP growth induced from an increase in government spending. Say the multiplier was as high as 2 or even 3 in the slump environment (that’s way higher than most studies show it would be ‘normally’ – it could be much lower than one), then Biden’s plan would boost real GDP growth next year by say 2% pts above the current likely growth rate next year. Biden’s plans also include boosting net immigration and pulling back on some of the tariffs on Chinese imports. Putting all this together, Oxford Economics reckons Biden’s plans would lead to a real GDP growth rate of 4.9-5.7% in 2021 compared to the status quo under Trump of 2.3-3.7%.
So even if it worked, Biden’s boom would amount to a maximum 2-2.5% pt of GDP boost to the economy over the next two years. That may get the US economy back to pre-COVID levels by the end of next year, but thereafter the growth trajectory would sink below even the weak pre-COVID growth path. The US economy would be trundling along at 1.5% a year for the foreseeable future and under 1% a year per capita GDP growth (after population increase is accounted for).
But these plans are unlikely to deliver anyway. Capitalist economies depend on investment by the capitalist sector. Capitalist investment in the US is about 15% of GDP, while government investment is less than 3% of GDP – that’s five times smaller. So it is the former that decides the pace of real GDP growth. Biden’s plans imply, at the maximum, an extra 1% of GDP in government investment; that’s not to be ignored, but hardly enough to compensate for any stagnation or decline in capitalist investment.
And that stagnation is likely unless the profitability of capitalist productive investment rises sharply under Biden. US corporate profitability is currently at a post 1945 low. Don’t be fooled by the huge profits being made by the likes of Apple, Microsoft, Facebook, Google, Netflix etc. The profits of the FAANGs are the exception that proves the rule. Outside this charmed circle, US companies are struggling to make sufficient profit to expand investment, despite historic low interest rates in order to borrow funds for investment. If interest rates do start to rise again in any recovery, particularly for small to medium sized companies which can only just service existing debts (so-called zombie companies), then far from a recovery, there could be a financial bust.
And then there is the public sector debt. Under Biden’s plan, the US Federal budget deficit will rise a cumulative $2 trillion during his first term. Publicly traded federal debt as a percent of GDP will increase from 108% when he takes office to 120% by the end of his term and 130% of GDP by the end of the decade. So even if the Federal Reserve maintains its current ‘zero interest rate’ policy and long-term bond yields remain low, the interest on government debt will rise by at least 1% of GDP. That will eat into available revenue to spend on public services. As public debt and the cost of servicing it rises, the pressure will mount on the Biden administration to ‘balance the budget’, revoke the spending plans and/or apply more tax increases on the general public.
You might say that politicians and mainstream economic policy have learnt their lesson and now realise that ‘austerity’ only makes things worse by reducing spending and ‘effective demand’. So austerity policies won’t be revived. After all, even the IMF is saying ‘spend as much as necessary and don’t worry about the consequences for debt now’. But that’s now – in the depth of the pandemic slump. When debt costs and government measures mount on the capitalist sector, capitalism will look to protect already weak profits by cutting government taxes and spending.
The supporters of Modern Monetary Theory may cry out at this point and argue that governments do not need to borrow money through debt issuance and so run up interest costs. They can just get the central banks to ‘print’ the currency and put it in the government coffers. Rising public debt is then not an obstacle to government investment and spending in order to boost the economy and deliver full employment. In a way, that is right if government spending is productive for the economy. But what is an obstacle is the willingness and capability of the capitalist sector to invest if profitability is low.
How much government investment would be necessary to replace capitalist investment and get the US economy growing at rates that restore and raise real wages, achieve full employment and apply resources and innovation to combat climate change? It would require ‘war economy’ levels when federal government investment rose to 23% of GDP and the government controlled and directed the capitalist sector to invest.
That is not on Biden’s agenda or, for that matter, on the agenda of MMT supporters, because such a move would be way more than just ‘stimulating’ the capitalist sector but actually mean ‘replacing’ its investment role. It would mean an economic revolution not wanted by Biden, and not envisaged by MMT.
In an editorial entitled “Bidenomics can preserve support for capitalism”, the Financial Times put it thus: “Since John Maynard Keynes, the best case for state intervention has not been to abolish the market, but to preserve public support for it”; and while “if implemented, Bidenomics would make life more burdensome for business and for high-earners, it might also avert a larger reckoning further down the line.”
That’s the aim of Bidenomics.
October 28, 2020
China’s growth challenge
This week the 5th plenum of the Chinese Communist Party central committee is taking place. The plenum is to discuss the progress of the Chinese economy and to decide on real GDP growth and other targets for the new 2021-25 five-year economic plan for China. The plenum will also discuss a broad plan for the next 15 years, with goals that are likely to endure for at least the rest of 67-year-old President Xi Jinping’s rule. This year’s meeting comes as the deadline for meeting the previous overarching goal of achieving a “moderately prosperous society”, is due to expire in 2021, the centenary of the founding of the Chinese Communist party.
Beijing has hinted it would broaden out its focus on economic growth to include targets for environmental protection, innovation and self-sufficient development — such as in food, energy, and in chips. This is all part of the strategy of developing a “dual circulation” economy in which China will develop domestic demand and self-sufficiency while the rest of the world remains stalled by coronavirus.
Beijing has set an average annual GDP growth-rate target in every Five-Year Plan since 1986. But this year, as the economy was pummelled by the Covid-19 pandemic, China for the first time did not define a target. The new GDP target is likely to be lowered from the 6.5% a year set in the current plan to 5% or so in the next.
There is much to discuss about China: how it dealt with the COVID-19 pandemic and how quickly it is recovering economically. Then there is how the ‘cold war’ between China and the US will pan out and what it means for the world economy. And perhaps most important of all: will China be able to continue to grow at a fast-enough pace to reduce poverty and raise living standards as it has done so successfully over the last 40 years. I shall come back to these questions in future posts, but in this post, I want to discuss China’s growth, as measured by the mainstream economics measure, gross domestic product (GDP).
The reason for doing that is because the official statistics for China’s GDP and its annual growth since the 1949 revolution have been disputed by ‘Western’ economists and even Chinese ones. The dispute ranges from just arguing that the Chinese authorities just blatantly lie and make their figures up to a more reasoned view that official calculations are faulty. That China just makes up its figures has been pretty conclusively rejected by those who have studied them closely. “The findings are that the supposed evidence for GDP data falsification is not compelling, that the National Bureau of Statistics has much institutional scope for falsifying GDP data, and that certain manipulations of nominal and real data would be virtually undetectable. Official GDP data, however, exhibit few statistical anomalies and the National Bureau of Statistics thus either makes no significant use of its scope to falsify data, or is aware of statistical data regularities when it falsifies data.”
However, there is a large body of analysis that argues that conceptual and statistical frailties in China’s statistical work has led to an exaggeration of China’s real GDP growth since the 1949 revolution and especially since the ‘market reform’ period initiated by Deng started after 1978. The main source of this view comes the US Conference Board, a mine of statistical information on the GDP, GDP per head, productivity and employment for most countries of the world. The Conference Board has adjusted China’s real GDP growth rate going back to the 1950s to produce a much lower rate of growth than the official data.
The CB finds that, while the official data reckon that real GDP growth in China from 1949 to 2019 was 8.5% a year, it was really only 5.9% a year, some 30% slower. The gap is even greater in the post-Mao period up to 2000, with China’s official real GDP growing at 9.7% a year while the CB finds it grew at 6.3% a year or 35% slower. After that, the gap between the two measures narrows somewhat. With real GDP per capita growth (taking into account population growth), the gap between the official data and the CB data is even greater.
GDP growth
1953-19
1953-78
1979-2000
00-19
08-19
Official
8.5
6.7
9.7
9.5
8.5
CB
5.9
4.4
6.3
7.3
6.0
GDP per capita growth
1953-19
1953-78
1979-2000
00-19
08-19
Official
7.1
4.5
8.4
8.9
8.0
CB
4.5
2.3
5.0
6.8
5.5
How does the CB reach different results from the official data? The CB bases its results on the work of Harry Wu from the Institute of Economic Research, Hitotsubashi University, Tokyo. Wu has worked with the great world growth economist, Angus Maddison and is the adviser to the CB on China’s stats. Wu finds conceptual and technical flaws in the official data which when adjusted produce much lower growth rates in productivity and thus in GDP and GDP per capita.
There are many faults that Wu claims to find in the official data, but there are two that deliver the largest reduction to the official growth rate. One is conceptual and one is technical. The first conceptual one is that the Chinese stats exclude any ‘non-material services’. These are financial services, business consultancy, real estate agencies etc – in other words, non-productive services. This was done in China from the beginning so that GDP reflected more the productive sectors of the economy. Of course, this is anathema to mainstream economics based on GDP conceived by Simon Kuznets to measure the progress of a capitalist economy. When Wu adds in his own estimates of these sectors to China’s GDP, this raises the total value of GDP and leads to a different scale of growth. It knocks off from China’s official growth rate 0.4% pts a year for the Mao period and 0.7% pts a year for the post-Mao period.
The second main adjustment is to the prices of produced goods. Many goods disappear over time and are replaced by new goods with different prices. So the value of the basket of goods in GDP will change accordingly. Wu adjusts GDP according to his own calculations for this, which knocks off another 1.7% pts a year in the post-Mao period. These two adjustments account for most of the difference between the official growth figures and the CB ones.
I think there is much to dispute with Wu’s adjustments. First, the official stats provide a better guide to the strength of the key productive sectors of the economy than the mainstream GDP data. Second, the Wu commodity price adjustments seem arbitrary and open to dispute. Wu’s adjustments lead not only to significantly different results for GDP growth but also to productivity growth, and to that neoclassical measure of ‘innovation’, total factor productivity (TFP).
As Wu concludes: “We have confined the present study to the well-known neoclassical growth accounting framework adopted in most of the existing studies, explicitly or implicitly. As stated at the beginning of the paper, the purpose of this study is to discover how and to what extent data problems may affect the estimated TFP growth, rather than building up a new theoretical framework to explain China’s TFP performance. For this purpose, I have maintained the same approach and the same theoretical framework. Nevertheless, it is perfectly reasonable to argue that the neoclassical framework used in this study is questionable.”
Nevertheless, Wu’s adjustments to the official GDP growth rates for China have become widely accepted. The Penn World Tables, a major database for much world economy analysis, now uses the CB estimates for China’s real GDP. So let us accept for now, the CB adjusted data for Chinese economic growth. What does it mean in gauging the past success of the Chinese economy and the likely projection for GDP, productivity and investment growth ahead?
The New York Federal Reserve has published just this week a brand, new in-depth analysis of Chinese economics growth using the Penn World Tables (and thus the CB estimates). According to the NY Fed, Chinese real GDP growth has averaged 6.9% since 1978, more than 2 percentage points below the official figure. The estimated overstatement of growth varies considerably over time, from more than 3 percentage points for much of the 1990s to less than 1 percentage point until recently. So the Wu adjustment effect is disappearing.
But even if you accept the lower rate of growth, as the NY Fed says “China’s growth performance remains remarkable. For our sample of 124 economies, China has come in above the 90th percentile of the global growth distribution more than half the time since 1982, and above the 75th percentile until just last year. China’s growth over the past 20 years (7.5 percent) somewhat lags that of the high-income Pacific Rim during the periods in which they rose to China’s current per capita income level, but stands in the middle of the pack in per capita terms (6.9 percent).” And what the Fed does not mention is that China is a giant compared to the city states of Singapore and Hong Kong and is also immensely larger in GDP and population than Taiwan, Korea and even Japan. To achieve high annual growth in such a large economy in the last two decades to 2018 is truly historic.
One of the results of this huge growth in per capital income has been a staggering rise in life expectancy. From life expectancy at birth in 1960 of just 44 years, China’s average life expectancy is now 77 years. It is catching up with the US, where there has been a fall since the end of the Great Recession. And China has outstripped all the other so-called large emerging economies.
High life expectancy and falling birth rates have meant that China has an ageing population. Indeed, the working-age (20-64) population began shrinking in 2017.
Up to now, the key to China’s economic growth has been the huge expansion of investment in machinery and technique as China moved from the labour-intensive economy of the Mao period to a hi-tech manufacturing export economy now. Of the 8.7% annual real GDP growth in the two decades before 2007, 4.7% pts came from investment (55%) – and over one-third from ‘innovation’ (TFP). Labour inputs contributed less than 15%.
The NY Fed admits that if China keeps up this pace of expansion, it “is well on track to high-income status… After all, per capita income growth has averaged 6.2 percent over the last five years, implying a doubling roughly every eleven years, and per capita income is already close to 30 percent of the U.S. level.”
But NY Fed economists along with most Western economists reckon that this will not happen. China’s growth rate will slow down because it cannot expand capital investment any more than it has and its technical prowess will not rise sufficiently to compensate. Moreover, unless it drops state-led and directed investment and allows ‘the market’ and ‘the consumer’ to become king, it cannot achieve high income status and will be locked into the ‘middle -income trap’ as so many other ‘emerging’ capitalist economies have.
The NY Fed offers three growth scenarios for the next two decades. The ‘humdrum’ scenario projects that China will fail badly in reaching the living standards of the mature capitalist economies. Even under its ‘pretty good’ scenario it will fall short of the success of Japan and other East Asian states. Only the ‘golden’ scenario will do the trick.
But in the golden scenario, real per capita income growth must average a very rapid 4.9 percent from 2018 to 2028, slowing to a still strong 2.6 percent over 2028-38 (based on CB growth figures). This leaves real incomes up by 111 percent from their level in 2018, a performance comparable to what the Asian Tigers achieved over a similar period. China then achieves high-income status, with real incomes at slightly above 60 percent of the current US level, or exactly 50 percent of the assumed future US level.
The NY Fed reckons China’s growth rate will slow because investment growth will slow and productivity enhancement from innovation will not be enough to compensate for falling employment as China ages.“There is good reason to doubt that China could sustain rapid TFP growth with such a production mix, especially given already pressing concerns about the efficiency of new investment spending.”
The NY Fed reckons that it would be “pretty extraordinary – and historically unprecedented” for Chinese growth rates to be sustained at 5% a year for the next 20 years. Beijing-based Keynesian economist Michael Pettis echoes the Fed’s view: “China’s working population is expected to be 7% lower in 15 years than it is today. In that case 4.7% GDP growth requires as great an increase in worker productivity as 5.2% GDP growth for an economy with a steady working population.”
But is that growth target really so impossible? Given that China has achieved 7% annual growth (CB figures) over the last 20 years with labour inputs contributing only 15%, it does not seem impossible that even with a zero contribution from labour (and that won’t be the case) and no change in the investment rate, that China could not manage around 5% a year economic growth by achieving a moderate 1-2% a year TFP increase . Much will depend on whether the technology upgrade that China is engaged in can deliver. And even the NY Fed admits that “China can grow rapidly for a long time before it approaches the technological frontier. There is plenty of upside, just no guarantee that it will be exploited.” Moreover, even if China does not sustain 5% annual growth over the next two decades, it will close the gap with the mature economies because growth rates there will be lucky to get above 1-2% a year (and that’s assuming no crises of capitalist production up to 2040!).
The reason that the NY Fed as well as many Keynesian and other critics of the Chinese ‘miracle’ are so sceptical is that they are seeped in a different economic model for growth. They are convinced that China can only be ‘successful’ (like the economies of the G7!) if its economy depends on profitable investment by privately-owned companies in a ‘free market’ where consumption rules over investment. And yet the evidence of the last 40 and even 70 years is that a state-led, planning economic model that is China’s has been way more successful than its ‘market economy’ peers such as India, Brazil or Russia.
The NY Fed admits that “China (could) prove a unique case, attaining high-income status while retaining governance features unlike those of all current high-income economies.” However, the “Chinese authorities have been clear about their plans to proceed with market-oriented reforms. But authorities have been equally clear that the Communist Party will retain control over the commanding heights of the economy and over political life. And in this connection, policy is currently moving in the wrong direction, toward greater state and party control of the economy.” According to the critics, this is the ‘wrong direction’; but what will the CP plenum conclude?
In future posts, I shall look at the challenges facing the Chinese economy, apart from growth, including: rising debt; climate change and the environment; inequality; the Belt and Road project; and the intensifying ‘cold war’ with the US.
October 25, 2020
A people’s guide to capitalism
It is not easy explaining relatively complex ideas in a simple and clear manner. Ask any teacher. It’s a skill lacking in many. Hadas Thier has brilliantly succeeded in that challenge with her book introducing Marxist economics. She has delivered a clear, straightforward and entertaining explanation of all Marx’s basic theoretical insights into the nature and development of capitalism.
And she has done so using modern examples that help the reader to understand why Marxist political economy is so clinical in its analysis of the reality of modern capitalist economies. I would say nobody has done it better – and I ought to know because I have tried to do such in the past, but with nowhere near Thier’s success.
I think part of the reason for Thier’s achievement is that she is an activist in the labour movement and not an academic economist. In my experience, academic Marxist economists are usually lacking in ability to explain clearly Marxist political economic ideas to others. Thier refers to her own experience: “when I first picked up a book on economics, I made it about two pages in before I broke down in tears, feeling hopeless that I could ever understand economics. The capitalist system in general, and economics in particular, are purposefully mystified. Analyzing how capitalism works is left to “the experts,” and if things look a little askew to you, well, that must be because you don’t know any better. This is doubly and triply so for working-class people, women, people of color, and other oppressed constituencies who are daily barraged with the message that we cannot hope to comprehend complex systems and ideas, let alone hope to impact.”
So Thier sets out to turn this round: “I do my best to offer enough concrete examples and jargon-free descriptions to clarify the points, which will help you keep climbing with minimal huffing and puffing.” She succeeds admirably. This book is aptly named A People’s Guide to Capitalism.
Thier says that her book “aims to follow the content and arc of Marx’s Capital. Capital’s three volumes were written to provide a theoretical arsenal to a workers’ movement for the revolutionary overthrow of the system—and to do so on the most scientific foundation possible.” But Thier rightly starts with the history of the emergence of capitalism before moving onto theory (the opposite of Marx’s approach in Capital). She deftly outlines the main concepts of Marxist economic theory, interspersed with excellent box insets on various key issues that stand on their own as insightful explanations. The subjects in these insets include: Marx on nature; the theory of marginal utility versus Marx’s value theory; how capitalism wastes so much resources; what is a bitcoin?; capitalism as a mode of production and so on.
After the chapter on how capitalism emerged from previous human social organisations, Thier then has two chapters on the “juicy questions of where profits come from and capitalism’s particular form of exploitation”. In these, she “unpack(s) the vital concepts of capital, labor, and class society”, so that “we’ll be able to see the system’s driving tendencies of competition and accumulation”. There is no room in this review to go over in detail the narrative presented by Thier; after all, the reader can do that. But in brief, Thier covers the myth of so-called free markets and the superiority of Marx’s value theory that only labour creates value for society as opposed to the ‘vulgar economics’ of ‘utility’ and ‘scarcity’ theories of value.
She also deals with the role of money in modern economies as “a universal equivalent” of exchange of commodities. In contrast to the currently fashionable modern monetary theory that claims money is the product of the state, she argues that money “necessarily crystalizes out of the process of exchange.” (Marx). And Thier deals clearly with fiat money which has replaced gold and silver in modern economies and with rising role of digital or cryptocurrencies like bitcoin.
She points out that Marx argued that price is not the same thing as value. As Marx explained, “The values of necessaries. . . might remain the same, but a change might occur in their money prices, consequent upon a previous change in the value of money. Nothing would have changed except the money names of those values” A change in the exchange-value of a particular currency does not change the value imbued in a commodity, but it will change the price. Thus, we have the kernel of a theory of inflation.
Thier also shows how capitalists must incessantly accumulate capital (value appropriated from labour power), leading to increased concentration and centralisation of assets with a few at the expense of the many. There is a trend towards monopoly on the one hand but “capitalism still maintains its dynamism through the constant jostling for market positioning by large and small companies. In some cases, a newer business, not so deeply entrenched in outmoded methods, could come out ahead.” If this were not the case, “we would see the economy increasingly dominated by fewer and fewer companies, until one day we found ourselves with a single McGoogleAmazon.”
The concept of imperialism is also taken up by Thier. It may not have been specifically analysed in Marx’s Capital but, as Thier notes, Marx and Engels wrote: “The need of a constantly expanding market for its products chases the bourgeoisie over the whole surface of the globe. It must nestle everywhere, settle everywhere, establish connections everywhere.”
The final chapters of the book look at the contradictions embedded within capitalism: the anarchy of capitalist production along with an unceasing impulse to accumulate gives way to regular crises in production and financial markets,“which so thoroughly and grotesquely score our current economic landscape.”
She exposes the failure of mainstream economic analysis to explain these regular and recurring crises in capitalist production and investment that periodically lead to mass unemployment and loss of livelihoods globally. Mainstream economics cannot explain this because its analysis “starts and ends at the surface of the economy—price fluctuations, monetary policy, and financial markets. But Marxists argue that crises originate at the system’s core and are not imposed on the system from outside.” She points out that, although “Keynesian economists offer an explanation of crises as inherent to the system, ultimately, since Keynes did not see growth or profits as essential to the system, he assumed regulation could provide a means to reassert the harmony of capitalism.” So Keynesian policy answers have proved inadequate to stop crises.
That brings me to Thier’s own view of Marxist crisis theory and here I beg to differ. Thier warns her readers that “Marxists have differed in which aspects of Marx’s writing—falling profitability, overproduction (or in some cases, underproduction), disproportionality among branches, the role of credit—are emphasized, and how these pieces fit together.”
Thier follows Marx and Engels in rightly rejecting the most popular version: underconsumption; namely that workers cannot buy all the goods they have produced and capitalists then try to sell them, causing a slump due to a ‘lack of demand’.
Instead, Thier adopts a theory of overproduction. Here she follows closely the work of Bolshevik overproduction theorist, Pavel Maksakovsky, and that of Marxist economist Simon Clarke who wrote: “capitalists throw an increasing mass of commodities onto the market. However, this increase in production has not been motivated by a desire to meet expanding demand, but by a desire to increase the production of surplus value. This compulsion creates a tendency for capitalists to overproduce—for production to run ahead of demand, often way beyond what the market can absorb.”
Thier concludes that “the fever pitch of expansion eventually oversaturates the market. Too many goods have been produced to be able to sell at the exaggerated prices produced by the boom, or even at their value. The inflation of prices hits a point at which they threaten effective demand”, and then a slump ensues.
Thier notes that “The significance and effect of the tendency for the rate of profit to fall, and its role within a broader theory of crisis, is the topic of long-standing and deep debates among Marxists.” But she dismisses this law that Marx outlines in three chapters of Volume 3 of Capital as a theory of crises. For her, this is a long-term theory “rather than producing regular economic crises, the tendency for the rate of profit to fall creates a long-term drag on capitalism.” Instead she follows Simon Clarke in arguing that “Marx did not identify the tendency for the rate of profit to fall as a “privileged cause for crises,” but it nevertheless “plays the role of a factor which makes crises more likely, primarily because it leads to an intensification of the competitive struggle between capitalists.” So Marx’s law of profitability is not an underlying cause of crises although it intensifies competition.
Those who follow this blog and have read my books will know that I do not agree with this interpretation of Marx’s crisis theory. In my view, Marx’s theory of crisis based on his law of profitability is both cyclical and secular. His law of profitability suggests regular and recurring crises of overproduction and slump followed by recovery for a while; but also an inexorable decline over decades (and longer) in the profitability of capital accumulation, suggesting an end to capitalism. But I leave the reader to decide.
The book’s last chapter also includes a substantive analysis of the Great Recession, the world’s previous major economic crisis. In this chapter, Thier offers a lively analysis of the causes of the biggest slump in the 21st century (until the current pandemic slump!). She explains the ins and outs of the Great Recession through the lens of the role of credit (‘greasing the wheels of capital’) and Marx’s concept of ‘fictitious capital’ (the result of credit speculation). She does not think it was “primarily a “financial” crisis (as some do argue)”. For her “the roots of the Great Recession of 2007 into 2009 run deeper than the world of banking and finance.”
Thier notes the huge rise of the financial sector over the last 50 years that eventually led to the global financial crash of 2008-9, but she correctly downplays the term ‘financialisation’ which is so prevalent among radical economists now because it assumes “a divide between the “real” economy of industrial capital, which engages in the production and selling of goods, but has little capital of its own from which to seed this activity, and of finance capital, which plays a purely facilitating role in circulation. In reality, there is no hard line between financial and non-financial firm.”
However, her explanation of the Great Recession falls back on what she calls “two crises of overproduction”: China’s overproduction making global markets “incapable of absorbing the increased output”; and rising US debt which “undergirded a global expansion of production and the realization of extraordinary profits, despite never resolving the worldwide glut of goods.”
Here we have the overproduction theory of crises again, with a whiff of Keynes. Slumps are caused by overproduction delivering a glut of goods. Profitability and profits have disappeared from the causal explanation of crises. For me, ‘overproduction’ is the expression of a capitalist crisis, but not its cause; that lies with falling profitability for capital. Instead, Thier adopts a ‘secular stagnation’ theory favoured by many Keynesians and the ‘monopoly finance’ school; namely that crises are not the product of falling profitability leading to a collapse in investment, but are caused by capitalism finding it difficult obtain “additional outlets for investment.” In other words, it’s too much investment and production rather that too little profit that causes crises. Again, I consider this is an inadequate theory of crises, and certainly not Marx’s.
Be that as it may, Thier has written an excellent introduction to Marx’s analysis of capitalism and one that can be regularly turned to in order to understand the waste, destruction and misery caused by the modern capitalist system of exploitation.
October 22, 2020
COVID and the trade-off
Last April, as the coronavirus pandemic took off, I ventured into an analysis of its health and economic impact. As I said at the time, “It is a risky thing to start analysing the COVID stats and coming up with some conclusions at this still early stage of the pandemic. It is even riskier for an economist to delve into areas beyond his or her supposed expertise. But after looking at myriads of articles, heaps of data and lots of presentations by people who ought to know what they are talking about, I cannot resist putting my dollar on the table.”
I think it is worth rereading that post, because, looking back, I think my analysis has held up pretty well six months later. At the end of that post, I concluded the following things. First, COVID-19 has a much higher mortality rate than flu. Second, without containment it would have increased the annual mortality rates of most countries by over 80%. Third, containment has worked in driving down potential deaths from millions to hundreds of thousands (unfortunately over a million so far). Fourth, because most governments were unprepared and lacked sufficient healthcare facilities, they were forced into varying degrees of lockdowns, bringing the world economy to a standstill. Fifth, the more severe the lockdown and the more health facilities available means generally that there will be fewer deaths; and sixth, the ‘lockdown lite’ approach risks more deaths without offering a stronger economy as a trade-off.
Now I am going to reconsider each of these conclusions in the light of what we now know – again with a fair degree of humility about what we do not know.
First COVID and flu. The debate continues to rage among epidemiologists and other ‘experts’ about whether COVID-19 has a higher mortality rate than annual flu. The so-called Barrington declaration of one group argues that COVID is no worse than flu and can be combated without draconian and damaging lockdowns, perhaps by allowing the young and fit to get the virus while isolating the old and sick, so that ‘herd immunity’ is reached (where sufficient people become immune that the virus abates). In response, most experts refute that approach. They argue that COVID is much more dangerous than flu, that herd immunity will never be reached before millions die and so the pandemic requires containment, short of an effective vaccine and maybe even then.
The infection fatality rate (IFR) measures the percentage of the population that dies from a disease. It differs from the case fatality rate (CFR), which measures the percentage of those who die from those cases confirmed as having contracted a disease. The distinction is important, because as we now know, due to poor testing and the fact that many can catch COVID without exhibiting any symptoms or reporting such for medical help, the number in the population who have been infected is much higher than those confirmed as COVID cases.
The IFR for flu averages each year anything between 0.1% and 1%. What about COVID? We don’t really know. We have data for the CFR for COVID, but by how much does the CFR differ from the IFR? The difference will vary among countries because of the age demography of the population (young people get less symptoms); the testing and tracing efficacy operating; the degree of lockdown and social distancing etc. The World Health Organisation reckons that about 10% of the global population may have been infected so far. Some micro studies of antibodies in a population group suggest higher and lower percentages. For example, it has been estimated that despite Sweden’s ‘lockdown lite’, probably only 6% of Swedes have been infected so far.
What we do know are the number of cases reported as being COVID-based and the number of deaths confirmed as due to COVID by each country’s medical authorities. Of course, the reliability of these records varies from country to country, with different criteria and levels of record varying. Nevertheless, I think we can use the data that we have from official sources globally to make some judgements on the death risk from COVID relative to flu.
So I have taken the latest official figures for COVID cases and deaths for various countries and from this worked out the CFR for each. Then I have assumed a 10% infection rate for each country’s population (probably too high) to obtain country IFRs.
This is what I calculated.
You can see that the global IFR (based on 10% infected) is only 0.14, still above the highest IFR for annual flu, but not far above. However, if you look at the some of the major infected countries globally, you can see that the IFRs are generally around 0.6-0.7, which is pretty much in line with the consensus estimate by the scientific experts. And if that is right, then COVID is at least six to seven times more deadly than annual flu. The reason the global IFR is so much lower is because many high population countries have been infected less; because many of these countries have a much greater proportion of young people than in Europe or the US; and because medical treatments and hospital care have got much better at saving lives.
The other piece of evidence that supports the view that COVID is more deadly than annual flu are the excess deaths reported for this year in various countries compared to the average. Only this week, the US Center for Disease Control and Protection (CDC) has found that 300,000 excess deaths were recorded in the US this year – 66% of which are accounted for by the official coronavirus death toll of around 220,000. Usually, between the beginning of February and the end of September, about 1.9 million deaths are reported in the US. This year, it is closer to 2.2 million – a 14.5% increase. While the remaining 100,000 deaths may not be people who had contracted coronavirus, these deaths may be indirectly related to the pandemic: a heart attack victim, for example, who might not have been able to get treatment because hospitals were overwhelmed.
By whatever measure the pandemic’s grimmest accounting is computed, the UK’s death toll — and particularly England’s — remains among the highest in the world. By its headline figure, 38,524 people in England have died within 28 days of a positive Covid-19 test, but this rises to 42,672 if you extend the cutoff to 60 days, according to the UK’s coronavirus dashboard. The Office for National Statistics, meanwhile, has tallied 50,642 death certificates mentioning Covid-19 up to October 2, and, if you begin counting on March 6, the day that the 100th positive case was recorded, 56,537 deaths in excess of the average for the same period in the past five years. This figure includes deaths from all causes, including Covid-19.
Excess deaths over ‘normal’ range from 6% in Germany to nearly 40% in Italy and the UK.
Finally, on the health aspects of COVID-19, it is becoming clearer that this virus can leave long-lasting damage to people who catch it, but do not die. What is called ‘long COVID’ can cause disorders in brain, lungs, heart, gut, liver and skin that often persist, something that is not the case with flu.
My general conclusion from this evidence is that COVID-19 is not the same as flu; it is much more dangerous and so the call by the majority of scientists that this pandemic had to be contained and not just ignored or merely ‘mitigated’ was correct. But as I said in my April post: “containment can mean many things. It can mean from total lockdown of all economic and social movement and activity to more relaxed measures, down to simply testing everybody for the virus, isolating and quarantining those infected and shielding the old, while hospitalising those with severe conditions. If a country had full testing facilities and staff to do ‘contact and trace’ and isolation; along with sufficient protective equipment, hospital beds including ICUs), then containment along these lines would work – without significant lockdown of the economy.”
Looking back, my suggestion that efficient, well-funded and resourced public health systems and methods might have been enough to avoid heavy lockdowns may have been optimistic. And that’s not just because many countries were not prepared or able to provide the facilities and resources to do that. Even in those countries with good health systems and well applied containment plans, (eg China, Korea, Germany) there was probably still the need for a lockdown and social distancing. Lockdowns worked when applied properly. China is the most exceptional example of a high-level lockdown in one large province. New Zealand applied a high-level lockdown from day one and reduced deaths to the bare minimum.
South Korea acted quickly, taking advantage of legislation passed in response to the 2012 Mers crisis that allows for extensive surveillance of its citizens during an infectious disease outbreak. A comprehensive contact-tracing operation was put in place, partnered with a rapid expansion of testing. On March 20, South Korea was carrying out 100 tests for every positive one that came back, the same day it recorded its 100th death. It took Italy three more months and 34,000 deaths to reach the same testing levels.
Unfortunately, lockdowns could not be applied effectively in many countries of the ‘Global South’. Public health systems were inadequate or non-existent. Enforcement of proper social distancing proved difficult, as many people are employed in the informal economy, without a safety net that would allow them to apply for Covid-related government handouts. They often depend on daily wages for their evening meal. In India, high levels of urbanisation, coupled with inadequate housing and sanitation, as well as a large informal labour force, formed perfect conditions for the virus to wreak havoc, especially in the country’s mega-cities and slums.
The Swedish authorities opted to what might be called ‘lockdown-lite’, with restrictions only on mass gatherings and relying on voluntary social isolation. But even though Sweden has a relatively low level of urbanisation, is away from continental Europe and has a population prepared to apply social distancing with some discipline, the cumulative COVID death rate in Sweden is not far short of Italy and Spain, and is way higher than its Nordic neighbours, Denmark, Finland and Norway, which did impose early and much stricter lockdowns.
But it is not just lockdowns. According to the IMF, mobility and economic activity dropped from April to June just as much from people deciding voluntarily to stay at home and social distance as to government lockdown restrictions.
Of course, lockdowns have been devastating for economic activity and people’s livelihoods. I have highlighted the economic impact of the lockdowns and the ensuing pandemic slump in various posts. But now it has become clear that those countries that did impose early lockdowns last March and introduced effective test and trace systems and massive medical support were able to come out of those lockdowns earlier and thus start to revive the economy.
The best example is China, where COVID first started. A draconian lockdown was imposed in Wuhan to isolate the disease from the rest of country. By April that lockdown was lifted and combined with mass testing and tracing and community cooperation on social distancing, China was able to restart its economy quickly. While the major capitalist economies of the world are struggling to recover amid a new outbreak of infections, the so-called ‘second wave’, and are waiting desperately for a vaccine to provide the ‘silver bullet’ to deal with the virus, China’s economy is now growing again.
It is achieving a V-shaped recovery, while the major capitalist economies are languishing in a long-term ‘reverse square root’ recovery, one where real GDP, employment and investment will struggle to return to pre-COVID levels for years, if at all.
What the experience of the last six months tells us is, contrary to the views of the ‘contrarians’ and ‘libertarians’ and many governments (both right-wing and supposedly left), there is no trade-off between lives and livelihoods. Containment including lockdowns can save lives and control the disease and thus enable people to get their livelihoods back – assuming their bosses have not sacked them anyway.
Countries that had invested heavily in good health systems, applied effective test and tracing and yes, early lockdowns, have saved lives AND reduced the damaging economic impact of the pandemic (they are the countries in the top left of the graph below). Those countries that have neglected or privatised their health systems, have failed to test and trace properly and have vacillated over lockdowns in order to ‘save the economy’ have ended up with more deaths and more damage to their economies (bottom right of the graph). Note the contrast between China and India, or China and the UK.
The sixth conclusion from my post last April has been proven right.
October 18, 2020
The IMF smokescreen
In its latest World Economic Outlook report, the IMF again tackled the issue of climate change, global warming and what to do about it. As it did last year, the IMF recognised that climate change was a burning issue for humanity and the planet. But this time it claimed that there were policy options that could stop any further heating to a tipping point beyond which there was no turning back.
Global emissions fell by 8.8 per cent in the first half of this year amid restrictions on movement and economic activity owing to the coronavirus pandemic, according to a new report.
But it’s coming back up.
“Unfortunately, the climate protection impact will be almost negligible,” from the COVID slump, says the report. Even though carbon dioxide emissions are lower than usual, the concentration of carbon dioxide in the atmosphere is still increasing due to continued fossil fuel consumption. “It makes almost no difference in global warming. Maybe one-hundredth of a degree difference, probably even less,” he said.
And in a report released this week, the United Nations forecast that unless global warming is stopped the planet will turn into “uninhabitable hell” for millions. The UN report put it on the line: political and business leaders are being “wilfully negligent” as natural disasters nearly double this century. In the period 2000 to 2019, there were 7,348 major recorded disaster events claiming 1.23 million lives, affecting 4.2 billion people (many on more than one occasion) resulting in approximately US$2.97 trillion in global economic losses. This is a sharp increase over the previous twenty years. Between 1980 and 1999, 4,212 disasters were linked to natural hazards worldwide claiming approximately 1.19 million lives and affecting 3.25 billion people resulting in approximately US$1.63 trillion in economic losses.
Much of the difference is explained by a rise in climate-related disasters including extreme weather events: from 3,656 climate-related events (1980-1999) to 6,681 climate-related disasters in the period 2000-2019. The last twenty years has seen the number of major floods more than double, from 1,389 to 3,254, while the incidence of storms grew from 1,457 to 2,034. Floods and storms were the most prevalent events. The report “The Human Cost of Disasters 2000-2019” also records major increases in other categories including drought, wildfires and extreme temperature events. There has also been a rise in geo-physical events including earthquakes and tsunamis which have killed more people than any of the other natural hazards under review in this report.
Much of the difference is explained by a rise in climate-related disasters including extreme weather events: from 3,656 climate-related events (1980-1999) to 6,681 climate-related disasters in the period 2000-2019. The last twenty years has seen the number of major floods more than double, from 1,389 to 3,254, while the incidence of storms grew from 1,457 to 2,034. Floods and storms were the most prevalent events. The report “The Human Cost of Disasters 2000-2019” also records major increases in other categories including drought, wildfires and extreme temperature events. There has also been a rise in geo-physical events including earthquakes and tsunamis which have killed more people than any of the other natural hazards under review in this report.
Echoing the IMF report, the UN said that “Currently, the world is on course for a temperature increase of 3.2 degrees Celsius or more, unless industrialized nations can deliver reductions in greenhouse gas emissions of at least 7.2% annually over the next 10 years in order to achieve the 1.5 degree target agreed in Paris”.
While China is the biggest emitter of CO2, mainly because of its population size, the fastest annual growth of emissions comes from India and the US.
The IMF, however, reckons that it has the answers for avoiding impending disaster: “Unaddressed, climate change will entail a potentially catastrophic human and economic toll, but it’s not too late to change course.” Keeping temperatures to levels deemed safe by scientists requires bringing net carbon emissions to zero on net globally by mid-century at the latest, but this can be done, says the IMF with two major economic policy tools which moreover “can be pursued in a manner that supports economic growth, employment and income equality”. This sounds very positive.
What are the IMF’s planet-saving economic policies? The first is to reduce the use of fossil fuel energy sources and the second is to reduce energy consumption in total. According the IMF economists, this can be done with carbon taxes and market pricing of carbon emissions. “a carbon tax makes dirty fuels more expensive, which incentivizes energy consumers to shift their consumption towards greener fuels. Total energy consumption falls too because, overall, energy is more expensive.” And on the other side of the coin, we should make “green energy cheaper and more abundant (through subsidies or direct public investment in green energy)” .
Countries should initially opt for a green investment stimulus—investments in clean public transportation, smart electricity grids to incorporate renewables into power generation, and retrofitting buildings to make them more energy efficient. This green infrastructure push will achieve two goals. First, it will boost global GDP and employment in the initial years of the recovery from the COVID-19 crisis. Second, the green infrastructure will increase productivity in low-carbon sectors, thereby incentivizing the private sector to invest in them and making it easier to adapt to higher carbon prices.
The IMF has a model that claims that its strategy to mitigate climate change could actually boost global GDP in the first 15 years of the recovery by about 0.7 percent of global GDP on average, and employment for about half of that period, leading to about 12 million extra persons being employed globally. As the recovery takes hold, preannounced and gradually rising carbon prices will become a powerful tool to deliver the needed reduction in carbon emissions. “If implemented, such a policy program would put the global economy on a sustainable path by reducing emissions and limiting climate change. The net effect would approximately halve the expected output loss from climate change and provide long-term real GDP gains well above the current course from 2050 onward.” So it seems we can have our cake and eat it: more growth and zero emissions!
However, the IMF does admit that, despite the long-run benefits and an initial boost to economic activity, its policies do impose costs along the transition. Between 2037–50, the mitigation strategy would hold global GDP down by about 0.7 percent on average each year and by 1.1 percent in 2050 relative to unchanged policies. But says the IMF, “These costs seem manageable, however, considering that global output is projected to grow by 120 percent between now and 2050. The drag on output could be further reduced if climate policies incentivize technological development in clean technologies—through R&D subsidies, for instance. Moreover, the package would be neutral for output during that period if important benefits in the form of better health outcomes (due to reduced pollution) or less traffic congestion are considered.”
Also the IMF recognises that “low-income households are more likely to be hurt by carbon pricing, as they spend a relatively large share of their income on energy and are more likely to be employed in carbon-intensive manufacturing and transportation.” But governments can use various policies to limit the adverse effects of higher carbon prices on households eg cash transfers and public spending. And jobs can be saved by “retooling workers will also help to smoothen job transitions to low-carbon sectors.”
This all sounds great. Global warming avoided, economic growth and jobs continuing and all through market-oriented measures and government investment, without touching the sides of the fossil fuel industry and multi-national control of energy, mineral and raw materials production.
The first thing to note, however, that the IMF model assumes no financial and investment crises in capitalist production for the next 30 years! It projects average annual global growth of 3.3% up to 2050. And yet it also reckons its ‘mitigation’ strategy would knock 1%pt a year off that rate. On that basis, per capita real GDP growth would be barely above population growth in many countries of the Global South. The model does not really avoid the conflict between lives and livelihoods.
The IMF also clings to the mainstream neoclassical model of relying on market pricing to alter production and consumption. Carbon emissions will be priced in markets to account for the ‘social cost of carbon’ in pollution and global warming. But economists who have attempted to calculate what that ‘social price’ should be have found that there are so many factors involved and the pricing must be projected over a such a long time horizon that is really impossible to place a monetary value on the social damage – estimates for the carbon price range from $14 per ton of CO2 to $386! “It is impossible to approximate the uncertainties in low-probability but high-damage, catastrophic or irreversible outcomes.” Indeed, where carbon pricing has been applied, it has been a miserable failure in reducing emissions, or in the case of Australia, dropped by the government under the pressure of energy and mining companies.
The other IMF policy is for public investment in ‘green technology’. Here the IMF turns to carbon capture. While carbon capture can work, at least in theory, it is prohibitedly expensive and may even become part of the problem. For example, consortium including Amazon and Microsoft invested in CarbonCure Technologies, a Canadian firm seeking to slash the carbon dioxide emissions of concrete. But producing cement, the key ingredient in concrete, creates so much CO2 that if the industry were a country only China and the US would emit more over the course of a year.
Moreover, carbon capture is still in its infancy – there are only about 20 projects in commercial use worldwide, according to the IEA. And even supportets of CCT admit that “We are at a tipping point and no one knows quite how it will tip,” said Klaus Lackner, an Arizona State University expert in the field who invented “mechanical trees” that remove CO2 from the air. Lackner said the world was likely to surge beyond the 1.5C global heating limit set out in the Paris climate agreement. “We are living in an overshoot world where 1.5C will be missed,” he said. “We are going to have to step harder on the brakes and we are going to have to get carbon back.”
The IMF’s policy proposals are creating a ‘smokescreen’ (literally! ) to hide the reality that, as long as the fossil fuel industry and the other big multinational emitters of greenhouse gases are untouched and not brought into a plan for phasing them out, the tipping point for irreversible global warming will be passed.
The world’s most authoritative body of energy analysts, the International Energy Agency, found in its latest annual flagship report that the world is headed toward global warming higher than the Paris Agreement’s most aggressive limit of 1.5°C. The agency, reckons that getting fossil fuels substantially out of the energy system, it says, would cost 25% more than the $54 trillion the world is already expected to invest by 2040.
In its 2020 World Energy Outlook, the IEA that while “The era of global oil demand growth will come to an end in the next decade , but without a large shift in government policies, there is no sign of a rapid decline. Based on today’s policy settings, a global economic rebound would soon push oil demand back to pre-crisis levels.”
Bringing about a 40% reduction in emissions by 2030 requires, for example, that low-emissions sources provide nearly 75% of global electricity generation in 2030, up from less than 40% in 2019 – and that more than 50% of passenger cars sold worldwide in 2030 are electric, up from 2.5% in 2019.
And if today’s energy infrastructure continues to operate as it has in the past, it would lock in by itself a temperature rise of 1.65 °C. That is beyond the tipping point for the extinction of planetary species, destructive weather and mass migration.
October 13, 2020
A prize auction
This year’s ‘Nobel’ (actually the Riksbank) prize for economics went to Stanford University economists, Paul Milgrom and Robert Wilson. According to the Royal Swedish Academy of Sciences, they “have studied how auctions work. They have also used their insights to design new auction formats for goods and services that are difficult to sell in a traditional way, such as radio frequencies. Their discoveries have benefited sellers, buyers and taxpayers around the world.”
So in a world where inequality is at record levels, global warming and environmental degradation are threatening to destroy the planet and there is a world economic slump not seen since the 1930s, the prize givers recognise the work of two economists on how to make the auctions of commodities, land and services more efficient.
Our prize winners used game theory to work out how to avoid the ‘winner’s curse’ of buyers paying too much for something in an auction, while making sure sellers getting a ‘fair price’ ie a fair exchange based on an agreed common value for a sale of a good or service. Milgrom and Wilson apparently came up with some auction rules that ensure that the ‘private’ estimates of value by bidders and sellers are combined to deliver a ‘common’ value acceptable to all.
[image error]
All this was theory that had to be put into practice – indeed, as Wilson said, he had struggled to think of an auction in which he himself had participated. But then added: “My wife points out to me that we bought ski boots on eBay. I guess that was an auction.” But this is no crime. Einstein’s ‘game changing’ theories were developed without practical application and were only confirmed by the empirical work of others.
Apparently, Wilson and Milgrom’s game theory of auctions has been used in practical situations with ‘success’. The Nobel team cite the auction they designed so that the US authorities could sell radio frequencies to telecom operators. As they comment: “These frequencies are government owned, but private actors can often utilise them more efficiently.” So the economists’ theories were applied in order to make the privatisation of services owned by the public more efficient, particularly for the bidders, so that they did not pay too much for them.
The Nobel team consider this a benefit to society. “Auction outcomes are also very important for us as taxpayers and as citizens. Often, the companies that manage our home refuse collection have won a public procurement by placing the lowest bid. Flexible electricity prices, which are determined daily in regional electricity auctions, influence the cost of heating our homes. Our mobile phone coverage depends on which radio frequencies the telecom operators have acquired through spectrum auctions. All countries now take loans by selling government bonds in auctions. The purpose of the European Union’s auction of emission allowances is to mitigate global warming.”
So this prize for economics is won by two people whose theory has been used to make markets work more efficiently, supposedly to keep the price of energy and communications down and ‘mitigate global warming’. What can you say about this nonsense? How has any of this really helped controlling prices in the shops, the rents paid for housing, the utility charges demanded by various monopolies and for that matter the cuts, outsourcing and privatisations of public services etc? This is an award for generating private profits.
Ironically, it turns out that the game theory of our winners has huge black holes in it, costing taxpayers millions. Luigi Zingales has explained how private equity companies have ‘gamed’ the auction process in radio and TV licences despite the brilliant theories of our prize winners. “I think economists like to focus on theory, and theories don’t always play out in terms of practical realities. I can see why economists are thinking about the best way to structure this auction. And they’re like, “You know what? It should involve these two different components.” But they weren’t thinking about the fact that private-equity firms could just kind of sneak their way in and insert themselves into this auction process as a third component. And so, even though in theory they may have been correct, they weren’t really looking at the whole practical picture of how markets work.”
But all this says a lot about what mainstream economics is for; namely to improve the profitability of capital and defend the market model. Any critic of those objectives is not going to be recognised as making a ‘contribution to society’. John Maynard Keynes would never have won the economics prize, except perhaps for his obscure mathematical thesis on uncertainty and risk; or perhaps on his long forgotten Treatise on Money. Certainly his ‘game-changing’ General Theory would have been ignored. And it goes without saying that other great critics of capitalism and mainstream economics of the heterodox and Marxist schools would not even get a nomination.
You only have to look at the list of Riksbank economics winners to realise everything depends on showing that capitalism works in the best of all possible worlds, and thus ignores the reality of inequality, poverty and crises of production. The classic case was the prize given to Eugene Fama in 2013. Fama got it for his work on showing that financial markets work efficiently to price stocks and bonds – the ‘efficient market hypothesis’. It’s another theory like auction theory – markets can work efficiently with the ‘right rules’.
After the global financial crisis of 2008-9 appeared to refute Fama’s theory of efficient markets, he famously (infamously?) commented that “We don’t know what causes recessions. I’m not a macroeconomist, so I don’t feel bad about that! We’ve never known. Debates go on to this day about what caused the Great Depression. Economics is not very good at explaining swings in economic activity”. So no prizes there.
Never shy of making pointed statements, in a new interview, the Professor of Finance at the University of Chicago reckoned forecasting markets was a waste of time. Economists cannot know anything really. “You don’t really know what’s determining inflation at this point. There is no control over the stock of what qualifies as money, since reserves aren’t really money anymore because they are paying interest. That means you can’t control the currency supply. In other words: Inflation is totally out of the control of central banks.” Again, no prizes there.
Fama goes on: “we don’t see a big effect of Fed actions on real activity or on stock prices or on anything else. That’s why I use to say that the business of central banks is like pornography: In essence, it’s just entertainment and it doesn’t have any real effects.” So much for mainstream and modern monetary theory.
As for the current slump, Fama comments: “we really don’t know what the response will be if and when there’s a cure for this disease. For instance, what will the response of consumers be at that point? Everybody wants to know if we are going to get a V-shaped response. But nobody knows because you don’t know what people are going to do when this is over.”
There is a grain of truth in all this. Mainstream economics has no convincing explanation for inflation or slumps, or financial bubbles and crashes. You cannot know what is happening because there are too many volatile variables. So Fama says, just recognise that stock and bond prices are what they are – end of discussion. And you can get a Nobel prize for these observations. No wonder the Nobel team awards the prize to people who work out how to make auctions ‘more efficient’ and ignore the big issues.
Michael Roberts's Blog

- Michael Roberts's profile
- 35 followers


![[image error]](https://thenextrecession.files.wordpress.com/2020/11/g20-1.png)
![[image error]](https://thenextrecession.files.wordpress.com/2020/11/g20-2.png)
![[image error]](https://thenextrecession.files.wordpress.com/2020/11/g20-3.png)
![[image error]](https://thenextrecession.files.wordpress.com/2020/11/covid21-1.jpg)
![[image error]](https://thenextrecession.files.wordpress.com/2020/11/hosp-beds.png)
![[image error]](https://thenextrecession.files.wordpress.com/2020/11/covid21-a.png)
![[image error]](https://thenextrecession.files.wordpress.com/2020/11/cov21-3.png)
![[image error]](https://thenextrecession.files.wordpress.com/2020/11/cov21-4.png)
![[image error]](https://thenextrecession.files.wordpress.com/2020/11/cov21-5.png)
![[image error]](https://thenextrecession.files.wordpress.com/2020/11/cov21-6.jpg)
![[image error]](https://thenextrecession.files.wordpress.com/2020/11/cov21-7.png)
![[image error]](https://thenextrecession.files.wordpress.com/2020/11/cov21-8.png)
![[image error]](https://thenextrecession.files.wordpress.com/2020/11/cov21-9.png)
![[image error]](https://thenextrecession.files.wordpress.com/2020/11/cov21-10.jpg)
![[image error]](https://thenextrecession.files.wordpress.com/2020/11/cov21-11.png)
![[image error]](https://thenextrecession.files.wordpress.com/2020/11/cov21-12.png)
![[image error]](https://thenextrecession.files.wordpress.com/2020/11/cov21-13.png)
![[image error]](https://thenextrecession.files.wordpress.com/2020/11/cov21-14.png)
![[image error]](https://thenextrecession.files.wordpress.com/2020/11/el1.png)
![[image error]](https://thenextrecession.files.wordpress.com/2020/11/el2.jpg)
![[image error]](https://thenextrecession.files.wordpress.com/2020/11/el3.png)
![[image error]](https://thenextrecession.files.wordpress.com/2020/11/el5.png)
![[image error]](https://thenextrecession.files.wordpress.com/2020/11/el4.jpg)
![[image error]](https://thenextrecession.files.wordpress.com/2020/11/us1.png)
![[image error]](https://thenextrecession.files.wordpress.com/2020/11/us2.png)
![[image error]](https://thenextrecession.files.wordpress.com/2020/11/us3.png)
![[image error]](https://thenextrecession.files.wordpress.com/2020/11/us4.png)
![[image error]](https://thenextrecession.files.wordpress.com/2020/11/us5.png)
![[image error]](https://thenextrecession.files.wordpress.com/2020/11/us6.png)
![[image error]](https://thenextrecession.files.wordpress.com/2020/11/us7.png)
![[image error]](https://thenextrecession.files.wordpress.com/2020/11/us8.png)
![[image error]](https://thenextrecession.files.wordpress.com/2020/11/us9.png)
![[image error]](https://thenextrecession.files.wordpress.com/2020/11/us10.png)
![[image error]](https://thenextrecession.files.wordpress.com/2020/11/us11.png)
![[image error]](https://thenextrecession.files.wordpress.com/2020/11/us12.jpg)
![[image error]](https://thenextrecession.files.wordpress.com/2020/11/us13-1.jpg)
![[image error]](https://thenextrecession.files.wordpress.com/2020/11/bid1.jpg)
![[image error]](https://thenextrecession.files.wordpress.com/2020/11/bid2.jpg)
![[image error]](https://thenextrecession.files.wordpress.com/2020/11/bid3.png)
![[image error]](https://thenextrecession.files.wordpress.com/2020/11/bida.png)
![[image error]](https://thenextrecession.files.wordpress.com/2020/11/bid5.png)
![[image error]](https://thenextrecession.files.wordpress.com/2020/11/bid6.jpg)
![[image error]](https://thenextrecession.files.wordpress.com/2020/11/bid7.png)
![[image error]](https://thenextrecession.files.wordpress.com/2020/10/plen-1.jpg)
![[image error]](https://thenextrecession.files.wordpress.com/2020/10/plen2.png)
![[image error]](https://thenextrecession.files.wordpress.com/2020/10/plen3.png)
![[image error]](https://thenextrecession.files.wordpress.com/2020/10/plen4.png)
![[image error]](https://thenextrecession.files.wordpress.com/2020/10/plen5.png)
![[image error]](https://thenextrecession.files.wordpress.com/2020/10/plen6.png)
![[image error]](https://thenextrecession.files.wordpress.com/2020/10/plen7.png)
![[image error]](https://thenextrecession.files.wordpress.com/2020/10/peoplesguidecover-f_medium-fa11e3e0f0e76512c413cf04d14df965.jpg)
![[image error]](https://thenextrecession.files.wordpress.com/2020/10/covid1.png)
![[image error]](https://thenextrecession.files.wordpress.com/2020/10/covid2.png)
![[image error]](https://thenextrecession.files.wordpress.com/2020/10/covid3.png)
![[image error]](https://thenextrecession.files.wordpress.com/2020/10/covid4.png)
![[image error]](https://thenextrecession.files.wordpress.com/2020/10/covid5.jpg)
![[image error]](https://thenextrecession.files.wordpress.com/2020/10/covid6.png)
![[image error]](https://thenextrecession.files.wordpress.com/2020/10/s-1.png)
![[image error]](https://thenextrecession.files.wordpress.com/2020/10/s-2.png)
![[image error]](https://thenextrecession.files.wordpress.com/2020/10/s-3.png)
![[image error]](https://thenextrecession.files.wordpress.com/2020/10/s-4.png)
![[image error]](https://thenextrecession.files.wordpress.com/2020/10/s-5.png)
![[image error]](https://thenextrecession.files.wordpress.com/2020/10/s-6.png)
![[image error]](https://thenextrecession.files.wordpress.com/2020/10/s-7.png)
![[image error]](https://thenextrecession.files.wordpress.com/2020/10/nobel1.jpg)