
Patrick O'Shaughnessy's Blog, page 38
April 25, 2014
Popular Stocks Stink
Why does value investing work? One of the reasons is that value factors like price-to-cash flow or price-to-earnings identify companies with very low market expectations. They tend to be boring companies, have negative news, poor outlooks, and so on. Value works because the market leaves these stocks too cheap, and when perception is ultimately adjusted to reality, value stocks outperform the broad market.
But there is a second reason that value investing works. Some of the outperformance of the value strategy comes because you don’t own the really expensive, popular stuff which tends to do terribly in the market. Sometimes, what you don’t own is as important as what you own. Take Apple 18 months ago. As I noted in a recent piece, Apple was very expensive, and value strategies would have avoided it. Not owning Apple was a huge boon to any strategy being compared to the S&P 500 in 2013, because Apple’s relatively weak year was a large drag on market returns for the year. Regardless of what you owned in 2013, your relative performance would have been boosted by not owning Apple.

I was amused when I came across this story posted by Business Insider, saying they were hiring someone to cover exciting stocks like “Tesla, Netflix, Facebook, Twitter, and the biotechs.” Can you imagine seeing a similar position posted to cover “potentially great investments like DirecTV, Marathon Petroleum, and Northrop Grumman.” I can’t see people lining up for that job.
Measuring Popularity
Tesla, Netflix, and Twitter are all very popular stocks. They are also expensive: they are in the 99th, 89th, and 95th percentile by value, respectively. Valuation is just one way of measuring popularity, but it is a bit indirect. One more direct way is to look at something called share turnover, which measures what percentage of a company’s total shares are trading hands every day. The higher the share turnover, the more action there is in the stock. Sometimes this is because of really bad news, but more often it’s because the stock is exciting.
Among the larger stocks in the U.S., Netflix and Tesla have by far the highest share turnovers today. On average over the past month, about 7% of the shares of each stock has changed hands every day. With that in mind, check out this figure below. These are the historical results of a strategy that buys the top 25 stocks in the market based on their share turnover (with a rolling annual rebalance). This group of the most highly traded stocks has delivered an annual return of -3.1% since 1984. That is putrid compared to the equal weighted basket of all stocks, which has delivered an 11.4% return in the same period.
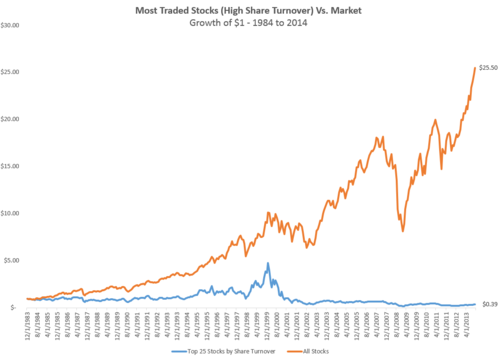
Today’s portfolio of highest share turnover stocks would include Netflix, Tesla, Plug Power and Yelp, among others. (Note: don’t just take my word on share turnover, Roger Ibbotson has a great paper—and firm—devoted to this factor. His findings mirror mine: high share turnover stocks lag, and less loved & low share turnover stocks outperform).
I think share turnover is a nice alternative to value to identify extremely popular stocks that you may want to avoid. The success of value strategies and the lack of success for high share turnover stocks teach us that investing success is as much in the avoiding as it is in the choosing.


April 22, 2014
The Five Year Market Metamorphosis
The U.S. market has gotten much more expensive in the past five years following the incredible buying opportunity in 2009. One great valuation measure is EBITDA (earnings before interest, depreciation, and amortization) divided by Enterprise Value (sometimes called ‘takeover value’, calculated as market value of a company, plus debt, minus cash). I’ll shorten the name and call it ‘EBITDA yield,’ a higher yield means the market is cheaper.
Using this measure to look at all investable stocks in the U.S.[i], it’s clear that the market as a whole has gotten more expensive since 2009. The EBITDA yield at the end of February, 2009 was roughly 14% for the entire U.S. market—today it is 9%. But the market's overall valuation only tells part of the story. The market in 2009 offered a wide variety of valuations, whereas today, in 2014, the opportunities are much more clustered. Stocks today are more expensive, but valuations are also much more homogeneous. Here is a look at U.S. stocks[ii] and how their valuations were dispersed in 2009 and 2014, compared to their very long term average.
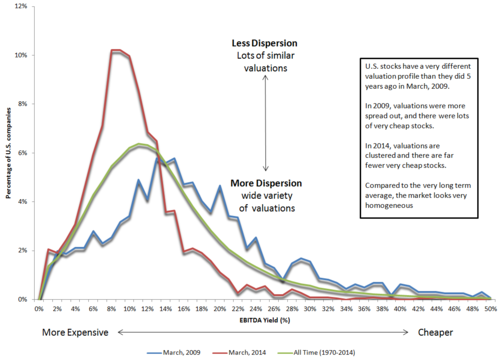
This change is being driven by a convergence of valuations. In 2009 cheap stocks were very cheap; now, they are less so (blue line below). The EBITDA yield for the cheapest stocks (10th percentile) has come down dramatically, from 35% in 2009 to 17% today. In contrast, expensive stocks (90th percentile) are about as expensive today as they were in 2009 (red line below). The market median (green line below) has also gotten more expensive--mainly because the cheaper stocks have done so well. This is driving the clustered valuations we are seeing today. Fewer big bargains have led to a more uniform market.

This doesn’t suggest that you should abandon valuation as a key component in stock selection (quite the contrary), but it does suggest there is less of an edge today in cheap stocks than there was five years ago: there are far fewer U.S. stocks that are very cheap. International markets offer more diverse valuations (see Meb Faber’s CAPE calculations for countries), but that is a topic for a different post.
[i] Market Cap> $200MM
[ii] Stocks with market caps> average, ~500 stocks today
April 19, 2014
Forget Passive vs. Active--Here's How To Evaluate Any Investment Strategy
Burton Malkiel has a new piece up on Wealthfront’s website calling smart beta strategies into question. It’s a very interesting and hot debate at the moment, and Malkiel’s perspective is worth a read—many of his points are important to consider.
The problem with this debate is that it is impossible to evaluate “smart beta” as an entire category relative to cap-weighted indexes, because smart beta strategies can be very different from one another. For example, a low volatility smart beta strategy will provide very different returns than a high momentum strategy. Any comparison between cap-weighted indexes and smart beta should be made on a strategy by strategy basis.
I think smart beta strategies should be assessed just like any strategy, and here I’ll lay out the criteria by which I think investment strategies should be evaluated. Hopefully you can use these criteria when making a decision between a smart beta strategy—or a traditional active strategy—and a traditional cap-weighted index.
Passive Investing—Misnamed, Misunderstood, and Flawed
First off, the debate between “passive” and “active” is misleading. As Cullen Roche recently pointed out in a post, everyone is active to some extent. Every strategy is an active bet that certain stock selection and weighting criteria are better than others.
Cap-weighting is itself a strategy that says “buy big stocks, the bigger the better.” Cap-weighted indexes are hard to beat because they are so cheap (and the fee differential between index funds and other strategies compounds over time) and the fact that rules-based cap-weighted indexes are inherently disciplined…they never deviate from their strategy. The goal of Smart Beta indexes/ETFs is to use the same discipline, but build indexes with better rules.
Malkiel’s best point is that costs (higher fees, taxes, and turnover) make some smart beta strategies inferior. But the piece, which denounces smart beta as a marketing tactic, is pretty light on empirical evidence. In a bit of cherry picking, Malkiel invokes the example of RAFI indexes taking on more risk in 2009 by overweighting bank stocks (which worked for RAFI), but leaves out the similar risky bets taken by cap-weighted indexes, like the massive weight to tech stocks in 2000 (which didn’t work for the S&P 500). Oh, and RAFI would have worked in the tech wreck, too, because fundamental indexes would have been very underweight the tech stocks that were producing very little sales/earnings/cash flows/dividends.
Evaluating Any Investment Strategy
Given that any investment strategy is active to some extent, I think there is a small list of important criteria when choosing where to put your money—whether it is indexing, smart beta/indexing, or traditional active. There are four main criteria worth considering.
#1 – Strategy consistency
Is the strategy rules based (and therefore consistent) or not? Consistency is very important for long-term success. Indexes—and Smart Beta—have this in their favor. The S&P 500 “strategy” has never changed, so it has consistency baked in. Non-index managers are less consistent. According to this recent SPIVA report, over the past five years, just 46% of funds stayed consistent to their style. Switching strategies/styles at the right time is very hard to do.
Bottom line: consistent approaches are better.
#2 – Selection Criteria
Rules-based is good, but the rules themselves are very important too.
I spend a few chapters on this topic in my book, but the bottom line is that market cap is a convenient but sub-par weighting/selection criteria. Indexing is the right strategy for a lot of people and is a great basic way to own equities, but I also believe that the right kind of “smart” strategy will deliver superior results. Here’s one example why.
Imagine breaking up all of the investable stocks[i] in the U.S. market up into 10 equal groups (deciles) based on their market capitalizations. Decile 1 would have the 10% of companies with the biggest market caps, and decile 10 those with the smallest. Today, there are around 300 companies in each decile, and 3,000 investable stocks total. Then imagine doing the same thing every year back in time for the past 50 years.
The figure below illustrates how each size decile has performed relative to the equal weighted opportunity set. Not much information in the 8 smallest deciles, but the largest stocks have significantly lagged the equal-weighted market. In particular, the biggest group of stocks has lagged the equal weighted opportunity set by almost 2% per year. Here’s the problem: 78% of the weight of the S&P 500 is in this largest decile today. The top 50 stocks by market cap have done even worse historically.
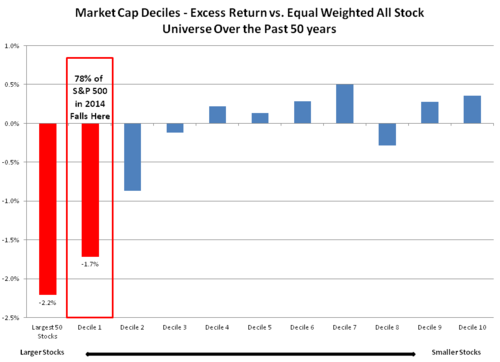
1963-2013
In contrast to market cap, there are a host of other rules that have worked for selecting stocks. A brief list includes: value, momentum, low volatility, quality (earnings quality, profitability), and small cap. The effectiveness of these factors varies. Below is the value example I’ve used before: value is much more powerful than small cap.
Malkiel is right that these factors (on their own) can have long periods of underperformance: momentum did poorly in the 2000’s because of the ’09 momentum reversal. But typically, as the holding period lengthens, the “risk” of losing to the market fades. Here is the percentage of time that cheap large stocks (using earning/price) outperform all large stocks over the past 50 years. These factors (and any smart beta strategies using them) only work if you stick with them.
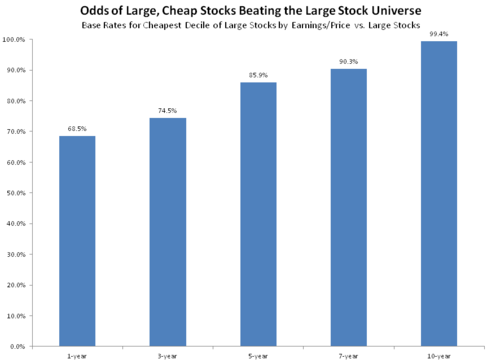
1963-2013
Smarter selection criteria have been proven to work over very long periods of time, arguably because these factors identify stocks that are systematically mispriced by the market; and the market is comprised of people who make systematic behavioral errors. Value and Momentum are the two that work the best. We’ve known about each “anomaly” for a long, long time, and yet they’ve continued to deliver outsized returns.
Bottom line: there are smarter ways than market cap to build a portfolio (before costs, we’ll get to those in a moment).
#3—Concentration
I loved Howard Mark’s latest shareholder letter, which is essentially an ode to “active share.” If your goal is to beat cap-weighted indexes, then your odds go up if you are very different from the index that you are trying to beat. There’s really no reason to be an “active” investor if you are just going to hug/slightly tilt an index.
Of course being different, or “daring to be great” as Mark’s calls it, brings the highest odds of ruin, too. There are smart ways to be different and dumb ways. The very long-term historical success of certain factors suggest that cheap stocks with good momentum is a smart way, and building a unique portfolio using value and momentum is the best way to “dare to be great.”
One of the main arguments against “active management” is that the average active manager loses to index funds—but this is like saying the Pope is Catholic or bears crap in the woods. Because of fees charged, active management is a negative sum game. The entire group of investors will earn the market rate of return, and the average will be negatively offset by active management fees that are higher than index fund fees. As this paper on active share demonstrated, the group of funds with the most unique holdings (highest active share) has historically beat market-cap weighted indexes by 1.1% after costs/fees. It has paid to be different than the market.
Bottom line: if you don’t buy an index, you’ll want to focus on strategies that have unique holdings and high active share.
#4—Implementation Costs (Trading (Turnover), Taxes, and Fees)
Turnover and taxes are hard to evaluate. Broadly speaking, the best strategies will have holding periods long enough that most gains are taxed as long-term capital gains. Trading/turnover get a bad rap, but turnover (and the taxes it brings) is really just the flexibility to move into more attractive opportunities. No turnover means you never adapt to changing market opportunities. I think the best strategies balance trading costs and turnover with the need to buy newly attractive stocks (e.g. undervalued, good momentum) and sell stocks that look less attractive (e.g. overvalued, bad momentum).
Fees are most straightforward category. Lower is better, and here indexes have a massive advantage. But it will thin out in the years to come. Smart beta fees (and traditional active fees) will keep coming down. Lots of smart beta strategies are in the 0.50% range right now, which is a disadvantage versus the 0.07%-0.09% range for index funds, but many smart beta strategies have historically delivered much more than 0.41% outperformance.
Bottom line: any strategies edge (its potential outperformance) needs to be greater than the total cost differential versus a cap-weighted index. The best deciles of value and momentum stocks have outperformed the market by between 4%-6% annualized since the early 1960s[ii]. That is more than enough to overcome cost differentials. Will these excess return number persist over the next 10-20 years? Of course it is impossible to say. But these factors (and others) sync nicely with the latest research in the behavioral economics field, have long and proven track records, and have continued to work despite widespread awareness of their existence and effectiveness.
Summing It Up
The funny thing about smart beta is that it’s gone by the name “quantitative investing” for two decades. Big names like Josef Lakonishok and Cliff Asness were writing papers about value and momentum in the early 90’s, and the first edition of What Works on Wall Street (which chronicles many “smart beta” factors) came out in 1996.
There are many successful quant firms that have posted consistent, market-beating results net of costs. Many of these firms are very well known, have great strategies, and manage taxes and turnover as best they can.
Cap weighted indexes do have big advantages. A consistent strategy, low taxes, low trading costs, and low fees is a great combination. When looking for strategies other than cap-weighted indexes, look for ones that are rules based (consistent), use rules/factors that have worked well over long periods of history (like value and momentum), are different from the market, balance taxes and turnover with expected outperformance, and charge reasonable fees.
If you are investing in the stock market for long term success, then smart beta strategies with the right strategies can be a great alternative to cap-weighted benchmarks, but each should be evaluated on its own. So far, the leaders in the online financial advisory space (especially Wealthfront) have avoided smart beta. I will be very curious to see if it lasts.
[i] Market Cap above $200MM, then inflation adjusted back in time
[ii] Complete stats for these any many other factors available in the latest edition of What Works on Wall Street
April 17, 2014
The Remarkable Transformation of $AAPL
People too often mistake great companies for great stocks. It seems like the two things should be related: great companies should be great investments. But this is often a dangerously misleading notion. If the market thinks a company is great, its prices that company’s stock accordingly, which can lead to expensive prices and weak returns.
Apple’s stock is the perfect example to highlight the crucial difference between a company and a stock. My intention is not to convince you to buy Apple today, but rather to use Apple to demonstrate that it is more effective to make investment decisions based on stock characteristics like valuation and “shareholder yield” than based on a company’s greatness.
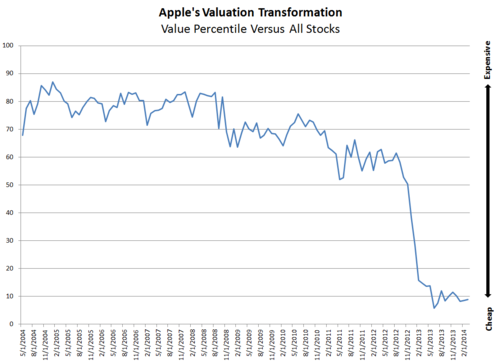
Apple’s stock has undergone a remarkable transformation (for the better) in the past two years in two specific areas: valuation and shareholder orientation. It went from a very expensive market darling focused on growth, to a very cheap market laggard with significant dividend and share repurchase programs.
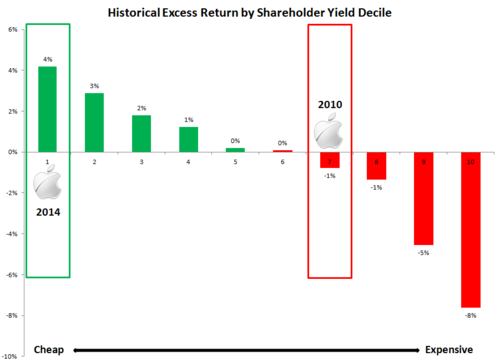
Great companies are often viewed by investors through rose colored glasses. Investors extrapolate the company’s recent success too far into the future, leaving the stock expensive. Between 2010 and 2012, perception was that Apple was the greatest company in the world. In 2010, Apple was more expensive than 75% of the market based on a combination of simple measures like price-to-earnings, price-to-sales, and price-to-cash flow. Now, in 2014, it is cheaper than 91% of companies, based on those same measures. Look how quickly the change happened. Market perception can turn on a dime.
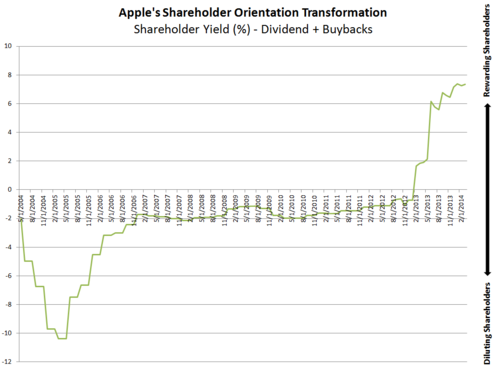
The other key change in Apple (from the investor’s perspective) is its orientation towards its shareholders. For years, it issued new shares, diluting existing shareholders (shown as negative shareholder yield in the figure below) and paid no dividends. They’ve since pulled a 180, buying back a huge number of shares and paying a regular dividend. Again the change happened fast.
Change in Perception – Apple Inc. vs. $AAPL
Just a few years ago, people thought Apple would soon be the first trillion dollar company. Its leader was the modern day Edison, and its products best in class. Now, a few years later, shareholders and commentators are bemoaning Apple’s lack of new products, declining margin, and less visionary leader.
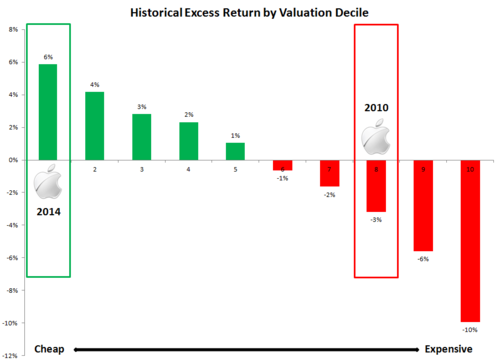
The consensus is that Apple has less potential than it did a few years ago, but history suggests that its stock has much more potential than it did a few years ago. In 2010, Apple was priced more expensively than 75% of the market. It fell in a valuation group (decile, outlined below) that has historically lagged the market by 3% per year. This -3% means that if you bought every stock in that category (there are about 300 of them) every year, you’d have historically underperformed the market by 3% per year annualized: a big negative gap. Now, in 2014, it sits in the cheapest decile, a group that has historically beaten the market by almost 6%.
Successful investing is all about finding mismatches between perception and reality. In this case, price is the market’s perception and reality is things like cash flow, earnings, etc. Four years ago, perception was out of whack with reality in a bad way: investors expected too much of Apple. Now, the situation is flipped and it appears perception may be much worse than reality—which is when you want to buy.
The same story is true of Apple’s shareholder yield. History teaches us that you should favor stocks that pay dividends and repurchase the most shares (decile 1 below), but avoid stocks that issue the most shares (decile 10). Again, Apple looked unattractive as a share issuer, but looks much more attractive now, as a dividend-payer and share-repurchaser. Note: for more on shareholder yield check out Meb Faber’s great book Shareholder Yield or Chapter 13 of James O'Shaughnessy's What Works on Wall Street.
Apple Inc., the company, has taken its licks since it peaked at $700 in 2012. The change in perception has transformed $AAPL, the stock, in ways that should make investors take notice. Investors should always buy cheaper companies that reward their shareholders rather than expensive stocks dilute them. Of course Apple itself may flounder and underperform the market, but the odds are that a large basket of stocks with similar characteristics (cheap valuations, high shareholder yields) will do very well over the long term.
April 13, 2014
1,000% Returns - Hitting the Stock Market Lottery
Hope springs eternal in the human breast. – Alexander Pope
People love huge, lottery like gains. Fast gains get attention, which is why I titled this post “1,000% Returns” instead of “Earn 1,000% Over 30 years.” In pursuit of quick riches, we sometimes turn to lottery-like stocks: companies that trade at outrageous valuations, have exciting stories, and have the potential to be wildly successful. Lottery stocks are expensive because they have such exciting prospects for the future. Their stock prices don’t reflect what they have accomplished, but what they might accomplish.
We love these stocks because we love innovation, new technologies, and revolutionary companies. Many of the best companies in the world today were once revolutionary upstarts themselves, and investors want to find the next big thing and ride it to the top. Also, because they are usually smaller, younger companies, lottery stocks give us the chance to get rich very quickly. IBM isn’t going to grow 10-fold in one year, but a small biotech company with a drug that fights cancer might.
Lottery Stocks Defined
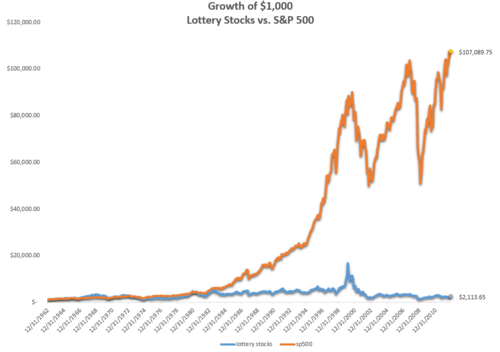
I define lotto stocks as the most expensive stocks in the market: the 10% of stocks with the highest prices relative to their sales, earnings, cash flows--which means they are the stocks for which the market has the highest expectations. On average, about 40% of these stocks come from just three of the twenty-four major industries: Pharmaceuticals & Biotechnology, Technology Hardware & Equipment, and Software & Services. Here’s the sobering picture of how lotto stocks have done historically:
1962-2012
Of course, some lottery tickets pay off—as the Powerball slogan says, “Hey, you never know.” Google and Apple have both fallen into the “lottery stock” category at times. But on average these stocks are dangerous, and today’s lotto stocks—including biotechnology companies, some internet stocks, battery companies, and so on—should be avoided at all costs. Contrary to the Powerball slogan, for the most part you do know what will happen to these stocks. They’ll kill your portfolio.
We play regular lotteries like Powerball because of what is possible, not because of what is probable. Everyone knows the odds are terrible, but the prospect of great fortune has always been, and will always be, very seductive.
Lottery Brain
Our brains suck at processing odds in general, but our handicap gets worse when dealing with large potential rewards. We tend to significantly overestimate the probably of an outcome if that outcome means a big reward. Take horse or dog racing. We prefer to bet on the long shots—despite their terrible odds—because of the huge potential payoff.
There is a great chapter in my favorite behavioral finance book (Inside the Investor’s Brain) on probabilities. Author Richard Peterson explains:
As the size of a potential monetary gain increases, so too does reward system activation (specifically the nucleus accumbens). Potential reward size is more emotionally arousing than proportional changes in probability…When an outcome is possible but not probable, people tend to overestimate its chance of occurring. This is called the possibility effect. When an outcome is likely, people tend to underestimate its odds. This bias has been named the certainty effect. Events of probability less than 40 percent are susceptible to the possibility effect. Outcomes with greater than 40 percent probability are in the realm of the certainty effect.
If there is a chance that we might earn a big reward, our brains push us towards going for it, even if the odds stink. Here is a visual representation of how we should evaluate odds versus how we actually do. The straight diagonal lines is how we should assess them: if something has a 10% probability then we should give it give it a 10% chance when weighing our odds. The curved line is how we actually do assess them. We make huge mistakes, especially for very improbable events. As the figure shows, we might think something has a 15% chance of happening when it in fact has a 1% chance.
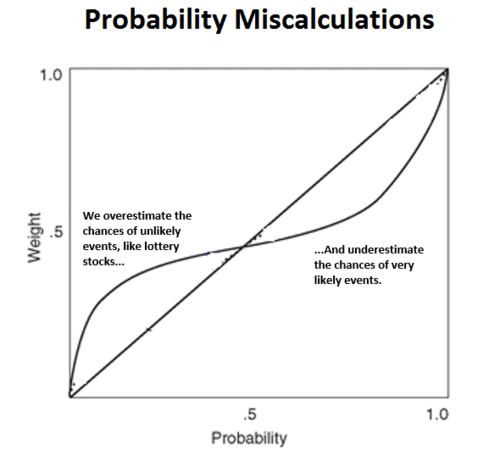
Modified from original in Inside the Investor's Brain, by Richard L. Peterson
Peterson lists conditions under which we are likely to screw up our assessment of the probabilities, including:
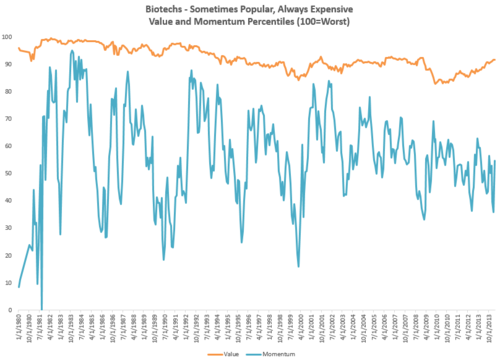
Vivid or easily imagined resultsMinimal awareness about the event’s likely outcomesEvent is represented as a novel/unique phenomenonWanting the outcome to occurFeeling a personal or emotional stake in the outcome, or feeling excited about the outcomeThe biotechnology industry fits these definitions. These stocks have usually not produced big earnings, but have huge potential if a drug comes through. Here is how biotech stocks have stacked up to the rest of the market in terms of value (cheap or expensive) and momentum (popularity) since 1980. Their popularity ebbs and flows as the prospect of great fortune waxes and wanes, but they are always expensive.
Lottery Stock Results
Using my definition of lottery stocks (the most expensive 10% of the market), let’s first look at the exciting possibilities of these stocks. Here are some examples of winning lotto tickets, so to speak, from the last 10 years:
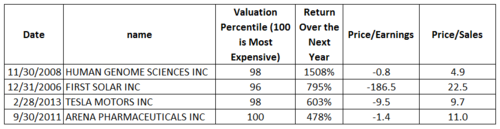
Like usual, these stocks enticed investors because they represented new technologies and innovations that had the potential to lead to massive success (and earnings) if their new car/energy/medical technologies panned out. Like the regular lotto, every so often you will hit it big.
But it is stories like these that keep the fire burning for future lottery stocks (“I know it’s a long-shot, but this might be the next Tesla!”). The chance, however small, that one might catch lightning in a bottle is seductive enough to get investors buying.
But there is a big difference between what is probable and what is possible. Since 1963, the most expensive 10% of the market has underperformed by 8.5% annually. If, since 1963, you bought every lotto stock in the market every year, 60% of those buys would have lost money in the next 12 months (and they’d have been down an average of -41%). Even though the remaining 40% made money, the entire group of lottery stocks has grown at a tiny 1.5% annual rate since 1963—that’s worse than inflation, and significantly worse than the S&P 500 which grew at roughly 10% per year over the same period. The historical record is clear: it doesn’t pay to play the stock market lottery.
Don’t Play the Stock Market Lottery
So what does it mean for stocks today? Some stocks in the typical industries—technology, biotech, cutting edge energy—are once again priced at insane levels. There will always be companies like Apple and Google that work out. But picking those winners ahead of time from a crowded field of competition is extremely difficult to do. You are much better offer buying the overall market or buying cheap stocks (which will be the subject of another post soon).
History teaches us that we should avoid lottery stocks like the plague. Just like the actual lottery, the probabilities of a big payoff are just too low. When you buy a lottery stock, you are paying for the excitement that your ticket might pay off--a decision that is emotional not rational. A good rule of thumb for lottery stocks and investing in general: if it feels good or excites you, it is probably a bad idea.
April 11, 2014
Reading List - April 2014
Every month, I am going to suggest 3-5 of the best books that I've ever read. To get the suggestions each month, sign up here. Here are the suggestions for April, 2014:
Inside the Investor's Brain: The Power of Mind Over Money (Wiley Trading) by Richard L. Peterson
This is, by far, the best collection of information on behavioral finance that I have read. Peterson has collected the most interesting examples of how and why we fail as investors, and suggests ways to avoid making dumb mistakes in the future. You’ll learn about evolution, the brain chemistry behind our investing decisions, and the countless traps laid by the market to ruin our performance. My copy is so worn out (from reading, highlighting, and note-taking) that I’ll need to order another one soon.
Drunk Tank Pink: And Other Unexpected Forces that Shape How We Think, Feel, and Behave by Adam Alter
The title refers to a remarkable phenomenon: if you expose men to the color pink for prolonged periods, they get weaker, calmer, and generally more sedated. When the effect was first discovered, the color “drunk tank pink” became a popular tool. Holding cells, for example, were painted pink to calm prisoners. This book is chock full of interesting and useful examples of subconscious behavioral triggers, including several specific to the stock market. You’ll learn how more pronounceable ticker symbols (e.g. OPEN, HOG) result in better IPO performance, and how seeing a yin-yang symbol can affect our investing decisions.
Adapt: Why Success Always Starts with Failure by Tim Harford
“The art of success is to fail productively”
Using excellent examples, Tim Harford explains that to make progress, you must fail often and fail productively. You will finish this book ready to face failure, and excited to experiment in life and business: trying new approaches until you stumble upon something great.
The Tiger: A True Story of Vengeance and Survival by John Vaillant
One of the most amazing books I’ve read in the last few years. The premise is simple: a hunt for a man-eating tiger in the remote taiga of eastern Russia circa 1997. With this as a backdrop, the author (an amazing writer) explores the human condition, our relationship with nature and with animals. You will learn why the brand name “Viagra” comes from the Sanskrit word for ‘tiger.’
Within every major ecosystem nature has produced, she has evolved a singularly formidable predator to rule over it. In Primorye, the Amur tiger is the latest, most exquisitely lethal manifestation of this creative impulse…
“The most terrifying and important test for a human being is to be in absolute isolation,” he explained. “A human being is a very social creature, and ninety percent of what he does is done only because other people are watching. Alone, with no witnesses, he starts to learn about himself—who is he really? Sometimes, this brings staggering discoveries. Because nobody’s watching, you can easily become an animal: it is not necessary to shave, or to wash, or to keep your winter quarters clean—you can live in shit and no one will see. You can shoot tigers, or choose not to shoot. You can run in fear and nobody will know. You have to have something—some force, which allows and helps you to survive without witnesses…Once you have passed the solitude test,” continued Solkin, “you have absolute confidence in yourself, and there is nothing that can break you afterward.”
April 8, 2014
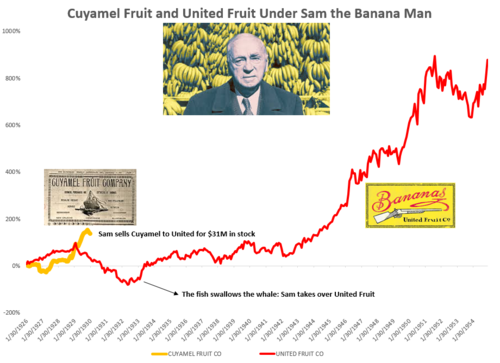
Warren Buffett and the Banana Man
Had a Chiquita banana lately? I was amazed to learn the remarkable story behind the brand, which began in 1911 with a company called Cuyamel Fruit Company and a Russian immigrant named Sam Zemurray. Sam (aka “Sam the banana man”) was a remarkable businessman who personified the American dream, but also exposed some of the ugliness of American business in the early part of the 20th century. While he had his fair share of faults, reading about his many positive qualities and remarkable successes constantly reminded me of Warren Buffett. Their early successes, mid-career transformations, and attitudes towards business were remarkably similar. Both took over mismanaged companies and turned them into behemoths of business. This quote, said of one of the two men, could have been said of either: “He’s a risk taker…he’s a thinker, and he’s a doer.”[i]
Here I highlight some of these similarities between the two men. I only scratch the surface of Sam Zemurray’s remarkable tale. For the whole story, I suggest you read The Fish that Ate the Whale: the Life and Times of America’s Banana King by Rich Cohen, from which I take most of the information and all the quotes for this story.
“Ripes” and “Cigarette Butts”
Early in his investing career, Buffett was famous for a style of value investing learned from Ben Graham. Through in-depth research he would find forgotten or discarded companies, trading at deep discounts to the value of their net assets, from which he could extract a little bit of value. These stocks were often terrible companies, but were trading below liquidation value. Buffett called them “cigarette butts,” because like discarded butts—from which one could enjoy one last puff—they offered one last bit of value, and Buffett was a master at extracting that value.
Sam Zemurray’s early success was owed to the exact same strategy. He moved to America from Russia at age 14 and did anything to make a buck. He discovered a clever strategy with the exotic banana fruit (which few Americans had tasted prior to 1900). The big fruit companies (the precursors to Chiquita and Dole) would import bananas from the equatorial tropics and move them to markets throughout the U.S. for sale. But some of the bananas would reach the U.S. already ripe, and would be discarded by the big companies because they’d rot before making it to market. As much as 15% of the bananas imported were ripes.
Zemurray realized that these discarded ripes—like Buffett’s cigarette butts—were far from worthless. It required hard work and coordination, but he could make a killing off of ripes. One man’s trash was Zemurray’s gold. He’d take the discarded ripes, quickly load them on a train, and sell them right out of the traincar as it moved from town to town—earning 100% profit.
Zemurray went into a Western Union office and spoke to a telegraph operator. Having no money, Sam offered a deal: if the man radioed every operator ahead, asking each of them to spread the word to local merchants—dirt-cheap bananas coming through for merchants and peddlers—Sam would share a percentage of his sales. When the Illinois Central arrived in the next town, the customers were waiting. Zemurray talked terms through the boxcar door, a tower of ripes at his back. Ten for eight. Thirteen for ten. He broke off a bunch, put the money in his pocket… In 1903, he sold 574,000. Within a decade, he would be selling more than a million bananas a year.
The banana man’s strategy was brilliant. He was selling hundreds of thousands of bananas each year without the normal costs:
His fruit was grown for him, harvested, and shipped for free. He was like a bike racer riding in the windbreak of a semitruck—the semitruck being United Fruit. By his twenty-first birthday, he had a hundred thousand dollars in the bank. In today’s terms, he would have been a millionaire. If he had stopped there, his would have been a great success story.
But while the ripes and “cigarette butt” strategies worked well on a small scale for a while, Sam Zemurray and Buffett wanted more—they had to adopt new strategies that worked on a larger scale.
Stage Two
Zemurray founded the Cuyamel Fruit Company in 1911 as a more traditional fruit company: growing, harvesting and distributing bananas. He bought land in Honduras and arranged sweet-heart deals with the local government. Kickbacks and bribes were necessary to keep costs down and profits flowing. Honduras, under Zemurray, was a true “banana republic." He built an empire there, ousting government leaders when they wouldn’t cater to his needs (read the book for more great details):
“Deposing [José Santos] Zelaya’s government in Nicaragua [in 1909] had required the combined efforts of the [American] State Department, the navy, the marines, and President Taft,” wrote Stephen Kinzer in Overthrow. “In Honduras, Zemurray … [did] the job himself.
Stage two for Buffett, of course, was moving on to great companies bought at reasonable prices. As he is famous for saying, “it is far better to buy a wonderful company at a fair price than a fair company at a wonderful price.” After clever beginnings, both men thrived by owning great, efficient businesses. Buffett started with unknown downtrodden companies, but made his fortune in brand names like Coca-Cola and American Express. Zemurray started with a similar arbitrage strategy, but made his millions by building a great company.
Know Your Business and Empower Your People
In building Cuyamel from the ground up, Zemurray’s success came from getting into the weeds (or, more literally, the jungle). He spent his time on location in Honduras streamlining operations and building the world’s most efficient banana company. He worked 16 hour days and knew every aspect of the business. Buffett’s edge was similar. He was willing to put in the time reading Moody’s manuals cover to cover when no one else bothered. It takes discipline, time, and lots of energy to know a business inside and out, but the results are worth it.
Zemurray sold Cuyamel to the giant United Fruit company for $31.4 million of United Fruit stock in 1930, right at the outset of the Great Depression. Seen in the figure below, Zemurray sold his Cuyamel right at the peak, but United Fruit collapsed due to the economic hardships of the Great Depression and terrible mismanagement. Zemurray came out of a brief retirement frustrated by the inept leadership at United. The United executives were trying to manage operations in the tropics from their offices in Boston, and their micromanaging was killing the company. Zemurray knew this was a terrible strategy:
“This man in Guatemala, he’s your manager, isn’t he?” Zemurray asked [at a board meeting]. Yes. “Then listen to what the man is telling you. You’re here, he’s there,” said Zemurray. “If you trust him, trust him. If you don’t trust him, fire him and get a man you do trust in the job.”
Buffett, too, believes in trusting his different managers to make the right decisions and does not meddle. Empowering others leads to phenomenal results.
Behind the scenes, Zemurray gathered support from other shareholders of United Fruit and collected enough proxy votes to essentially take control of the company. He went to another board meeting and laid out his plan for improving the company, but didn’t reveal his ace in the hole. The chairman of United Fruit dismissed Sam's plan and chose instead to make fun of his Russian accent, saying “unfortunately, Mr. Zemurray, I can’t understand a word of what you say.” Sam stormed out, making the board members think they’d humiliated him, but he was just gathering the proxy slips he had stored outside. He returned and slammed the proxies on the table and said, “You’re fired! Can you understand that, Mr. Chairman? You gentlemen have been fucking up this business long enough!”
This incredible coup earning him the nickname “the fish that swallowed the whale.” He took over the company and remade it in the image of Cuyamel Fruit. From the time he took over in 1933 until his full retirement in 1954, United Fruit stock grew by 2,300%[ii]--640% more than the S&P 500 over the same time period.
When Zemurray took over United Fruit, he decentralized the company. He recognized that a chairman sitting in Boston should not be making decisions about how best to manage acres of banana plants in Honduras. Under Sam’s leadership, decision making power was pushed back to United Fruit employees in the tropics managing the fields. Both Sam and Buffett trusted managers to run their business without meddling.
Key Lessons
I’ve ignored the more dubious parts of Zemurray’s character and business, including bad labor conditions in the tropics and coordination with the CIA to overthrow Jacobo Arbenz, the Guatemalan president who wouldn’t cater to Zemurray’s needs. His complete story is remarkable and I highly suggest buying and enjoying the book; it is a great case study of a successful business. United Fruit eventually became Chiquita, but the early history—beginning with Zemurray and Cuyamel—is the most fascinating. Who knew a simple fruit could have such an incredible story.
Sam and Buffett’s stories offer many great lessons for business and investing, I’ll end with these three:
1. Start with small advantages. Look for corners of the market that have been forgotten or are too insignificant for the big players (individual investors, for example, can do well in micro-cap stocks like the ones with which Buffett began his investing career. Big entities can’t bother with these small companies, but small investors can).
2. Know your business from end to end. It’s amazing what an edge you can have by doing your homework. Both Sam and Buffett knew all aspects of their businesses and made better decisions as a result.
3. Trust your lieutenants to manage themselves, don’t micromanage. Empower managers. Once at the top of their companies, Zemurray and Buffett delegated and trusted their men on the ground.
[i] Andrew Preston, of the United Fruit Co., describing Sam Zemurray.
[ii] Using CRSP return data for United Fruit.
April 7, 2014
"Sell in May" and Election Cycle Years
As May approaches, I figured it'd be a good time to summarize the historical evidence for/against "selling in may and going away" and the evidence for investing more or less during certain years of the election cycle. Here is a quick summary, using S&P 500 return data from 1926-2014.
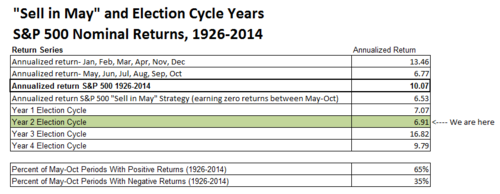
S&P data from Roger Ibbotson (nominal returns)
Stocks have performed better in the months of Jan, Feb, Mar, Apr...Nov, Dec. They have done worse (but still delivered solid returns) in the months of May, Jun, Jul, Aug, Sep, Oct.
If, since 1926, you'd sat on the sidelines between May and October every year, your returns would have been considerably worse (6.91%) than a simple buy and hold approach (10%)--to say nothing of the increased taxes and turnover such a strategy would require.
Because you always want the odds in your favor, its also important to note that the S&P 500 has delivered a positive return in 65% of the May-October periods since 1926.
Election cycle years also have different annualized returns. Year 3 is by far the best and Year 2 (also referred to as a mid-term election year, where we are today) is the worst.
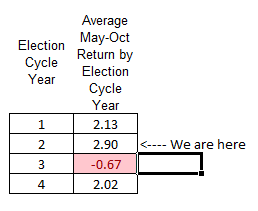
Combining "sell in May" and election cycle years, here are the average May-Oct returns broken out by election cycle year. No clear reason for caution in year 2 of the cycle.
Here are the year by year results:
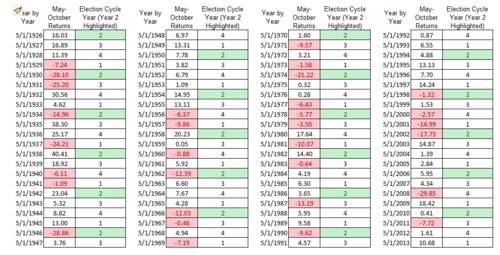
S&P data from Roger Ibbotson (nominal returns)
While mostly positive, there are some very negative observations--one of which (2008) helped drive the popularity of the "sell in May" strategy.
But implementing a timing strategy is very psychologically difficult. Imagine selling in May of 2008. You'd have felt like a genius come November, but do you really think that you'd have stuck to the strategy and bought back into the market in November of 2008? That would have taken extreme discipline.
The bottom line is that selling in May and returning to the market in November has been an inconsistent strategy and one that would require perfect discipline to implement (not a typical investor forte). If you are a long-term investor, you'll inevitably have to ride out tough periods of performance. I say keep your eye on the long term prize. Even if this turns out to be a bad year, over the long term its better to stay put.
April 3, 2014
Millennials Are Screwing Up Their Investments
Young people are going about investing all wrong. The most basic (and important) decision you make as an investor is your allocation between major asset classes—primarily stocks, bonds, and cash. Here is how millennials’ portfolios look in 2014, according to a recent research report from UBS.
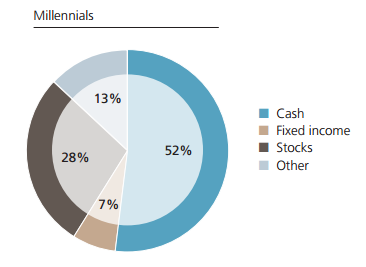
This allocation screams caution, worry, and distrust of the stock market. Why are millennials investing this way? Mainly because they have had two very sour experiences with the stock market: the technology crash between 2000-2002 and the more dramatic financial crisis between 2007-2009. Both times, the market collapsed 40% or more. The only other time that happened twice in one decade was in the 1930’s in the midst of the Great Depression. Millennials don’t trust Wall Street (all four major banks among most hated brands by millennials), and one of our most famous authors is saying the stock market is rigged.
With all this in mind, it makes sense that millennials are so cautious. But the choices they are making with their investments are backwards. Millennials think cash is safe, but its actually dangerous. They think that stocks are risky, but in fact stocks are the safest means to secure long-term financial prosperity.
The problem is that we tend to think of “risk” as a fixed concept—that is, stocks are riskier than cash and bonds…period. But risk can only be accurately assessed in combination with a time horizon. If you are 25 and saving for retirement, you have at least a 40 year time horizon, which drastically changes what is risky and what is safe. Millennials are making decisions as if they were 60 years old, on the verge of retirement—and it could cost them huge amounts of wealth.
The Potential of Every $1
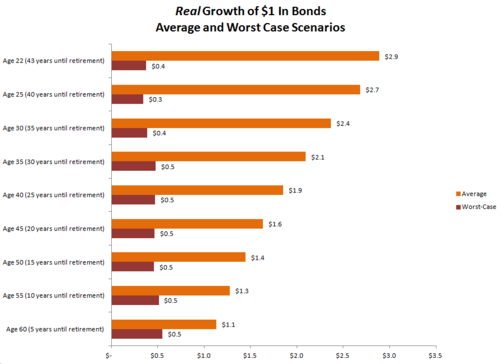
I find it easiest to think about potential investments in terms of individual dollars. What returns are you likely to earn over certain time periods on every dollar you invest? What are the best and worst case scenarios? Let’s start with stocks—the most hated investment choice among millennials.
Obviously we want every dollar we invest to be worth as much as possible when we retire. The first figure below lists the average result for $1 invested in the stock market at various ages. It shows what each dollar will be worth by age 65 depending on when you start investing in the stock market (earlier if obviously much better). This assumes the market grows at the same real rate it has since 1926 (6.9% per year). “Real” means after accounting for inflation, which reduces your returns. For the reasons I lay out in a separate piece on the history of money, inflation is a crucial consideration when evaluating investment options.
One important note: I am basing this analysis on data back to the 1920’s for stocks, bonds, and cash (bills) because it allows us to include events as diverse as the Great Depression, World War II, runaway inflation, booms, busts, panics, and so on. Everything short of a 100% breakdown is covered.
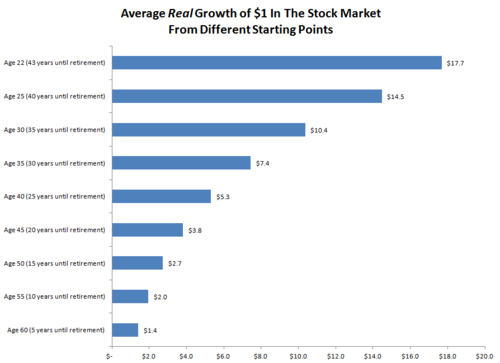
Note that the earlier you start, the more potent each dollar is. If you start at 22, then each dollar would be worth nearly $18 when you retire…but if you procrastinate, even until you are 40, each dollar would only be worth $5.30.
Millennials care more about risk than anything else, so let’s look at the worst case scenario alongside the average. These numbers represent the worst possible times to be invested (again starting at various different ages) between 1926 and 2014.
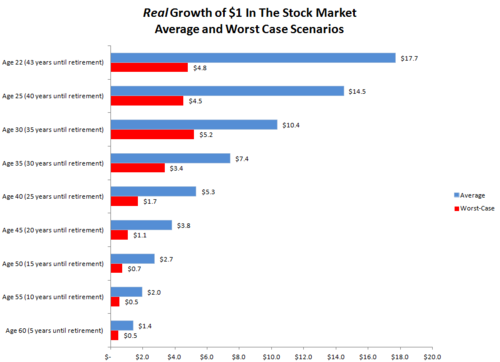
Sure enough, stocks are risky as hell in the short-term. Look at the worst-case scenario for the value of a dollar invested by people 50 years or older (who have between 5-15 years until retirement). It would be terrible to invest in the stock market at age 50 and have each dollar worth just 70 cents 15 years later. That’s a scary 30% decline over 15 years.
But look at the worst case scenarios if you start younger. If you start at age 22, the worst result for a dollar invested was growth to $4.80. This would have happened if you invested at age 22 in 1966 and retired in February 2009 at the exact market bottom of the second worse collapse in the stock market’s history. It also would have included the crash in 2000 and the miserable period for stocks between 1968 and 1982 when the market went nowhere. Even through three tumultuous markets, you’d still have $4.80 for every dollar you invested.
You can see why risk cannot be assessed independent of time. Stocks can be very risky in the short term, but have been extremely safe over the long term, which is all that should matter to millennial investors.
Bonds and Cash
What about the “safe” options that millennials prefer? Here are the average and worst case scenarios for bonds and cash (t-bills).
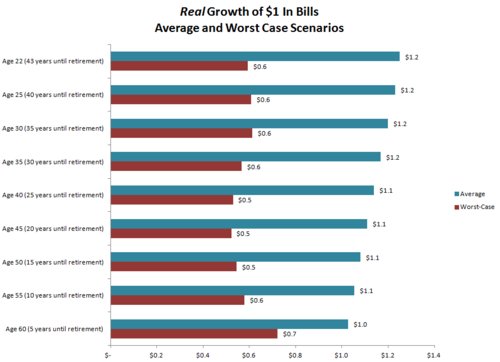
For both bonds and bills, the worst case scenarios are scary across all time periods. Even if you start investing when you are in your 20s, there is a chance that each dollar you put into bonds or bills will be worth less than 50 cents in real terms come retirement. For bonds and bills, inflation is the silent killer. Bonds and cash (bills) seem so safe because they preserve the number of dollars you have. But what good is preserving $100 until 2050 if a sandwich costs $80 at that point in the future? Purchased power is what matters, not the number of dollars you have. Judged this way, stocks are the runaway winner.
Think back to the current millennial investor’s allocation. More than 50% is in cash, an asset that seems safe, but can be very dangerous over the long-term. Meanwhile, millennials have just 28% in stocks, which even under the worst-case scenario have delivered strong long-term real returns.
What If The Sky Isn’t Falling?
I’ve focused on worst-case scenario because millennials are so sensitive to risk…but the best case scenarios are also worth considering. Here is the best case scenario for each dollar invested at different ages for all three assets: stocks, bonds, and cash.
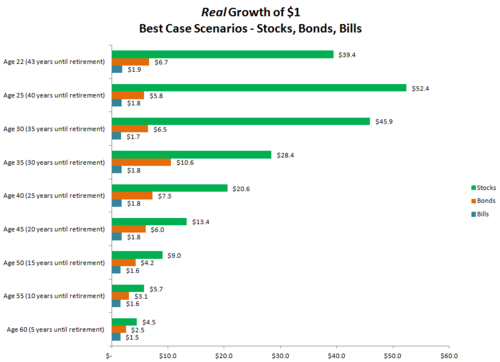
If you start investing in the stock market in your 20s, there is a chance each dollar ends up being worth much more than the $4.80-worst-case scenario or $18-average. There was one period where each dollar grew to $52 over 40 years. In sharp contrast, the best case over 40 years for bonds and bills was $6.70 and $1.90, respectively.
When Safe Isn’t Safe
Millennials are right to be cautious, but if their current investment allocations are any indication, too many millennials are thinking about short-term risk when they should be thinking about very long-term risk. When risk is reframed, stocks have always been the safest long term asset. The bottom line is that you should start investing now. Even if the initial amounts are very small, the long-term benefits are can be huge. But you have to start young and remember that what seems risky is in fact safe.
Monthly real returns for stocks, bonds and bills from Roger Ibbotson. Stocks = S&P 500, Bonds = Long Term U.S. Government Bonds, Bills = T-Bills
March 31, 2014
Lao Tsu Can Make You A Better Investor
Pearls of investing wisdom from unrelated sources.
Care about what other people think and you will always be their prisoner. – Lao Tsu
The market is just a bunch of other people. Collectively, they get too excited or too scared about investments all the time, leaving certain stocks/assets way too expensive or way too cheap. If you let their extreme emotions sway you either way, you’ll lose money.
Some of the best investors are contrarian ones, who think the opposite of what the market thinks. Being a contrarian requires buying stocks about whose futures there is a grim consensus; the market usually hates contrarian/value stocks. It’s hard to be a contrarian because we humans hate being wrong and alone. As Keynes says, “it is better for reputation to fail conventionally than to succeed unconventionally.”
Contrarian and value investing go hand in hand. If you bring up most big value stocks, lots of people will tell you “yea, it’s cheap but it’s cheap for a reason.” Ask ten people what they think about well-known value stock and you’ll usually get 9 negative opinions.
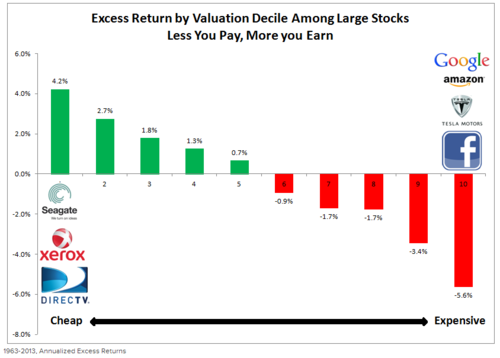
But here is the simple evidence that it pays to follow Lao Tsu’s advice: if you break stocks into deciles (10% buckets) by valuation as I’ve done below, you notice that the less you pay for stocks the more you earn from them. Here are the historical excess returns by valuation decile over the past 50 years, along with some representative example companies from today’s market.
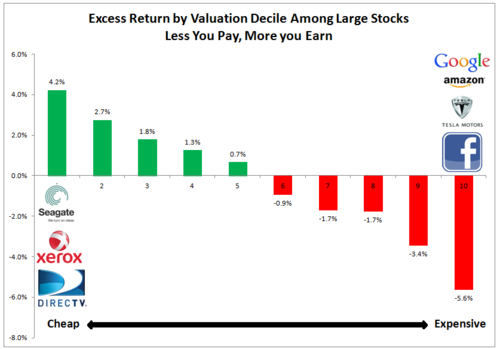
1963-2013, Annualized Excess Returns
Notice the amazing companies (important distinction between company and stock) currently in the most expensive decile: Google, Amazon, Facebook, Starbucks, Tesla. These are all expensive (i.e. the market loves them) because they've been spectacular companies and seem to have bright futures. But you pay an expensive price for a cheery consensus. Some of these stocks may do well, but as a category, the 10% of stocks with the worst valuations have historically underperformed the market by 5.6% per year.[i]
It is easy to talk your way into these stocks despite their price: Tesla might revolutionize how we power everything, and supply their battery technology to other car companies. It’s the only successful car start-up company in 90 years, and its CEO is Steve Jobs' defacto replacement as the world’s leading visionary. During the recent 60 minutes piece on Elon Musk, they said “he may do for cars what Steve Jobs did for phones.” That may be, but if you buy Tesla you are getting a stock that is more expensive than 99% of large companies[ii]—Tesla stock may do for your portfolio what Hydrogen did for the Hindenburg.
Cheap stocks are less exciting. While “new world” tech companies are expensive, “old world” tech like Seagate Technologies and Xerox, are cheap. It’s easy to craft a narrative that value stocks—Seagate and Xerox included—are cheap for a reason, but too often they are too cheap. Again, these specific names may underperform (I include them as points of reference) but as a category, the cheapest 10% has outperformed the market by 4.2% annually since 1963. The U.S. large cap market is supposed to be the hardest part of the market to outperform, but if you are willing to ignore what everyone else thinks, it can be done with ease over the long term. To paraphrase Lao Tsu, if you care about what the market thinks you will always be its prisoner.
There is no fire like lust, no jailer like hate, no snare like infatuation, no torrent like greed. – Buddha
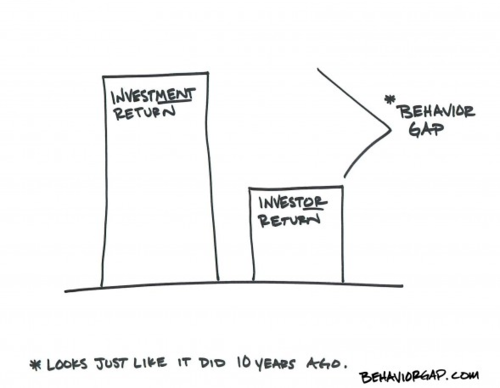
More so than the market itself, our minds (and specifically our emotions) determine our investing success or failure. Fear and greed have devastated more portfolios that any bear market. Fear, in particular, makes us behave like idiots. We are hypersensitive to losses (twice as sensitive to losses as we are to gains) and will make irrational decisions to protect ourselves from pain. Fear causes investors to overdo it on the downside—both during market crashes and in individual stocks (a major reason value investing works). It’s hard to embrace fear (and be a market contrarian), but the least you can do is recognize fear and ignore it. Greed hurts too, because it sedates rationality. Because of our greedy and fearful investment decisions, we earn returns that are several percentage points per year lower than the overall market. Here are some good books about investor behavior: Simple Wealth, Inevitable Wealth, Inside the Investors Brain, The Behavior Gap.
Nature's way is simple and easy, but men prefer the intricate and artificial.—Lao Tsu
Simple strategies often produce the best results, but complex investment processes are seductive. Lots of movement, models, and activity appear sophisticated, but don’t confuse activity with effectiveness. Simple strategies work: indexing (good), fundamental/factor indexing (better), value/quality/momentum based strategies (best).
Take care of what is difficult while it is still easy, and deal with what will become big while it is yet small.—Lao Tsu
For young investors starting out, the best policy is to make good allocation/strategy decisions and then stick with them. Make investing automatic by making 401(k) contributions and/or automatic transfers to brokerage accounts. Rebalance on a set schedule. Making your investments automatic will remove most of the behavioral landmines that create the gap between market returns and investor returns (Carl Richard’s behavior gap). The fewer decisions you have to make as an investor, the better, because every decision is a chance to screw up.
Do not believe what you have heard. Do not believe in tradition because it is handed down many generations. Do not believe in anything that has been spoken of many times. Do not believe because the written statements come from some old sage. Do not believe in conjecture. Do not believe in authority or teachers or elders. But after careful observation and analysis, when it agrees with reason and it will benefit one and all, then accept it and live by it. – Buddha
If you aren’t just buying and index fund, then you need to do your own homework. The investing world is full of experts making predictions, but as David Dreman and Philip Tetlock have made clear in their studies of expert predictions, we stink at predicting the future. At Tetlock says in his book Expert Political Judgment:
These results plunk human forecasters into an unflattering spot along the performance continuum, distressingly closer to the chimp than to the formal statistical models. Moreover, the results cannot be dismissed as aberrations…Surveying these scores across regions, time periods, and outcome variables, we find support for one of the strongest debunking predictions: it is impossible to find any domain in which humans clearly outperformed crude extrapolation algorithms, less still sophisticated statistical ones.
Don’t listen to predictions. Making investment decisions on the basis of expert opinion (for the market or for individual stocks) is a road to ruin.
What has been will be again, what has been done will be done again; There is nothing new under the sun. —Ecclesiastes
Market behavior never changes. The names, industries, and participants do—but the patterns are always the same. Here is an updated look at a chart I posted earlier comparing the first stock market bubble to a current one.
[image error]
People keep buying expensive stocks because there is always the chance that one of these outrageously expensive stocks works out. Google and Apple both had P/E’s north of 100, after all, and they’ve been two of the best stocks over the past decade. But for every Apple there are countless other speculative, overpriced messes. In the past 50 years, companies with P/Es>100 have underperformed the markets by 5.1% per year (and that includes the Apples of the world that have outperformed). Might Plug Power grow its way out of this valuation nightmare? Sure, it’s possible, but it’s not probable.
Nature does not hurry, yet everything is accomplished. – Lao Tsu
Don’t just do something, sit there! – Zen joke
The road to wisdom runs through calm inaction, desireless waiting – Lao Tsu
Maybe the best piece of investment advice. As Tolstoy said, the greatest warriors are time and patience. Be in the market for a long time, don’t tinker, let compounding work.
The future, which is already here, like an oak in the acorn – Joseph Campbell
Invest early, sensibly (simple global index funds, rules based strategies with consistent and repeatable processes), and then wait 20-40 years.
-->
-->
[i]--> It is important to note that the universe/benchmark here is large stocks, but the effect is even more pronounced among small caps (think Plug Power et al).
-->[ii]--> Based on measures like price-to-sales, price-to-earnings, ebitda/ev, etc.


