
Patrick O'Shaughnessy's Blog, page 37
May 19, 2014
More Expensive Than Ever?! (No)
Profit margins are high, so I’ve seen many bears resort to using price-to-sales as their go-to barometer of market valuation. My data-torturing heckles are up a bit (as is, if you torture the data long enough it will tell you anything you want to hear). Price-to-earnings doesn't tell a catastrophic story, nor does market level price-to-sales, so lately some have resorted to median price-to-sales. On this measure, the S&P 500 is more expensive than ever! Lookout below!!! Price-to-earnings and even market level price-to-sales refuse to cooperate with the bear argument, so this new valuation method has become popular because it suits the bear story. So let’s look at some price-to-sales stories over the past 50 years.
First up is a long-term look at market level price-to-sales (sum of all market caps in U.S. stocks divided by sum of all sales for U.S. stocks) compared to median price-to-sales for all investable U.S. stocks[i].
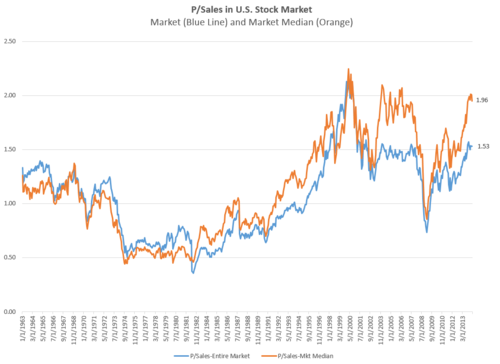
You can see that there have been large divergences between median and market level price-to-sales since 2002 or so, and the median p/sales is currently 27% higher than the market level p/sales. Across the full sample, the median p/sales and market p/sales track more closely, with the median being 7% higher than market level p/sales, on average.
A second interesting way of looking at price-to-sales is to look at the distribution of price-to-sales ratios in today’s market versus the very long term.
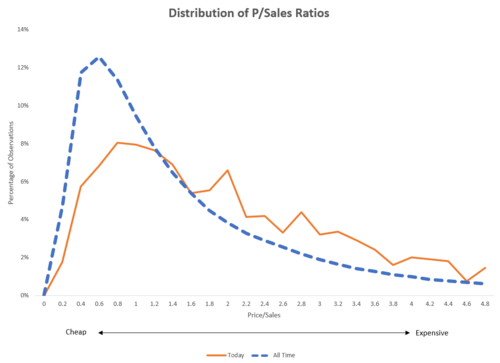
Like the first chart, this paints today’s market as richly priced, but not outrageously so. For the past 50 years (dotted line), the most common p/sales ratio is roughly 0.6 (the peak of the chart). Today, the most common ratio is roughly 0.9. The right (expensive) tail is also interesting. Over the long term, 11% of stocks trade at a p/sales ratio great than 3; today, 21.5% of the market trades at a p/sales above 3.
Bottom line: the U.S. market is on the expensive side. But it’s not “more expensive than ever,” not by a long-shot. The current market level price-to-sales (1.53) is 30% lower than its all-time peak (2.21). Even the median—which is high at 1.96—is 13% below its all-time peak of 2.25. I continue to believe that investors should build a global portfolio, because many of the best valuations are outside of the U.S. market.
[i] Investable = market caps > $200MM, adjusted for inflation back in time


May 16, 2014
"Do What You Love"
My wife and I had a scare with our four month old son yesterday. Following a routine checkup, we had to see an especially dreaded kind of “specialist” about something. Everything turned out fine and normal, but it was our first experience as parents feeling abject terror—a feeling of deep, gut-wrenching love and emotion. It’s a feeling countless parents had described to me before my son was born, but one which no words can adequately describe.
During my son’s short life, and our momentary scare, my thinking has been oriented even more towards process (means) over goals (ends). Morgan Housel wrote a nice piece on this topic recently, and several points bear repeating.
Great processes lead to great outcomes, which is why I love investment strategy research—I get to build processes. But favoring process over outcomes is applicable throughout life, as my son has made me feel intimately.
Josh Brown posted a fun summary of David Tepper’s interview at the SALT conference, where two points stood out to me.
First, I chuckled at Tepper’s response when asked if he believed in karma (“are you f*cking kidding me?”), but I disagree wholeheartedly with the sentiment. Karma isn’t mystical mumbo-jumbo, the word itself is Sanskrit for “act or deed done.” It basically just means cause and effect…what you put in (process) determines what you get out. I find karma in this sense to be a universal truth, and Tepper, with his incredible hard work and philanthropic generosity, would probably agree.
Second, and more importantly, Tepper told the audience to “do what you love.” This may sound like obvious and easy advice to dole out, but it’s very hard to execute. When you unpack his simple suggestion, there is far more than meets the eye. On Wall Street in particular, outcomes (usually money, sometimes power) get in the way. Life is the moment, that’s it. When we focus on outcomes instead of on LIFE, our means begin to suit our ends—which is backwards—and we end up getting lost. It’s very hard to stay focused on process (on life-as-moment) because goals and favorable outcomes are so enticing. Blame natural selection. Part of our evolutionary heritage is that our brains are flooded with dopamine (positive re-enforcement) when we are anticipating gains/rewards far more than when we actually receive a reward.
Doing what you love forces you to focus on the present instead of on the future—on process over outcomes. In Kevin Roose’s book Young Money, my favorite passages were those where young, well paid Wall Streeters struggled with this very problem: money, or happiness? Some followed love, others money. Don’t get me wrong, money and success are great outcomes, but they are only sweet when they are byproducts of a process that you love. Tepper said it best.

After hearing the news from the doctor that my son was okay, I had one of those great moments in life when you realize “this is it,” what I do in the present is all there really is, and it’s all that should matter. On this Friday, I am thankful to be doing something I love and to have a healthy, happy son and family. The rest will take care of itself.
Life is beautiful, life is precious. Have a great weekend.
May 15, 2014
For Great Returns, Follow the Cash
Earnings get all the attention on Wall Street. While earnings are of course important (and measures like P/E are very useful in stock selection), they aren’t everything. Less discussed, but equally important, is the cash that is flowing into and out of a company. Hidden in the statement of cash flows is an extremely useful tool for identifying great investments.
When a company releases its three financial statements, the income statement (led by bottom line earnings) dominates, the balance sheet comes second, and the statement of cash flows generally comes third. You’ll see a lot of “breaking earnings reports” on CNBC, but you’ll never see a “breaking cash flow report.”
This may be in part because the statement of cash flows has only been around since 1987, whereas income statements and balance sheets have been around forever. In the cash flow statement, cash flows are grouped into operating, investing and financing categories. Operating cash flows dominate—these are inflows and outflows resulting from normal business operations. Investing cash flows matter too, because they reveal how much a company is investing in things like machines, office buildings, and the like. But financing cash flows are the most useful for investors.
Financing cash flows are pretty straightforward. Positive numbers (cash coming into the company) result when a company raises cash from outside stakeholders (through debt or equity offerings). Negative numbers (cash leaving the company) result when a company sends cash back to stakeholders by repaying debt, paying dividends, or buying back shares.
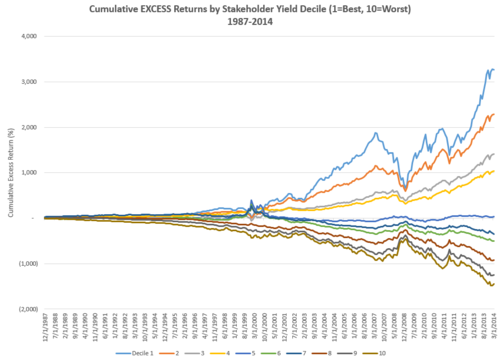
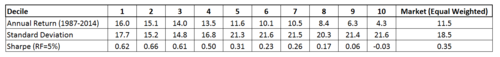
It turns out that companies with the most negative flows, relative to their market value, perform considerably better than those with the most positive flows and perform better than the overall market. The factor (financing cash flows divided by market value) is sometimes called “shareholder yield,” but I prefer “stakeholder yield” because it doesn’t belittle the creditors who are not technically equity shareholders. Here are the annualized results, since 1987, for stocks broken into decile groups by stakeholder yield.
The bottom line is that following financing cash flows has been extremely useful in the past, and you ignore them at your own peril.
NOTE: This factor has received attention (notably in Jim O’Shaughnessy’s What Works on Wall Street, in Meb Faber’s Shareholder Yield, and in academic papers), but still remains fairly under the radar. In this example, I only run the numbers since the statement of cash flows was first reported in 1987 and only use data directly from the cash flow statement (although the factor can be extended to 1970 using other data, as I did in a previous piece).
May 12, 2014
Two Ways To Improve The Momentum Strategy
Momentum investing worked very well in 2013, but it’s been awful in 2014. The momentum reversal has been one of the major headlines in an otherwise flat and quiet market year because the high-flying stocks from 2013, especially popular tech names like Tesla, have been crushed in recent months. Momentum investing works great over the long term but can suffer from short term reversals that are painful to live through. Luckily, there are ways to significantly improve the momentum trading strategy—which would have side-stepped the momentum carnage of 2014 completely.
Momentum Works On Its Own
Momentum investing is popular because it has worked well across market history. I’ll define momentum in simple terms: total return over the past 6 months. Since 1963, a strategy that buys the top group (best 10% of the market) of stocks by 6-month total return, has delivered a 14.4% annual return, which is roughly 4.5% better than the S&P 500. But, to earn this excess return you have to live through a roller coaster ride. The annualized volatility of this strategy is 24.4%—almost 10% more than the market’s 15% annual volatility.
The weakness of a raw momentum strategy is that it will sometimes piles you into very expensive and/or low quality stocks. At the end of 2013, companies in the top 10% of the market by trailing 6 month return (which included lots of social media stocks, biotechs, and power companies) had valuations which were, on average, more expensive than 67% of the market[i]. Some of the most talked about names like Plug Power and Twitter were literally the most expensive stocks in the market. The best way to mitigate this issue is by insisting on valuation and quality—if you never buy the expensive, junk stocks, then the momentum strategy gets much better.
Improving the Momentum Strategy with Value
You may think that value and momentum are polar opposites, but they work remarkably well together. Think of the combination as cheap stocks that the market is just beginning to notice. The combination of the two factors yields results more impressive than either of the two investing styles on their own. (Note: for value, I’ll use the simplest measure possible to make the point: price/earnings)
The cheapest 10% of stocks by P/E have historically delivered 16.3% per year, and the top momentum stocks have delivered 14.4%, but a combination of the two has yielded 18.5% per year (bottom right corner of the table below). What’s more, the volatility of this combined strategy comes way down: from 24.4% for raw momentum to 18.9% for value + momentum.
The table below breaks all stocks into a 5x5 panel by value and momentum (6m return and price/earnings). Stocks in the upper left have terrible value and terrible momentum. Stocks in the lower right have great momentum and great valuations. The combination of these concepts has been very powerful.
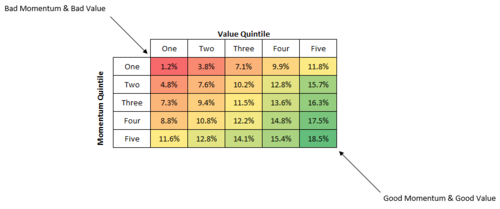
Annualized returns, 1963-2013
Quality Works Too
A second way to improve the momentum strategy is to focus on companies with higher quality earnings. The simplest way to define quality earnings is by looking at non-cash earnings. The fewer non-cash earnings (which come from accruals like accounts receivable), the better[ii]. Here is a similar 5x5 panel by quality and momentum. The effect is similar to value, but quality is a different factor and so a different take on qualifying the stocks you are willing to buy.
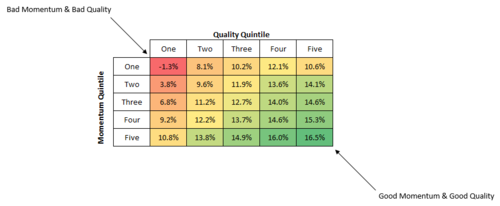
Annualized returns, 1963-2013
Don’t Fight the Tape, Unless...
Momentum investing works on its own—but there are ways to improve the strategy by following some trends and ignoring others. If you are trading momentum stocks, remember that the momentum effect has worked better amongst the cheapest and the highest quality names out there. If value was a part of your momentum strategy, you’d wouldn’t have owned any of the stocks making headlines for the wrong reasons so far in 2014.
Some people are buying the dip, but most of these stocks remain very expensive. Investing based on factors like momentum is like all other investing: diversification improves and smoothens your returns.
[i] Value based on a combined measure of p/sales, p/earnings, ebitda/ev, yield
[ii] Earnings Quality defined as percentage change in total accruals
May 10, 2014
Clash of the Financial Pundits Reviewed
Punditry is all about concise sound bites, so before diving into a full review, my one sentence review of Josh Brown and Jeff Macke’s new book Clash of the Financial Pundits is “a spoonful of sugar helps the medicine go down.” This is a book that sneaks great investing advice and wisdom into your brain by sugar-coating it with great stories, good writing, and several fascinating interviews.
Jeff Macke asks the question early on:
But with it being the case that people can’t beat the market over time, wouldn’t that make punditry a little bit of a racket? What do you think of financial media? You’ve got this constant reporting, this buy on the short term; what are they going to earn this quarter? Is it just a mugs game from top to bottom?
Punditry plays to our primal instincts. We love punditry because it’s entertaining but also because we foolishly think that financial experts will give us some edge with what they say on TV. What we need is long term, steady advice, but what we get are “hot tips.” As Jim Rogers says
I try to spread this message all the time, Jeff. It doesn’t work. Everybody wants a hot tip. Everybody wants to be rich this afternoon. You can sit there all day long and say, “The emperor has no clothes.” Nobody wants to hear it. They all want a hot tip.
I loved the discussion of pundit intelligence and of the negative forecasters. Smarter people do not necessarily make smarter predictions, even though it seems like they should. And, for some reason, being negative makes a pundit sound smarter even though markets have delivered mostly positive results over the long term. Henry Blodget points out, “For some reason, being negative always sounds smarter. I don’t know what it is about people, but I noticed this when I was an analyst as well. It’s easier to sound smart as a negative pundit.” Jeff Macke asks:
Is there a deadline on this prediction for the imminent apocalypse that’s going to come? Because you need a starting point, right? If we get a 25 percent correction now, that’s not going to go anywhere near taking back all the gains we’ve seen. But most pundits refuse to say, “I was wrong.” No one is ever wrong. They’re “early.” Sometimes really, really early.
Brown and Macke continually point out that the same emotions that get us in trouble in the markets—greed and fear—are the most reliable ingredients to produce a hit piece of punditry. The main lesson I took from this book was that financial punditry can be great entertainment. But just like you shouldn’t go to Vegas to get rich, you shouldn’t make investing decisions based on sound bites. Take punditry for what it is, and you’ll be entertained and your portfolio will be no worse for wear. But if you use the “expert” advice and forecasts that you hear on TV, you are in some serious trouble.
The interviews were great, but my favorites were Altucher (“The only way they fill up the space between commercials is by having either extreme fear or extreme greed”) and Ritholtz (“television is halfway between ESPN 4 and the weather channel . . .”).
I’ve just scratched the surface: there are tons of hidden gems throughout, which I won’t spoil here. James Altucher says, “What the audience thinks is that they want to learn something. But what they don’t realize is that they want the ice cream. It’s just like people in general. People think they want to eat healthy. Nobody wants to eat unhealthily. But at the end of the day people eat ice cream all day.” Ice cream is of course bad for you, but it’s enjoyable. The trick this book pulls on the reader is that it is like ice cream that is somehow good for you. I highly recommend it.
May 6, 2014
Talk Is Cheap: Why CEOs' Actions Speak Louder Than Their Words
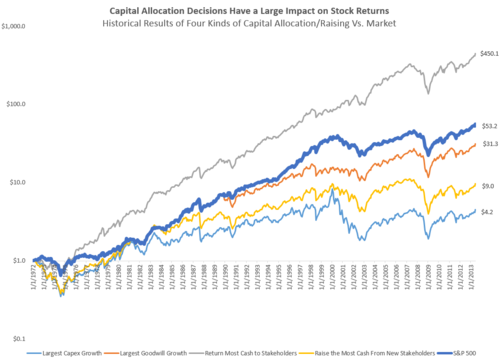
When you think of any famous CEO, you probably think of the great products or services that they’ve championed. CEOs that build great businesses become very famous, and justifiably so. But building a business that generates tons of cash flow is just step one. The less interesting—but equally crucial—job of any CEO is allocating their capital. Capital allocation is not glamorous, but capital allocation choices have had a huge impact on stock returns historically. The bottom line is that disciplined, shareholder-oriented capital allocation plans produce great results—for both companies and investors…but reckless spending, acquisitions, and cash-raising lead to weak results.
How to Use Capital
When it comes to allocating (or raising) capital, CEOs have a fairly limited toolkit. As William Thorndike, author of The Outsiders: Eight Unconventional CEOs and Their Radically Rational Blueprint for Success, summarizes in his book:
CEOs have five essential choices for deploying capital—investing in existing operations, acquiring other businesses, issuing dividends, paying down debt, or repurchasing stock—and three alternatives for raising it—tapping internal cash flow, issuing debt, or raising equity. Think of these options collectively as a tool kit. Over the long term, returns for shareholders will be determined largely by the decisions a CEO makes in choosing which tools to use (and which to avoid) among these various options. Stated simply, two companies with identical operating results and different approaches to allocating capital will derive two very different long-term outcomes for shareholders.
Let’s look at each option and how they affect stock returns, on average.
Investing In Operations
CEOs need to do two things well to be successful: run their operations efficiently and deploy the cash generated by those operations.
— William Thorndike
The first group is companies that have lots of new capital expenditures. I consider the 10% of companies every year[i] that are growing their capital expenditures by the greatest percentage year over year. These are the big spenders. How has this group done historically? They’ve delivered an annual return of 5.4%[ii]. That is roughly half the return of the market’s 10% return over the same period. Rapid growth may sound good, but these results indicate otherwise. Overzealous expansion has led to weak stock returns. These stocks are also more volatile than the market (22% annual standard deviation vs. 15.5% for the market).
Acquiring Other Businesses
The easiest way to find acquisitive companies is to look for those companies whose “goodwill” has grown by the greatest percentage in the past year. Goodwill is a balance sheet account that grows when one company buys another, but pays more than the book value of the company they are acquiring (the difference is added as an asset called “goodwill,” which ostensibly measures the value of things like brand name, patents, etc.). There have been a number of studies which show that big acquisitions tend not to work out for shareholders. The evidence from companies with the largest growth in goodwill supports these findings. This group has delivered an annual return of 6.5% (18% volatility), again significantly lower than the market’s 9.1% (14.8% volatility) return over the same period[iii].
Issuing Debt and Raising Capital
A third group is companies raising lots of cash through debt or equity issuance. These companies have been a disaster historically. The best way to measure this option is using financing cash flows. Financing cash flows come in different flavors, and are basically the “capital allocation” options listed above. Positive financing cash flows (money coming into the company) result when a company raises cash through new debt or equity offerings. Negative cash flows (money leaving the company) result when a company pays back creditors, pays dividends, or repurchases shares. This group is the 10% of companies that have the largest positive financing cash flows relative to their market cap (meaning they are raising cash). The stocks of these companies have grown at just 5.71% (21% volatility)--which is a little more than half the market’s 10% return (15% volatility) over the same period[iv].
Dividends, Share Buybacks & Paying Down Debt
The last category—and the one that delivers great outperformance versus the market—is the 10% of companies that have the most negative financing cash flows. These companies are sending cash back to stakeholders by paying dividends, repurchasing shares, or paying down debt. Their historical returns have been 15.4% per year (17.6% volatility), which is 5.4% better than the market’s 10% return (15% volatility)[v]. Sometimes these companies are referred to as having high “shareholder yields.” Owning these companies has worked great in the past.
The data from these four groups shows that you can do very well as an investor by following a CEOs actions. If they are spending like crazy, or raising tons of cash—look out. If, instead, they are sending cash back to stakeholders, then you should take notice.
Discipline Is Key
Back to The Outsiders. The author distills the lessons he’s learned down to 10 rules, the 8th of which is very important:
8. Retain capital in the business only if you have confidence you can generate returns over time that are above your hurdle rate [hurdle rate being some minimal acceptable return on investment, say 20%].
The discipline implied by this eighth rule is rare. CEOs awash in cash often spend overzealously on projects with lower than acceptable rates of return or on projects/acquisitions that are simply too risky. The successful CEOs described in The Outsiders had a disciplined process for spending on new projects. If there are no projects available that can earn a high rate of return, the best CEOs instead pay dividends, repurchase shares, or pay down debt.
Just like with investing, disciple is key for CEOs to be successful—and true discipline is rare. As Thorndike points out,
This outsider approach, whether in a local business or a large corporate boardroom, doesn’t seem that complicated; so why don’t more people follow it? The answer is that it’s harder than it looks. It’s not easy to diverge from your peers, to ignore the institutional imperative, and in many ways the business world is like a high school cafeteria clouded by peer pressure. Particularly during times of crisis, the natural, instinctive reaction is to engage in what behaviorists call social proof and do what your peers are doing. In today’s world of social media, instant messaging, and cacophonous cable shows, it’s increasingly hard to cut through the noise, to step back and engage Kahneman’s system 2 [thinking with your head instead of with your gut], which is where a tool that’s been much in the news lately can come in handy.
One example is with share buybacks. In general, they’ve led to solid returns for investors. But you’ll often read stories that buybacks are mistimed and stupid uses of cash. This is partly true. Look at the below table, which takes the 20% of stocks in the market that are buying back the most shares. It then splits this group out into give groups by valuation. You can see that when CEOs and their companies buyback shares at cheap prices[vi], their stocks tend to do very well in the next year, beating the market by 5% on average. But when they buyback stock while valuations are expensive, they get killed by the market, losing by 5% on average. The key lesson is that the best CEOs buyback shares when it’s smart to do so, not just because all the other kids are doing it.
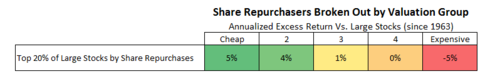
1963-2013
Ultimately, choosing what to do with a company’s cash (or how to raise it) is one of a CEO’s most important decisions. By avoiding the big spenders, and buying cheap companies that are disciplined with their cash and rewarding their shareholders, you can outperform the market over the long-term.
-->
-->
-->[i]--> Rolling annual rebalance
-->[ii]--> 1963-2013
-->[iii]--> 1989-2013
-->[iv]--> 1972-2013
-->[v]--> 1972-2013
-->[vi]--> Cheapness measured by p/e, p/sales, ebitda/ev, etc
May 3, 2014
Portfolio Patriotism, and Why You Should Avoid It
The U.S. equity market is expensive. The median stock is about as pricey as it’s been in 50 years, and valuations are all clustered: there are far fewer bargains than in years past. I am not an index investor, so I generally pay less attention to market-level valuation measures like the Shiller P/E or Tobin’s Q—but both show the U.S. market as expensive. These valuation tools are more strategic than timing tools, but both signals advise caution.
What’s strange, then, is how little attention global equities get. The debate is all about the U.S. market, which represents less than half of the global stock market. But today, non-U.S. equities are cheaper than U.S. equities, with more bargains to be had. One simple example: among companies with a market cap greater than $200MM, there are about 100 companies in the U.S. that still have a price-to-earnings multiple below 10; there are more than 550 Non-U.S. stocks with a P/E below 10.
American investors need to diversify globally, because having all one’s risk tied up in one market doesn’t make sense—especially when that market is the most expensive developed market in the world. It’s not just because valuations are better abroad, but because history teaches us again and again that individual country markets can have long, tumultuous periods of negative returns. Luckily, the global market portfolio usually holds up well.
Portfolio Patriotism
The preference to own companies in one’s home country is one of the most pervasive and persistent biases in investing. We prefer familiar companies that offer products or services that we use and know. Lots of U.S. investors own Coke, but very few own Suntory (a Japanese drinks company). The overweight to home countries is often extreme. In 2010, the U.S. market was roughly 43% of the global stock market, but U.S. investors had 72% of their portfolios allocated to U.S. stocks. It’s much worse in smaller countries like Canada and the U.K. In 2010, Canadian stocks were roughly 5% of the global market, but Canadian investors had a 65% allocation to their domestic market (the U.K. was very similar: 8% of the global market, but U.K. investors had a 50% allocation)[i].
If you believe in index investing, then a “neutral” or “passive” portfolio would be the MSCI All-Country World Index or some similar benchmark, but few portfolios look like the ACWI. Even though the U.S. has been the dominant stock market for more than 100 years, there are compelling reasons to own a more global portfolio.
Using the incredible long-term global equity market data built by Dimson, Marsh, and Staunton, we can review the history of individual country equity markets to make the case that you should not bundle all your risk into one country. There have been many examples of disaster within one market, so to think that similar disasters won’t happen in the future is naïve. Throughout it all, the global equity portfolio has held up remarkably well.
Triumph of the Optimists
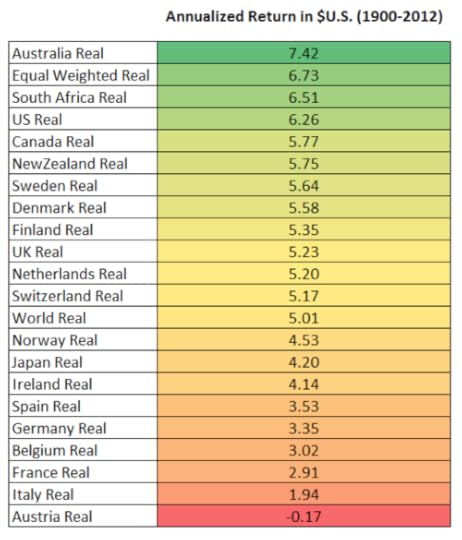
based on annual data from Dimson, Marsh & Staunton
Dimson, Marsh and Staunton’s book Triumph of the Optimists is a must-read for many reasons, but the core message (hinted at in the title) is that equity markets across the 20 major countries that the authors studied have performed well since 1900 —19 have delivered positive returns after inflation. At the right is a table of the annualized returns for these 20 countries between 1900 and 2012 (note: 2013 data not yet available, so these numbers would all get better, sometimes much better). The U.S. market has been one of the top performing markets over the past 113 years. It lagged Australia and South Africa, but because it was many times the size of those smaller markets, its performance has been amazing. It is interesting to note that the top markets are very rich in natural resources.
Worst Case Scenarios
While the long term record has been strong for equities, nobody has a 113 year time horizon (well, unless you are Ray Kurzweil). Investors are still jittery today and worried about the risk in stocks, so I ran the worst-case scenarios for all 20 equity markets over a variety of different holding periods, which are listed in the table below (these returns are in US dollars, so they represent the returns that a U.S. investor would earn rather than a local investor in each respective market—the local returns are quite similar).
[image error]
based on annual data from Dimson, Marsh & Staunton
While the U.S. has never had a negative 20-year period of returns, most markets have. Other than the U.S., only the Canadian and Australian markets have provided positive returns in all 20-year periods. Because the U.S. has such a dominant weight in the World portfolio, I’ve also included an equal weight portfolio here, which does very well (equal weight to each of the 20 countries, rebalanced annually).
Here is the cumulative growth of the three best markets alongside the three worst and the world portfolio since 1900.
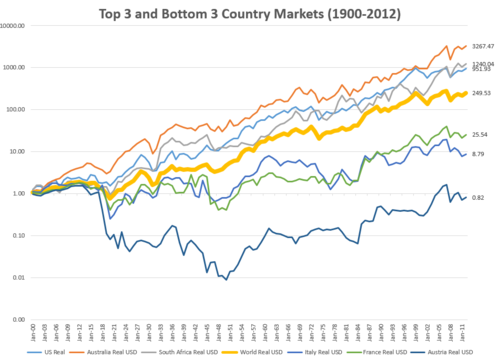
based on annual data from Dimson, Marsh & Staunton
World War II
You’ll notice in the table above that many of the countries that have had very bad 40 year worst-case scenarios were in the thick of things during World War II. Along with the Great Depression, World War II was the most disruptive influence on stock market returns. Below are the results for the U.S. and Axis powers in and around the war. As always, to the victor go the spoils. Germany’s stock market was essentially “reset” after the wind down of its three major banks (that had sympathized with the Nazis) in 1948, so German investors were wiped out.
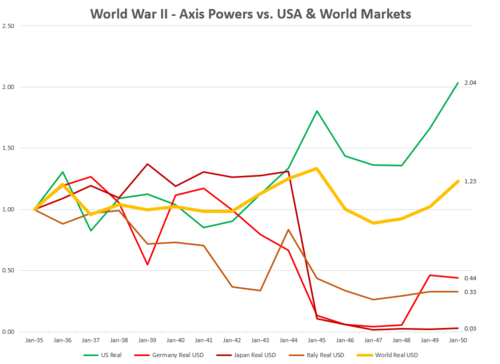
based on annual data from Dimson, Marsh & Staunton
The worst case scenario for us in the future would be some similar dislocation that crushed the U.S. equity market. It is interesting to note how the world portfolio performed (because it included both the winners and the losers--again this is in US Dollars but local version is similar). Of course, it would have been very hard (or impossible) to own a global portfolio in the 1940’s, but today it’s easy.
Go Global
Overcoming portfolio patriotism is important if you want to reduce long-term risk in your portfolio. The U.S. market has indeed had a remarkable multi-century run, and some of that success may be because America is “exceptional” in some key ways (then again, the insane American demographic explosion didn’t hurt, but that effect has stabilized—with a fertility rate of 1.9 we aren’t quite replacing our population). Still, other great countries have faltered in the past.
It just so happens that today, international country stock markets offer many of the best opportunities. As has been exhaustively demonstrated by many valuation experts (Grantham, Shiller, Meb Faber, and so on), the U.S. market is more expensive on an absolute and relative basis that most other major countries throughout the world. This isn’t a death sentence for the U.S. market, as there have been many examples where the market did quite well even from an expensive starting point. But it would be foolish, given how easy and cheap it is to buy global stocks, to keep your equity risk concentrated in your home country. This final chart is the Triumph of the Optimists writ large: it tracks the long term growth of $1 in the world equity portfolio (weighted by market cap) and an equal weighted version of the world portfolio. These returns include two World Wars, the Great Depression, countless recessions, crises, and market collapses. If you are an investor with a long time horizon, the global stock market should be the central part of your portfolio.
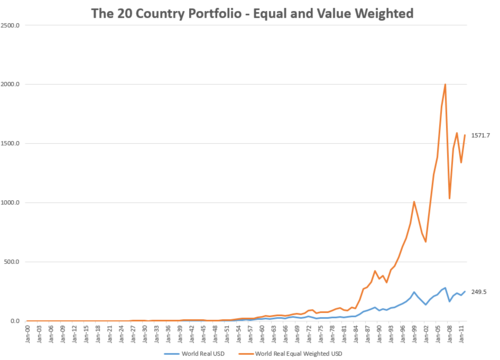
based on annual data from Dimson, Marsh & Staunton
-->
-->
May 1, 2014
Reading List - May 2014
I've started a monthly reading list to share the best books that I've ever read. For the first few months I will also post the lists here to give you a sense for what they look like. If you'd like to receive these monthly recommendations, sign up for the reading list here. Also, if you have any favorite books, please send them my way. I'm always on the lookout for hidden gems.
This month, I've included four books. The first three are money/market focused, and the last is just an incredible book.
Saving Capitalism From Short-Termism: How to Build Long-Term Value and Take Back Our Financial Future by Alfred Rappaport
Rappaport is an under-appreciated writer. I discovered him through Michael Mauboussin, who lists Rappaport as an important influence. Mauboussin and Rappaport co-authored another book together called Expectations Investing. Saving Capitalism from Short-Termism explores the many problems that result from short-term thinking. I spend a chapter in my book on the same topic, which was in part inspired by this great book.
Here’s a passage on short-term thinking:
“The practice has persisted over the entire span of human history, from ancient days, when people didn’t live long enough to worry about the long term and focused on immediate needs, such as hunger, to today’s craving for instant gratification in the face of damaging long-term consequences. Drug abuse, overeating, smoking, and spending rather than saving are vestiges of that ancient attitude.”

The Most Important Thing: Uncommon Sense for the Thoughtful Investor by Howard Marks
“To boil it all down to just one sentence, I’d say the necessary condition for the existence of bargains is that perception has to be considerably worse than reality.”
Howard Marks rivals Warren Buffett when it comes to quality shareholder letters. This book is the best of those letters and ideas weaved together into a brilliant narrative. One of my favorite books on value/distressed investing.
Here is a good passage:
“Unlike market darlings, the orphan asset is ignored or scorned. To the extent it’s mentioned at all by the media and at cocktail parties, it’s in unflattering terms. • Usually its price has been falling, making the first-level thinker ask, “Who would want to own that?” (It bears repeating that most investors extrapolate past performance, expecting the continuation of trends rather than the far-more-dependable regression to the mean. First-level thinkers tend to view past price weakness as worrisome, not as a sign that the asset has gotten cheaper.) • As a result, a bargain asset tends to be one that’s highly unpopular. Capital stays away from it or flees, and no one can think of a reason to own it.”
The History of Money by Jack Weatherford
Ever since finding this book, I’ve been fascinated with the history of money. Weatherford's book is my favorite on the subject, because it is equally entertaining and informative. Money is arguably our most important invention, and it has changed a lot over the centuries. This is a great story that will make you think about your money and its future. Weatherford’s book on Genghis Kahn is also fantastic.
“Humans have found many ways to bring order to the phenomenological flow of existence, and money is one of the most important. Money is strictly a human invention in that it is itself a metaphor; it stands for something else. It allows humans to structure life in incredibly complex ways that were not available to them before the invention of money. This metaphorical quality gives it a focal role in the organization of meaning in life. Money represents an infinitely expandable way of structuring value and social relationships—personal, political, and religious as well as commercial and economic.”

Boyd: The Fighter Pilot Who Changed the Art of War by Robert Coram
This guy was incredible in three different ways. First, he was the best fighter pilot in the Air Force. He was nicknamed “40-second Boyd” because it never took him more than 40 seconds to defeat someone in the air. Second, he was a remarkable thinker. He created a formula (E-M theory) that was the basis for designing new planes (the F-15 and F-16 being the two main ones) and for evaluating the performance of any fighter plane in the air. He also revolutionized military tactics, both in the air and on the ground. Some refer to him as the most important military strategist since Sun Tzu. His ideas were put to use by the Marines in the Gulf War and resulted in a lopsided victory for the United States. Third, he was a fighter. He didn’t give a crap about money or rank. He told his acolytes that in life you could be somebody, or you could do something. Doers don’t rise in the ranks or get the accolades, but they make a difference in the world. Boyd was a doer.
Here is a great passage about Boyd, the civil rights activist:
One day in 1957 a new instructor came to the FWS: First Lieutenant Oscar T. Brooks. He was black. The next Friday rolled around and by midmorning Boyd’s staff was preparing to leave for the drive down Las Vegas Boulevard to the Sahara. Spradling pulled Boyd aside, nodded toward Lieutenant Brooks, who was standing across the room, and said, “John, is this a good idea?” “Is what a good idea?” “Taking Oscar to the Sahara. They will throw us out if Oscar goes. He’s going to be embarrassed.” Boyd turned to Spradling and his voice was low and urgent and intense. “Sprad, goddammit, he’s going. We’re going down there as a group and if they kick us out they’ll have to kick out the whole base. They’ll have to kick out the fucking U.S. Air Force.”
April 30, 2014
Beware Experts Bearing Predictions
You should ignore experts making predictions, you should avoid making predictions of your own, and you should definitely avoid any investment decision that is predicated on a subjective prediction. Predictions are everywhere in investing (price targets, GDP forecasts, S&P 500 earnings, EPS estimates, and so on), but they are usually worthless.
Our brains evolved to recognize patterns, which creates the side effect that we are pattern junkies. Whenever we see two of something, we automatically expect a third. This pattern-addiction makes us obsessed with the future. We usually turn to experts for predictions about the future, and the stock market is chock full of more forecasts than any other arena of interest or speculation. But the evidence below shows that economic and market forecasts are crap: in most cases you may as well flip a coin. I’ll explain why instead of relying on expert predictions, you should do your own research, focus on process, and always stick to your strategy.
Why We Love Experts
If you make people think they’re thinking, they’ll love you; but if you really make them think, they’ll hate you.
— Don Marquis
Experts are surrogate thinkers. They do the thinking so you don’t have to! We love experts because they allow us to outsource our thinking but also because of the psychological bias known as the “halo” effect. The better known, more intelligent, better looking, or more respected an expert forecaster is, the greater the confidence we have in their predictions.
So what is the record of expert forecasters? The most comprehensive study on the topic was conducted by Philip Tetlock, whose book Expert Political Judgment is a must read. In the book, he assesses 28,000 forecasts made by hundreds of experts in a variety of different fields. He finds their abilities lackluster:
These results plunk human forecasters into an unflattering spot along the performance continuum, distressingly closer to the chimp than to the formal statistical models. Moreover, the results cannot be dismissed as aberrations…Surveying these scores across regions, time periods, and outcome variables, we find support for one of the strongest debunking predictions: it is impossible to find any domain in which humans clearly outperformed crude extrapolation algorithms, less still sophisticated statistical ones. (my emphasis)

A similar study was conducted specifically for investing/market forecasts. The CXO Advisory group gathered 6,582 predictions from 68 different investing gurus made between 1998 and 2012, and tracked the results of those predictions. There were some very well-known names in the sample, but the average guru accuracy was just 47%--worse than a coin toss. Of the 68 gurus, 42 had accuracy scores below 50%.
Another study of analyst estimates conducted by David Dreman showed that across 400,000 different estimates, the average error was 43%! (It is interesting to note that Dreman was was of the "gurus" from the CXO study--but he was the 5th best overall with an accuracy of 64%).
Back to Tetlock’s study, which uncovered one variable that did effect whether the expert was more or less accurate:
It made virtually no difference whether participants had doctorates, whether they were economists, political scientists, journalists, or historians, whether they had policy experience or access to classified information, or whether they had logged many or few years of experience in their chosen line of work. The only consistent predictor was, ironically, fame, as indexed by a Google count: better-known forecasters—those more likely to be fêted by the media—were less well calibrated than their lower-profile colleagues.
The problem isn’t that these experts are dumb—indeed, they are usually very smart. The problem is that it is nearly impossible to predict outcomes in complex, adaptive systems like the stock market or the economy. J.P. Morgan (the original) had the only appropriate and accurate market forecast: “it will fluctuate.”
A Forecast Free Investing Process
Instead of basing your investment decisions on subjective forecasts, base them on simple rules or models. Many people don’t like models because they are impersonal and “backward looking.” We want insight and prediction; models just spit out an answer. Of course models aren’t perfect, but they can be really helpful.
Simple models almost always beat experts. They are consistent, data driven, and easy to apply. From wine prices (Orley Ashenfelter), to political elections (Nate Silver) to individual stock returns—models work; and they use information that is already available instead of relying on forecasts about the future.
Ben Graham was the father of investing models—his checklists for the defensive and enterprising investor were decades ahead of their time. Similar systematic approaches are gaining popularity in the form of smart/strategic beta. These tend to be watered down applications of great ideas like value, momentum, or quality, but they can be a good start. The key with a modeling approach is to be consistent and stick with it. It is always most tempting to abandon a model when it’s suffering through an inevitable period of underperformance—but that is the worst time to leave (think of a value strategy in 1999).
Quants are the heaviest model users, but the important point here is that you should have rules and a consistent process. Many of the most famous investors aren’t quants, but they often have a system: a set of rules consistently applied when buying and selling. Here are a few examples of model or rules based projections that have worked quite well for the market.
Shiller CAPE ratio (as Ben Carlson recently pointed out, CAPE is a strategic tool, not a timing tool)GMO’s seven-year forecasts (based on simple principles like mean reversion)Individual stock selection factors including value, momentum, yield, and quality Altman’s Z score for bankruptciesOne frequent criticism of models is that using them is like driving by looking in the rear-view mirror. They only look backwards—at what has already happened—and never look forward to what will happen. But anyone making this objection is planting the axiom that others can successfully look out the windshield and accurately see what is coming. The evidence above suggests otherwise.
The CAPE ratio, for example, is very “backward looking,” because it uses data from the past 10-years. One of the most common criticisms of the CAPE ratio is that 10 year old data is irrelevant in today’s market environment (“it’s different this time!”) Yet as Meb Faber has shown, a simple strategy that buys markets with the lowest CAPE ratios does very well (read this). The beauty of the CAPE model is that if forces you into terrible situations where the forecasts for the future are dire. Low CAPE ratios result from very bad news, fear, and forecasters whose consensus is that the market is going to hell (think Greece, or Russia today).
We rely on stories and circumstances when we should care more about price. The story about each cheap market is always different, but the psychology that creates each attractive market opportunity is always the same. That is why investment models like CAPE work: they prey on the mistakes of fallible human investors and don’t get caught up in trying to figure out each new, market circumstance. A CAPE ratio tells you nothing about what will happen to any given country in the future, but it identifies markets that may have been mispriced.
Ignore Experts, Think For Yourself
Jiddu Krishnamurti, a great thinker and writer, spent his life urging others to investigate things for themselves rather than rely on experts. Two passages from his book Freedom from the Known urge us to step up our game:

Jiddu Krishnamurti
For centuries we have been spoon-fed by our teachers, by our authorities, by our books, our saints. We say, ‘Tell me all about it—what lies beyond the hills and the mountains and the earth?’ and we are satisfied with their descriptions, which means that we live on words and our life is shallow and empty. We are second-hand people. We have lived on what we have been told, either guided by our inclinations, our tendencies, or compelled to accept by circumstances and environment. We are the result of all kinds of influences and there is nothing new in us, nothing that we have discovered for ourselves; nothing original, pristine, clear.
Krishnamurti highlights the importance of thinking for yourself and, often, standing alone. He could have been writing about many famous investors. In the passage below, if you replace “society” with “market,” and “a comfortable spiritual life” with “strong investing results," then you’ve got yourself one fine investment philosophy!
The traditional approach is from the periphery inwards…and [yet] when at last one comes to the centre one finds there is nothing there, because one’s mind has been made incapable, dull and insensitive. Having observed this process, one asks oneself, is there not a different approach altogether—that is, is it not possible to explode from the centre? The world accepts and follows the traditional approach. The primary cause of disorder in ourselves is the seeking of reality promised by another; we mechanically follow somebody who will assure us a comfortable spiritual life [strong investment results]. It is a most extraordinary thing that although most of us are opposed to political tyranny and dictatorship, we inwardly accept the authority, the tyranny, of another to twist our minds and our way of life. So if we completely reject, not intellectually but actually, all so-called…authority, it means that we stand alone and are already in conflict with society [the market]. (my emphasis)
Standing in conflict with the market is hard because it means you have to fight the popular opinion, which often built by experts making forecasts. But there is no evidence that expert opinion is worth listening to. Avoid expert forecasts, do your own research, focus on process (models/rules), and stick to your strategy. These rules are a solid foundation for a good investing process.
April 27, 2014
The Death of Money Portfolio
I finished James Rickards’s latest book Death of Money this weekend, which I found provocative, informative, and scary, but ultimately lacking in terms of investment advice. Rickards knows his stuff, and I recommend the book for all the great information it contains and because it will get you thinking. I plead ignorance on most of the books topics, save the final one: how you should position your portfolio to defend against what Rickards thinks is an inevitable global financial meltdown. His suggested portfolio has some serious flaws.
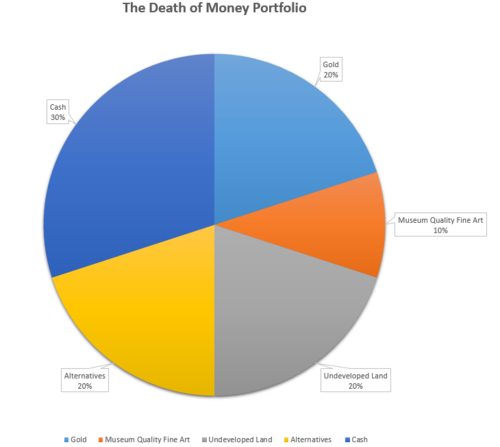
The Death of Money Portfolio
At the very end of the book, Rickards recommends the following portfolio allocation: 20% gold, 30% cash, 20% alternatives (long/short equity, resource funds, etc.), 10% fine art, and 20% undeveloped land. Rickards suggests that this portfolio will protect against all of the scary potential outcomes: deflation, hyperinflation, the return to a gold standard, and even social unrest.
His basic rationale is as follows. Gold, land, and art should hold their value and protect against inflation/hyperinflation. Cash protects against severe deflation and gives you optionality to move into whichever other asset makes the most sense depending on how the collapse plays out. Alternatives (he specifies resource based funds, or long/short equity) should do well in any environment. A few thoughts on this portfolio:
It is incredibly unproductive. Aside from whatever yield you’d earn from the alternative category, this portfolio is dead weight that produces no income (and, because he recommends physical gold and undeveloped land, it also has significant carrying costs).
It is all but impossible for a typical investor to build. Unless you’ve got a multi-million dollar portfolio, how the hell could you invest in museum quality fine art, hedge funds, and undeveloped land? Even the part of the portfolio for which I have the most sympathy (alternatives) is easier said than done: finding the right hedge fund managers is very hard to do—and the best ones are often closed to new investors.
It should hedge against the severe outcomes he foresees. Rickards is clear that he can’t predict how the international monetary system will melt down, only that it will. This portfolio—which emphasizes hard assets—would hold up well in a severe deflationary scenario, hyperinflation, and maybe even during social unrest. In discussing the importance of hard assets, Rickards makes an interesting observation on Warren Buffet’s acquisition of Burlington Northern:
Buffett described this purchase as a “bet on the country.” Maybe. A railroad is the ultimate hard asset. Railroads consist of a basket of hard assets, such as rights of way, adjacent mining rights, tracks, switches, signals, yards, and rolling stock. Railroads make money by transporting other hard assets, such as wheat, steel, ore, and cattle. Railroads are hard assets that move hard assets. By acquiring 100 percent of the stock, Buffett effectively turned the railroad from an exchange-traded public equity into private equity. This means that if stock exchanges were closed in a financial panic, there would be no impact on Buffett’s holdings because he is not seeking liquidity. While others might be shocked by the sudden illiquidity of their holdings, Buffett would just sit tight. Buffett’s acquisition is best understood as getting out of paper money and into hard assets, while immunizing those assets from a stock exchange closure. It may be a “bet on the country”—but it is also a hedge against inflation and financial panic. The small investor who cannot acquire an entire railroad can make the same bet by buying gold. Buffett has been known to disparage gold, but he is the king of hard asset investing, and when it comes to the megarich, it is better to focus on their actions than on their words.
The invocation of Buffett brings me to my next point…
No global equities?! Rickards has a 0% allocation to history’s most successful and remunerative asset class. As he himself explains many times in the book, forecasting outcomes in complex adaptive systems like the global financial/monetary system is very hard to do. It is odd, then, that his portfolio assumes a 0% chance that some global markets will weather the coming storm. A global equity portfolio has stood up remarkably well since 1900 through a wide variety of calamitous events. In my book, I have a chapter on the importance of “going global,” because while a German equity investor between 1900 and 1948 (or a Japanese investor between 1990 and the present) would have realized awful returns in their home country equity markets, they would have done just fine in a global portfolio. Of course, there were no cheap, global ETFs in 1900 so the German investor would probably have still been screwed, but things are different today. Even if the U.S. were to collapse or significantly falter, a global portfolio should provide some protection.
Rickards believes that anything that is a derivative or an electronic claim on an asset is dangerous and should be avoided. But if we are going to be in a situation where stocks markets are all shut down and our stock holdings are worthless, then the best investment might be a go bag! Rickards even suggests keeping your gold somewhere other than a bank safety deposit box, which brings me to my final huge concern…

Gold. One of my main issues with owning gold is the fact that I don’t command an army. Most people forget that FDR—one of our most respected and popular presidents—confiscated the country’s gold in 1933 through Executive Order 6102. Americans had to turn over their gold in exchange for $20.67 an ounce. If they didn’t, would have had to pay a fine and might have been sent to jail for 10 years. With the confiscated gold secure in vaults at the newly built Fort Knox, FDR re-priced gold at $35 an ounce, giving the U.S. extra dollars to fight off the Great Depression. Americans weren’t allowed to own gold again in significant quantities until the 1970’s. If Rickards is right, then why in the world couldn’t (or wouldn’t) a similar confiscation happen again?? Maybe we’d get a somewhat fair price for our gold, but if things were as bad as Rickards suspects they may be in the future, the government might just flex its muscles and take it all. They’ve got an army with guns. Individuals would be bringing knives to a gun fight.
The bottom line is that the Death of Money portfolio is not really an investment portfolio, but a big hedge against the Chicken Little, sky-is-falling, scenario. Zero equity exposure makes no sense to me. Owning some hard assets is a reasonable suggestion (I buy some gold jewelry for my wife!), but in the event that the world weathers the coming storm, and global stock markets don’t cease to function, you should have a large allocation to global equities. Sometime soon, I will write a more data driven post on the importance of global equities—which are very important given current valuations in the U.S. In the meantime, check out Meb Faber’s latest book Global Value.


