
Randy Krum's Blog, page 18
January 19, 2018
Ikigai - Visualizing the Japanese Concept of Life's Purpose
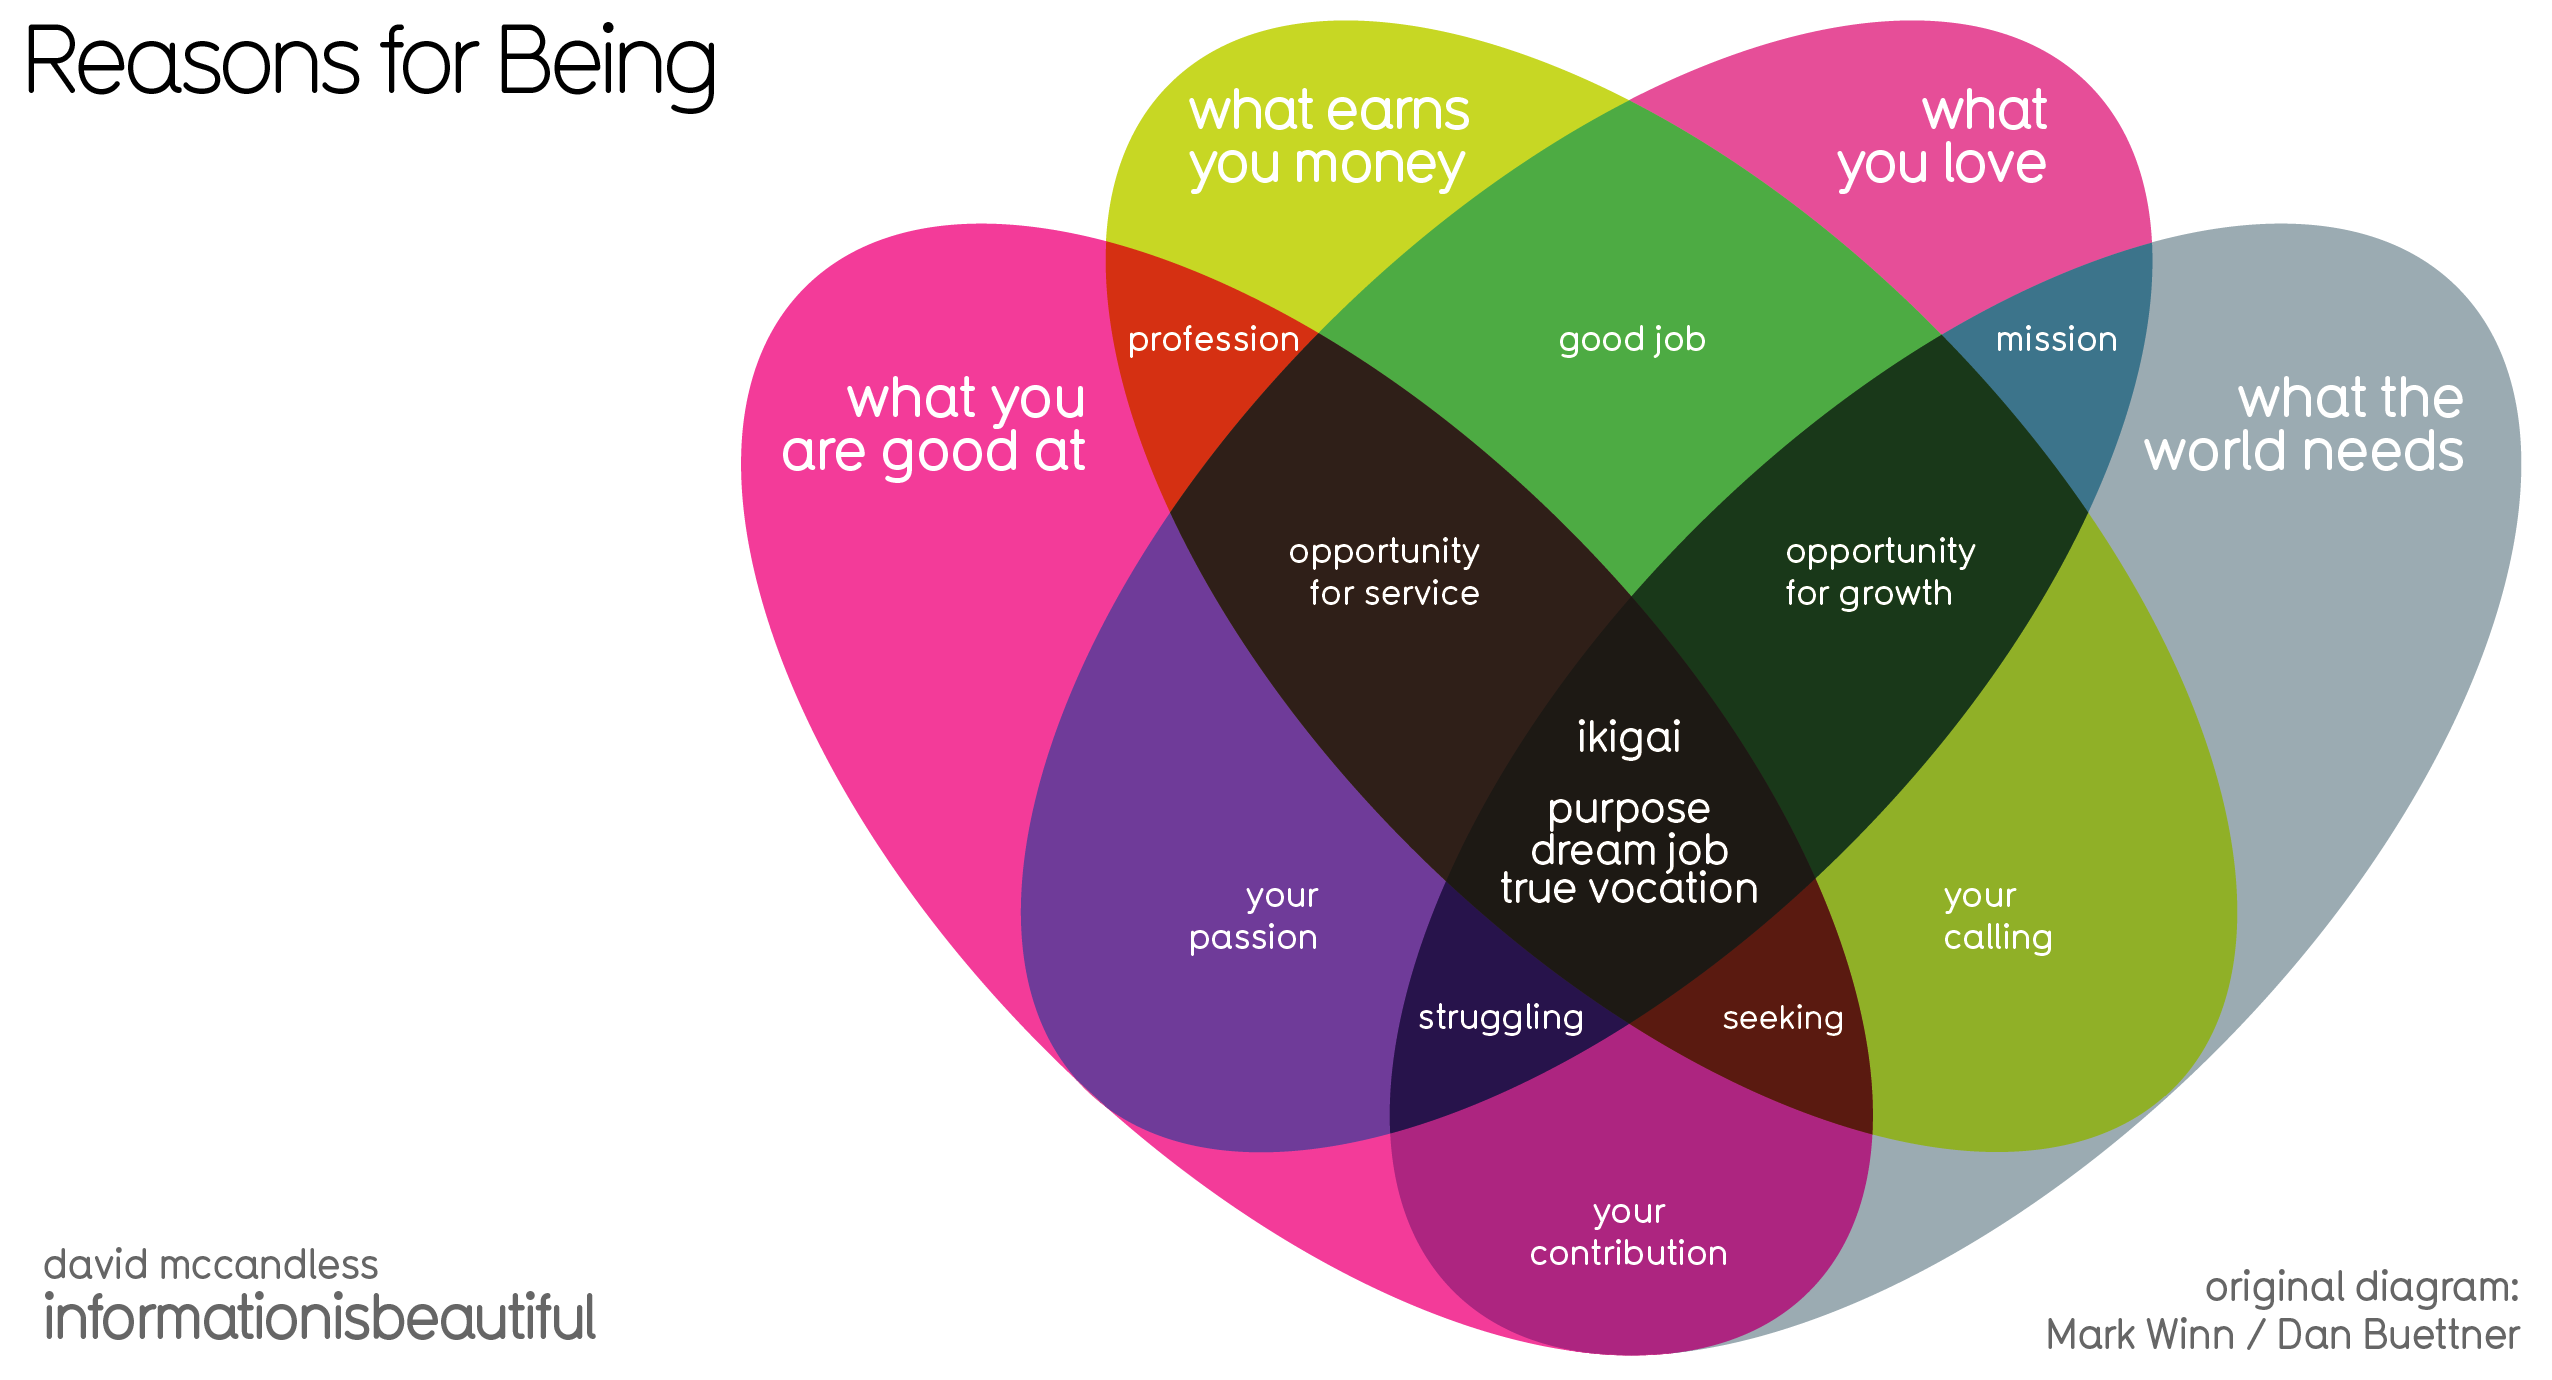
Ikigai is a Japanese concept that explains how a person can enjoy life. To illustrate this concept, a 4-sided Venn diagram was created by Dan Buettner (below), showing what it takes for one to discover their own. However, David Mccandless saw the original diagram and found it flawed. Above, we have his version of Ikigai- Japanese concept to enchance work, life & sense of worth diagram where he has theorized what should be inserted in the missing gaps, as well as giving the sections different sizes to more accurately represent the importance of each.
Ikigai is an interesting self-development concept from Japan, a prism for potentially seeing how to bring satisfaction, happiness & meaning to life. The direct translation is the “happiness of being busy.”
The original diagram was created by British community activist Marc Winn in 2014 from a TED Talk on Longevity by writer Dan Buettner.
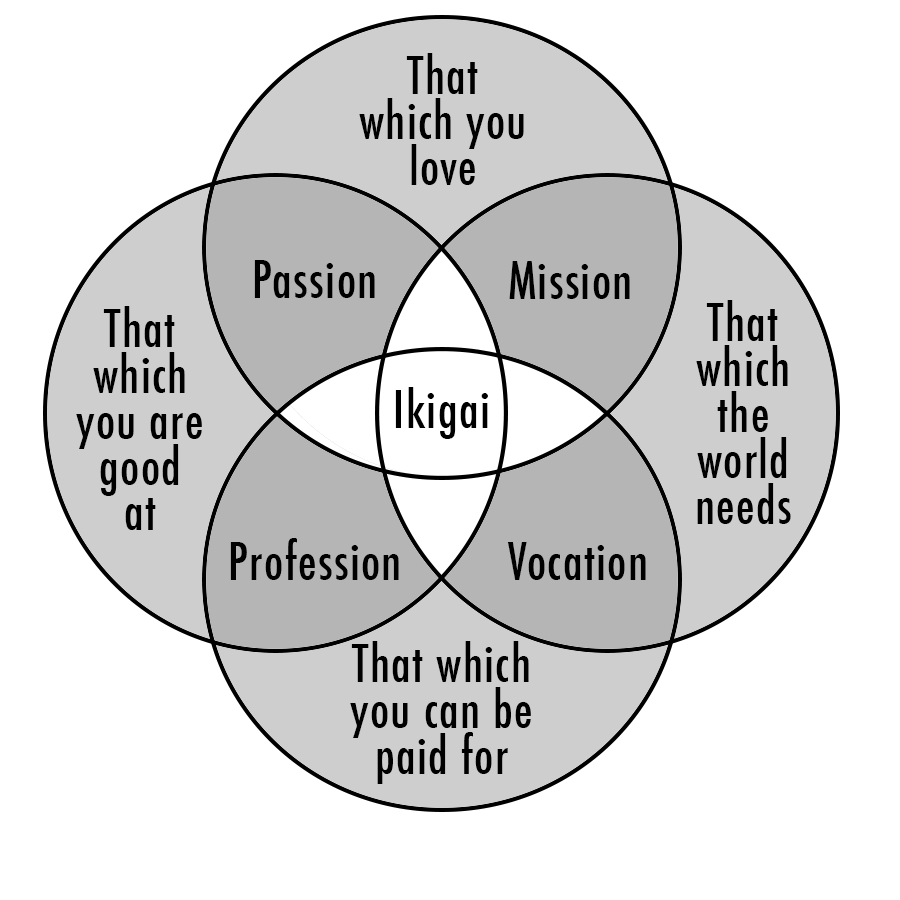
Sadly, pedantically, the four-way Venn in the diagram is broken, from a technical POV. If you look closely, two sectors – love & paid for, good at & world needs – don’t intersect uniquely.
So I fixed that and theorised what those missing sectors might contain, while making a few other tweaks.
Got stuck a bit with “what the world needs” category which has a touch of entrepreneurial zeal about it. Not everyone can impact ‘the world’. But couldn’t come up with a variation that worked.
What’s interesting is that two intersections make something positive – passion, mission etc. But three intersections create a discomforting pinch point i.e. if you good at something, it’s what you love and what the world needs, but doesn’t earn you money, you’re “struggling”.
Found on Information is Beautiful


January 11, 2018
Abita Beer Release Calendar 2018
In case you're not familiar with Abita Beers, it's a fantastic brewery out of Louisiana. In addition to a core set of beers, they make a number of seasonal brews that are only available certain times of the year. This visual Beer Release Calendar is your visual guide to when you favorite brews are in season!
The new year is here and we're looking forward to another great year of brews! We've been hard at work behind the scenes planning for 2018 and wanted to share some of what we've been working on. Our 2018 Beer Release Calendar is everything we'll be releasing and boiled down to one single sheet. It's our brew bible! Of course, most of your favorites are back, but as you'll see we're bringing some beers you might recognize out of retirement and releasing a ton of new beers. In all, we'll brew and package 31 beers in 2018 and that's not counting the tons of beers we'll be experimenting with and releasing on our pilot system here at the brewery.
I really like this design. The colors come from the individual beer labels, and I appreciate the additional visualization of the available sizes. I appreciate the repeated guide to the monthly column at the bottom. The cursive font, rotated 90° is hard to read.
The gradient bars are a nice touch since those brews don't have a hard end date, they're only available until supply runs out. It looks like the designer accidentally left a few of those as gradient to white instead of gradient to the background tan color.


January 2, 2018
Securing Your CryptoCurrency Trading Account

There's a lot of hype and investor interest in cryptocurrencies right now. Binance.com is one of the major trading platforms that allows you to exchange one currency for another (like exchanging bitcoin for litecoin), but securing your account is very important. Like cash, if thieves get your cryptocurrency, it's gone forever.
I love that they are sharing the best practices for Securing Your Trading Account in this simple, helpful infographic! This is a part of their site FAQ, and there's no separate explanation. Everything is included in the infographic. These are really good practices for any CryptoCurrency trading site, not just Binance!
The design is a little text heavy, because there's no numeric data to visualize, but the text description are short, direct to the point and easy to understand.


December 18, 2017
The Economics of a UK Christmas
Do you have a budget for your christmas this year? The Economics of a UK Christmas infographic from Bridging Loans covers the spending for Christmas in the UK, and it continues to rise! The UK spends the most money on gifts, and more specifically on technology!
Here is a cool infographic we have created that provides lots of statistics about Christmas in the UK. The infographic is broken down into sections including overall Christmas spending, what type of stuff we spend the money on and how the UK compares to the rest of Europe.
My biggest feedback on this design, is too many of the statistics are shown as just text alone. Big fonts are not data visualziations, and just showing many of those values doesn't provide context for the audience.
Thanks to Dave for sending in the link!


December 11, 2017
2017 Shipping Deadlines

Tis the season for shipping! The 2017 Shipping Deadlines infographic from Ship Station will help you get your last minute presents to their destination on time!
Holiday shopping season is approaching, so get your team ready — because shipping is coming. As an online merchant, you need to know the holiday shipping deadlines for carriers and services to get your packages delivered by Christmas weekend. Knowing these cut-off dates will help you set accurate shipping costs, offer available services, instill trust in your online customers, and help them shop on time!
My only hesitation with this design, is it's similarity to Gantt chart. The highlighted periods are all of the acceptable shipping dates, but visually it seems to imply the shipping duration of the different services.
Thanks to Margie for sending in the link!


December 8, 2017
Why Do Businesses Fail?
Starting your own business can be rewarding, but there are a lot of challenges. Why Do Businesses Fail? infographic from Insurance Quotes and NowSourcing outlines some of the biggest problems, paired with solutions.
Small businesses often have a hard time making it work. Just how hard of a time may surprise you. Did you know that 20 percent of businesses fail in the first year, while 70 percent fail by year 10? The biggest contributing factor may seem obvious — cash flow problems.
Despite all these challenges to starting and maintaining your own business, the payoff can make it worthwhile. Here at insuranceQuotes we want to help you navigate the challenges of starting a small business and understand the pitfalls that lay ahead. Here are some facts and strategies that can put you on the path to success.
Information is key for small businesses to survive and thrive. Keep in mind that having the proper business insurance can help you keep a mishap from becoming a disaster, whether you are just starting out in a new business or have been around for years.
Let us know your thoughts on the information we provided and please share any personal business stories that may help other entrepreneurs on our Facebook page. Your successes or failures could help others.
Big Fonts are not Data Visualziations!
There's a lot of great data included in this infographic, but there's too much text in this design and a number of the statistics could have been visualized better. Way too many statistics are shown as just large text numbers without any visualization or context.
There are a number of things wrong with this particular chart. The bar lengths don't match the data values. The bars for 220,000 and 205,000 should be very close, and they're not. Here I've added corrected bars to each cluster using the existing bar length for the New Businesses bar as the base.
[image error]
Maybe this is a non-zero baseline chart? If so, this is intentionally misleading to readers by showing the scale.
Found on Entrepreneur


November 29, 2017
Cool Infographics Book Giveaway December 2017
During December 2017, I am giving away one signed copy of my book Cool Infographics!
Register on the Giveaways Page by December 15, 2017 to be entered.
I posted this on the Giveaways page in November but forgot to mention it here, so I'm extending the registration deadline until December 15th.
You can always download a free chapter from the Book page to get a sample from the 1st chapter, The Science of Infographics.
A cool infographic tells a story visually —an engaging story built with your data. More than just using pictures or colorful charts, infographics create the type of visual information that your audience will quickly grasp and remember. Inside, the fundamentals of infographics are clearly explained for both novices and experienced professionals.


November 28, 2017
Divergent Realities: The Difference Between 'VR' and 'AR'

If you have a business idea that uses either virtual reality or augmented reality, now is the time to look for investors. By 2021 both technologies are expected to be a $108 billion market.
Divergent Realities: The Difference Between 'VR' and 'AR' was designed for Lumus Vision (a company that designs wearable technology) by Now Sourcing and attempts to outline the key differences that set VR apart from its AR counterpart. It also breaks down some of the most popular hardware and software options, the inner workings of both technologies and the ridiculous amount of money they are expected to generate over the coming years.
This article was originally posted in Inc. Magazine, June 8, 2017 by John White.
Virtual reality has been around for decades - Nintendo's Virtual Boy anyone? But today's smartphones are being offered with VR capabilities, leaving developers scrambling to find new and innovative ways to make use of this hot technology that everyone with a smartphone has access to. Today The Discovery Channel produces Shark Week content with virtual reality users in mind, leaving many folks wondering where this technology is going.
Virtual Reality Is Hot Now, But It Is Being Replaced With Augmented Reality
Augmented reality combines the visual aspects of virtual reality with other sensory cues, such as haptic feedback and binaural audio. By 2021 both technologies are expected to be a $108 billion market, with augmented reality alone clocking in at $83 billion. In 2016 the development of augmented reality gear cost over $2.3 billion.
Even Apple is getting in on the augmented reality development boom - they recently released their own AR development kit that will make integrating AR content into existing technology easier. According to a CNBC report, "Virtual and augmented reality product company Marxent has been developing AR apps for Apple products for six years. The company's CEO and co-founder, Beck Besecker, called the announcement a "game changer" because it will help to embed the tech into everyday life.
"(This) could theoretically add a 4th dimension to how we experience the world. Once Apple starts integrating AR into the most popular apps, like email, texting, photos, maps, and music, it will bring AR into our lives in a deep and meaningful way on a daily basis." he told CNBC in an email comment.
First, I'm not a fan of the color scheme. The contrasting colors are harsh and actually detract from the credibility of the design.
Side-by-side comparison infographics are very common and this is a perfect use of one comparing these two very similar technologies.
Found on Lifehacker.com


November 27, 2017
These 5 Giant Companies Control the World's Beer
These 5 Giant Companies Control the World's Beer infographic created by Visual Capitalist illustrates the "illusion of choice" idea. Even if a bar has 50 beers on tap, those beers and their breweries are owned by another bigger company, and there are only 5 of them!
The next time you hit your local pub, the odds are that the pint of beer you order will come from one of five global beer conglomerates.
Together, they own hundreds of the best-known domestic, import, and craft beer brands all over the world, in pretty much any country you can name. Whether you are seeking a smooth pilsner, a creamy stout, or an old-fashioned ale to whet your whistle, this multi-national beer oligopoly has got you covered.
THE BIG FIVE
Until recently, there were actually six big conglomerates: AB InBev, SAB Miller, MolsonCoors, Heineken, Diageo, and Carlsberg.
However, in mere weeks that will no longer be true. The world’s two largest beer companies – AB InBev and SAB Miller – are merging into one massive megabrewer. The deal, which is worth a hefty $107 billion, is expected to close by October 2016.
When it is all said and done, the merged company will have a brand portfolio that will be the envy of the industry: Budweiser, Corona, Stella Artois, Hoegaarden, Pilsner Urquell, Foster’s, Shock Top, Elysian, and Beck’s are just some of the flagship brands involved.
That will be after likely divesting several key brands such as Blue Moon and the entire Miller line of beers to appease antitrust regulators.
THE ILLUSION OF CHOICE
As we said previously when we posted the infographic showing the illusion of choice in consumer brands, we believe it is important for you to be aware of who is supplying the different brands and goods served at your dinner table.
Each dollar you spend is a vote – make sure it goes to a product and company that you believe in.
This type of design is commonly called a "Landscape", in this case it's the Landscape of Beer Companies. They are good for showing groupings of companies, products or brands, but I'm generally not a fan because they can become too complex. This one does a good job keeping the content simple and delivering a clear message that readers can easily understand.
Found on Dailyinfographic.com.


November 8, 2017
Best British Isles Film & TV Locations you can Actually Visit
Having the opportunity to visit a set of one of your favorite films, would be a really special opportunity. Well Direct Holiday Cottages has put together a list of real life places in the British Isles that were used in popular films that you could go visit. The Best British Isles Film & TV Locations you can Actually Visit infogaphic packages a real life photo with one from the film so that the viewer can recognize what scene the site is from. Next time you are planning a trip to the British Isles, swing by one of your favorite movie's sets!
Here is an isnspirational visual guide that we have created providing information about British Isles film and TV locations that you can vist. Check out cool locations from Downtown Abbey, Harry Potter, Da Vinci Code and plenty more by viewing this piece.
Thanks to David for sending in the link!


![[image error]](https://www.bridgingloans.co.uk/wp-content/uploads/2017/11/the-economics-of-a-uk-christmas.jpg)
![[image error]](https://d3gugcju084oac.cloudfront.net/media/default/Infographics/WhyBusinessesFail.png)
![[image error]](http://2oqz471sa19h3vbwa53m33yj.wpengine.netdna-cdn.com/wp-content/uploads/2016/08/beer-brands-1070.jpg)
![[image error]](https://www.directholidaycottages.com/UploadedImages/5/film-tv-locations.jpg?v=2)