
Steve Blank's Blog, page 40
December 9, 2013
How Do You Want to Spend Your Next 4 Years of Your Life?
As our Lean LaunchPad for Life Sciences class winds down, a good number of the 26 teams are trying to figure out whether they should go forward to turn their class project into a business.
Given that we’ve been emphasizing Evidence-based entrepreneurship and the Investment Readiness Level, I guess I shouldn’t have been surprised when someone asked, “After we figure all this data out, should we pursue our idea based on the numbers?”
Ouch.
I pointed out that the “data” you gather in 10 weeks (talking to 100+ customers, partners, payers, etc.,) are not the first thing you should look at. There are three more important things you should worry about.
(see 0:30 in the video below)

——–
1. Do you want to spend the next 3 or 4 years of your life doing this?
(See 1:03 in the video below)
Now that you’ve gotten to know your potential channel and customers, regardless of how much money you’re going to make, will you enjoy working with these customers for the next 3 or 4 years?
One of the largest mistakes in my career was getting this wrong. I used to be in startups where I was dealing with engineers designing our microprocessors or selling supercomputers to research scientists solving really interesting technical problems. But in my next to last company, I got into the video game business.
My customers were 14-year old boys. (see 1:30 in the video) I hated them. It was a lifelong lesson that taught me to never start a business where you hate your customers. It never goes well. You don’t want to talk to them. You don’t want to do Customer Development with them. You just want them to go away. And in my case they did – they didn’t buy anything.
So you and your team need to feel comfortable being in this business with these customers.
2. Is this a scalable business? And if not, are you Ok with something small?
(See 2:03 in the video below)
Is it a lifestyle business while you’re keeping your other job? Is it a small business that hits $4 million in revenue in four years and $8 million in ten years? Or is it something that can grow to a size that will result in an acquisition or some liquidity event?
You need to decide what your personal goal is and how it matches what you think this business can grow into. And you and your cofounders need to have that discussion to make sure that all the co-founders’ interests are aligned – before you make any decision to start the company. If one of you are happy making $500K/year and the other has visions of selling the company to Roche for a billion dollars, you have very different goals. Without clear alignment, one or both of you will be really unhappy later when you try to make decisions.
3. If I Didn’t Make Any Money After 4 Years, Did I Still Have A Great Time?
(See 4:36 in the video below)
If your company fails, would you still say you had one hell of a ride? Founders don’t do startups because they’re searching for a huge financial windfall. They do it because it’s the greatest invention they can imagine. Most of the time you will fail. So if you’re not going to have a great time with your team and learn and build something you are truly excited about – don’t do it.
If you can’t see the video above, click here
Lessons Learned
Do you want to spend the next 3 or 4 years of your life doing this business?
Is this a scalable business? And if not, are you Ok with something small?
If you didn’t make any money after 4 years, did you have a great time?
Filed under: Family/Career/Culture, Lean LaunchPad, Life Sciences


December 2, 2013
When Customers Make You Smarter
We talk a lot about Customer Development, but there’s nothing like seeing it in action to understand its power. Here’s what happened when an extraordinary Digital Health team gained several critical insights about their business model. The first was reducing what they thought was a five-sided market to a simpler two-sided one.
But the big payoff came when their discussions with medical device customers revealed an entirely new way to think about pricing —potentially tripling their revenue.
——
We’re into week 9 of teaching a Lean LaunchPad class for Life Sciences and Health Care (therapeutics, diagnostics, devices and digital health) at UCSF teaching with a team of veteran venture capitalists. The class has talked to ~2,200 customers to date. (Our final – not to be missed – Lessons Learned presentations are coming up December 10th.)
Among the 28 startups in the Digital Health cohort is Tidepool. They began the class believing they were selling an open data and software platform for people with Type 1 Diabetes into a multi-sided market comprised of patients, providers, device makers, app builders and researchers.

The Tidepool team members are:
Aaron Neinstein MD Assistant Professor of Clinical Medicine, Endocrinology and Assistant Director of Informatics at UCSF. He’s an expert in the intersection between technological innovations and system improvement in healthcare. His goal is to make health information easier to access and understand.
Howard Look, CEO of Tidepool, was VP of Software and User Experience at TiVo. He was also VP of Software at Pixar, developing Pixar’s film-making system, and at Amazon where he ran a cloud services project. At Linden Lab, delivered the open-sourced Second Life Viewer 2.0 project. His teenage daughter has Type 1 diabetes.
Brandon Arbiter was a VP at FreshDirect where he built the company’s data management and analytics practices. He was diagnosed at age 27 with Type 1 Diabetes. He developed a new generation diabetes app, “nutshell,” that gives patients the information they need to make the right decisions about their dosing strategies.
Kent Quirk was director of engineering at Playdom and director of engineering at Linden Labs.
A Five-sided Market
In Week 1 the Tidepool team diagramed its customer segment relationships like this:

Using the business model canvas they started with their value proposition hypotheses, articulating the products and services they offered for each of the five customer segments. Then they summarized what they thought would be the gain creators and pain relievers for each of these segments.

Next, they then did the same for the Customer Segment portion of the canvas. They listed the Customer Jobs to be done and the Pains and Gains they believed their Value Proposition would solve for each of their five customer segments.
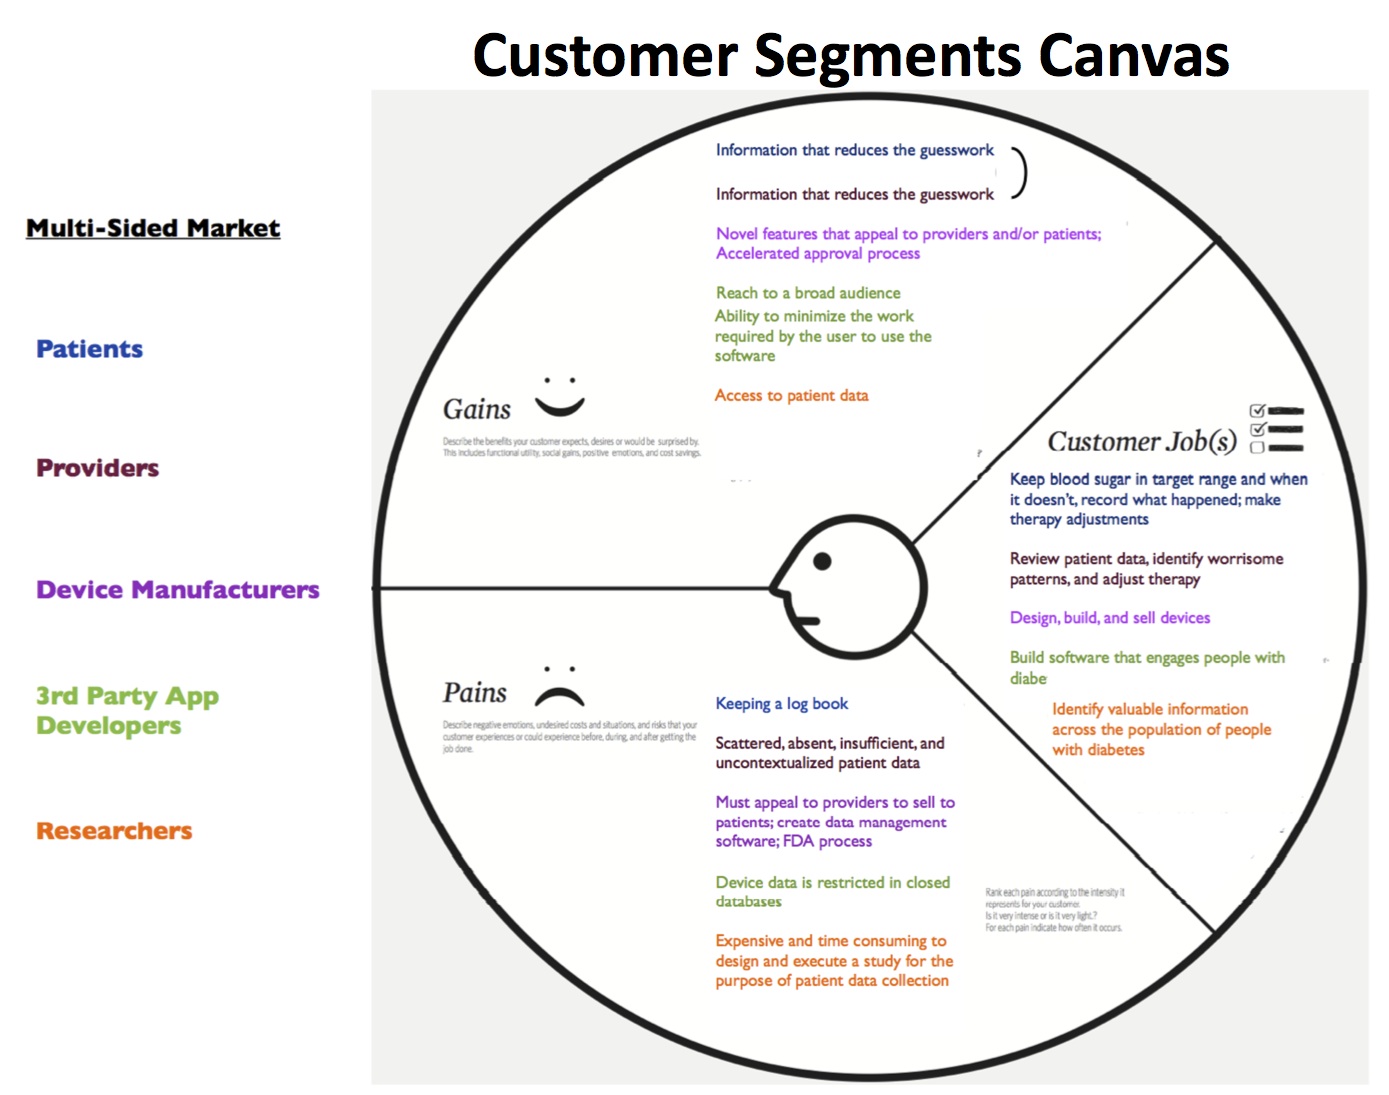
It’s Much Simpler
Having a multisided market with five segments is a pretty complicated business model. In some industries such as medical devices its just a fact of life. But after talking to dozens of customers by week 3, Tidepool discovered that in fact they had a much simpler business model – it was a two-sided market.

They discovered that the only thing that mattered in the first year or two of their business was building the patient-device maker relationship. Everything else was secondary. This dramatically simplified their value proposition and customer segment canvas.
So they came up with a New Week 3 Value Proposition Canvas:

And that simplified their New Week 3 Customer Segment Canvas

Cost-based Pricing versus Value-based Pricing
While simplifying their customer segments was a pretty big payoff for 3 weeks into the class, the best was yet to come.
As part of the revenue streams portion of the business model canvas, each team has to diagram the payment flows.

The Tidepool team originally believed they were going charge their device partners “market prices” for access to their platform. They estimated their Average Revenue per User (ARPU) would be about $36 per year.

But by week 6 they had spoken to over 70 patients and device makers. And what they found raised their average revenue per user from $36 to $90.
When talking to device makers they learned how the device makers get, keep and grow their customers. And they discovered that:
device makers were spending $500-$800 in Customer Acquisition Cost (CAC) to acquire a customer
device makers own customers would stay their customers for 10 years (i.e. the Customer Life Time (CLT))
and the Life Time Value (LTV) of one customer over those 10 years to a device maker is $10,000

These customer conversations led the Tidepool team to further refine their understanding of the device makers’ economics. They found out that the device makers sales and marketing teams were both spending money to acquire customers. ($500 per sales rep per device + $800 marketing discounts offered to competitors’ customers.)

Once they understood their device customers’ economics, they realized they could help these device companies reduce their marketing spend by moving some of those dollars to Tidepool. And they realized that the use of the Tidepool software could reduce the device companies’ customer churn rate by at least 1%.
This meant that Tidepool could price their product based on the $1,800 they were going to save their medical device customers. Read the previous sentence again. This is a really big idea.

The Tidepool team went from cost-based pricing to value-based pricing. Raising their average revenue per user from $36 to $90.

There is no possible way that any team, regardless of how smart they are could figure this out from inside their building.
If you want to understand how Customer Discovery works and what it can do in the hands of a smart team, watch the video below. The team ruthlessly dissects their learning and builds value-pricing from what they learned.
This short video is a classic in Customer Discovery.
If you can’t see the video click here.
Lessons Learned
Most startups begin by pricing their product based on cost or competition
Smart startups price their product based on value to the customer
You can’t guess how your product is valued by customers
Customer Development allows you to discover the economics needed for value pricing your product
Filed under: Customer Development, Customer Development Manifesto, Lean LaunchPad, Life Sciences, National Science Foundation


November 25, 2013
It’s Time to Play Moneyball: The Investment Readiness Level
Investors sitting through Incubator or Accelerator demo days have three metrics to judge fledgling startups – 1) great looking product demos, 2) compelling PowerPoint slides, and 3) a world-class team.
We think we can do better.
We now have the tools, technology and data to take incubators and accelerators to the next level. Teams can prove their competence and validate their ideas by showing investors evidence that there’s a repeatable and scalable business model. And we can offer investors metrics to play Moneyball – with the Investment Readiness Level.
Here’s how.
————–
We’ve spent the last 3 years building a methodology, classes, an accelerator and software tools and we’ve tested them on ~500 startups teams.
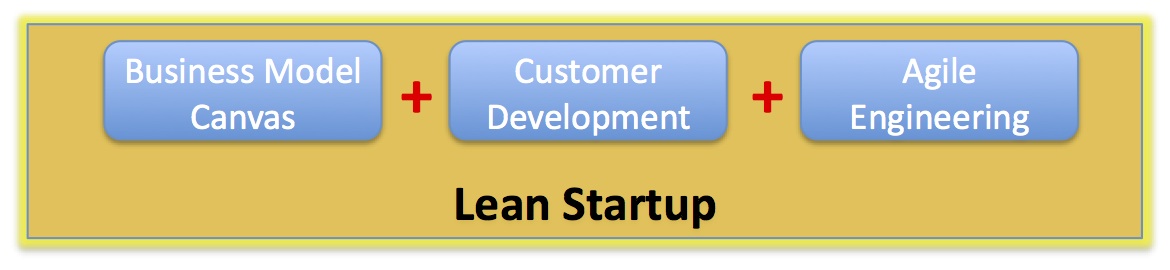
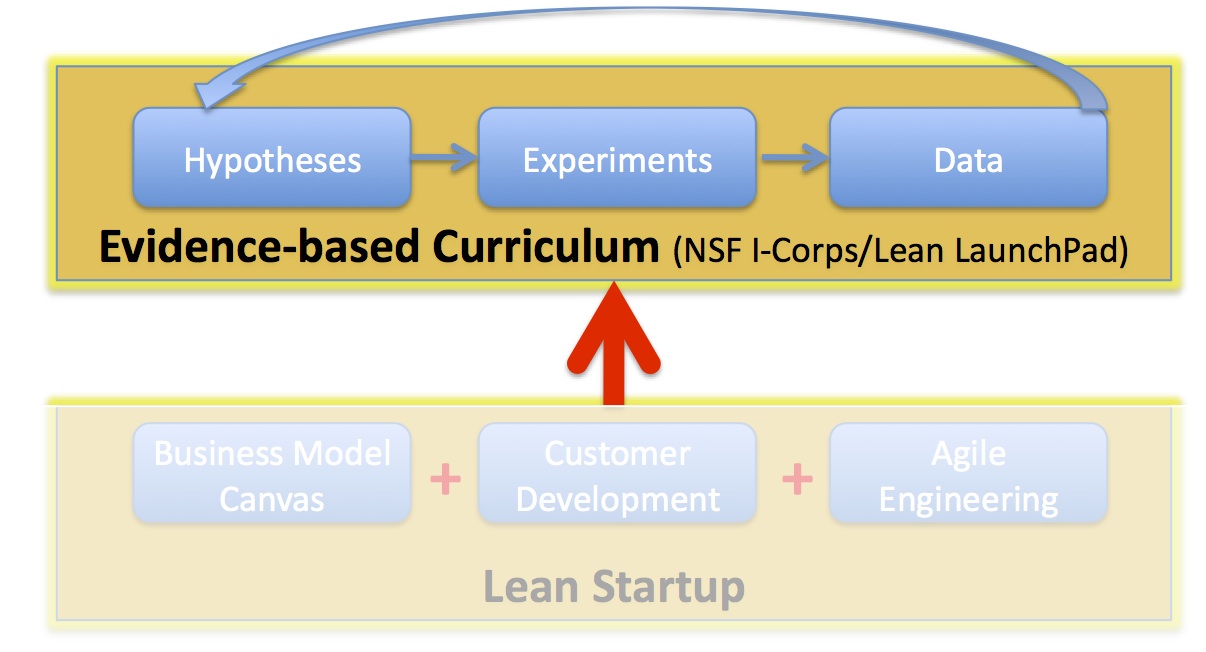
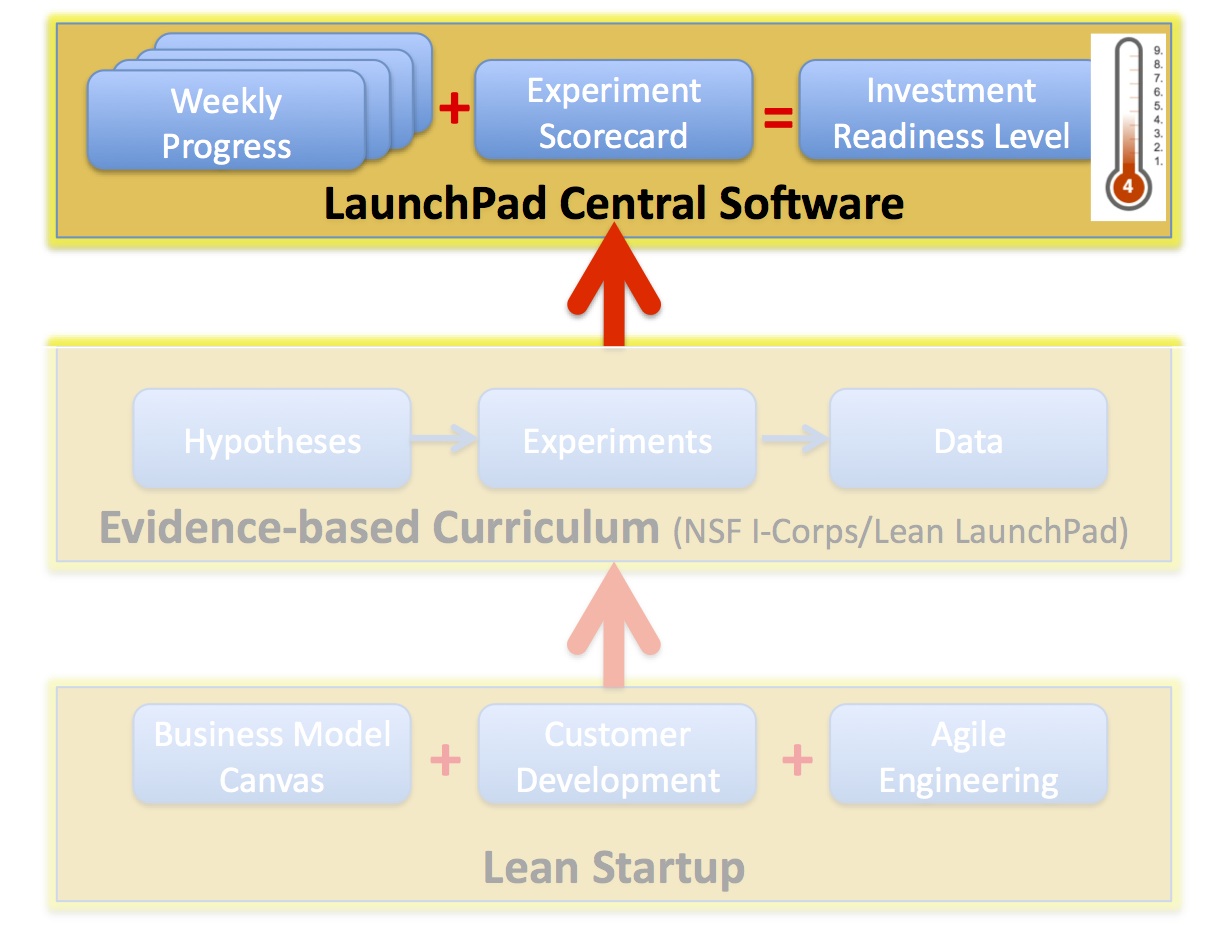
A Lean Startup methodology offers entrepreneurs a framework to focus on what’s important: Business Model Discovery. Teams use the Lean Startup toolkit: the Business Model Canvas + Customer Development process + Agile Engineering. These three tools allow startups to focus on the parts of an early stage venture that matter the most: the product, product/market fit, customer acquisition, revenue and cost model, channels and partners.
An Evidence-based Curriculum (currently taught in the Lean LaunchPad classes and NSF Innovation Corps accelerator). In it we emphasize that a) the data needed exists outside the building, b) teams use the scientific method of hypothesis testing c) teams keep a continual weekly cadence of:
Hypothesis – Here’s What We Thought
Experiments – Here’s What We Did
Data – Here’s What We Learned
Insights and Action – Here’s What We Are Going to Do Next
LaunchPad Central software is used to track the business model canvas and customer discovery progress of each team. We can see each teams hypotheses, look at the experiments they’re running to test the hypotheses, see their customer interviews, analyze the data and watch as they iterate and pivot.
We focus on evidence and trajectory across the business model. Flashy demo days are great theater, but it’s not clear there’s a correlation between giving a great PowerPoint presentation and a two minute demo and building a successful business model. Rather than a product demo – we believe in a “Learning Demo”. We’ve found that “Lessons Learned” day showing what the teams learned along with the “metrics that matter” is a better fit than a Demo Day.
“Lessons Learned” day allows us to directly assess the ability of the team to learn, pivot and move forward. Based on the “lessons learned” we generate an Investment Readiness Level metric that we can use as part of our “go” or “no-go” decision for funding.
Some background.
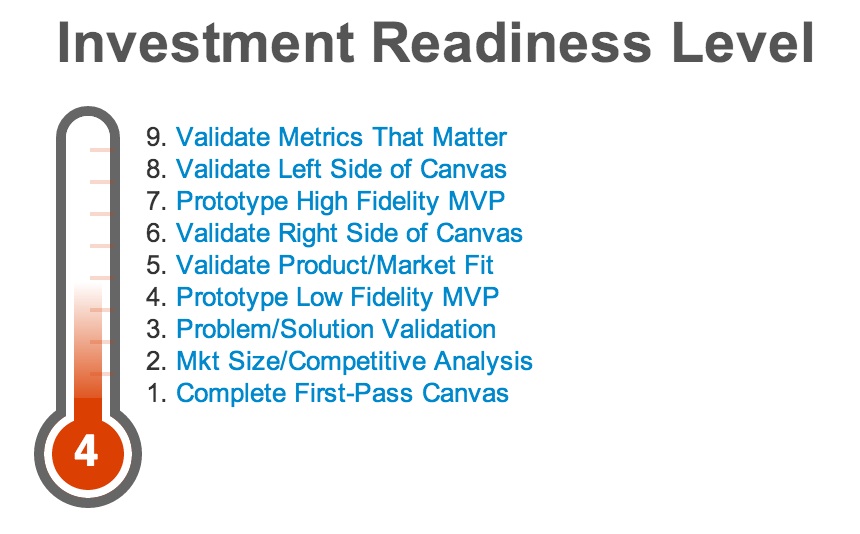
NASA and the Technology Readiness Level (TRL)
In the 1970’s/80’s NASA needed a common way to describe the maturity and state of flight readiness of their technology projects. They invented a 9-step description of how ready a technology project was. They then mapped those 9-levels to a thermometer.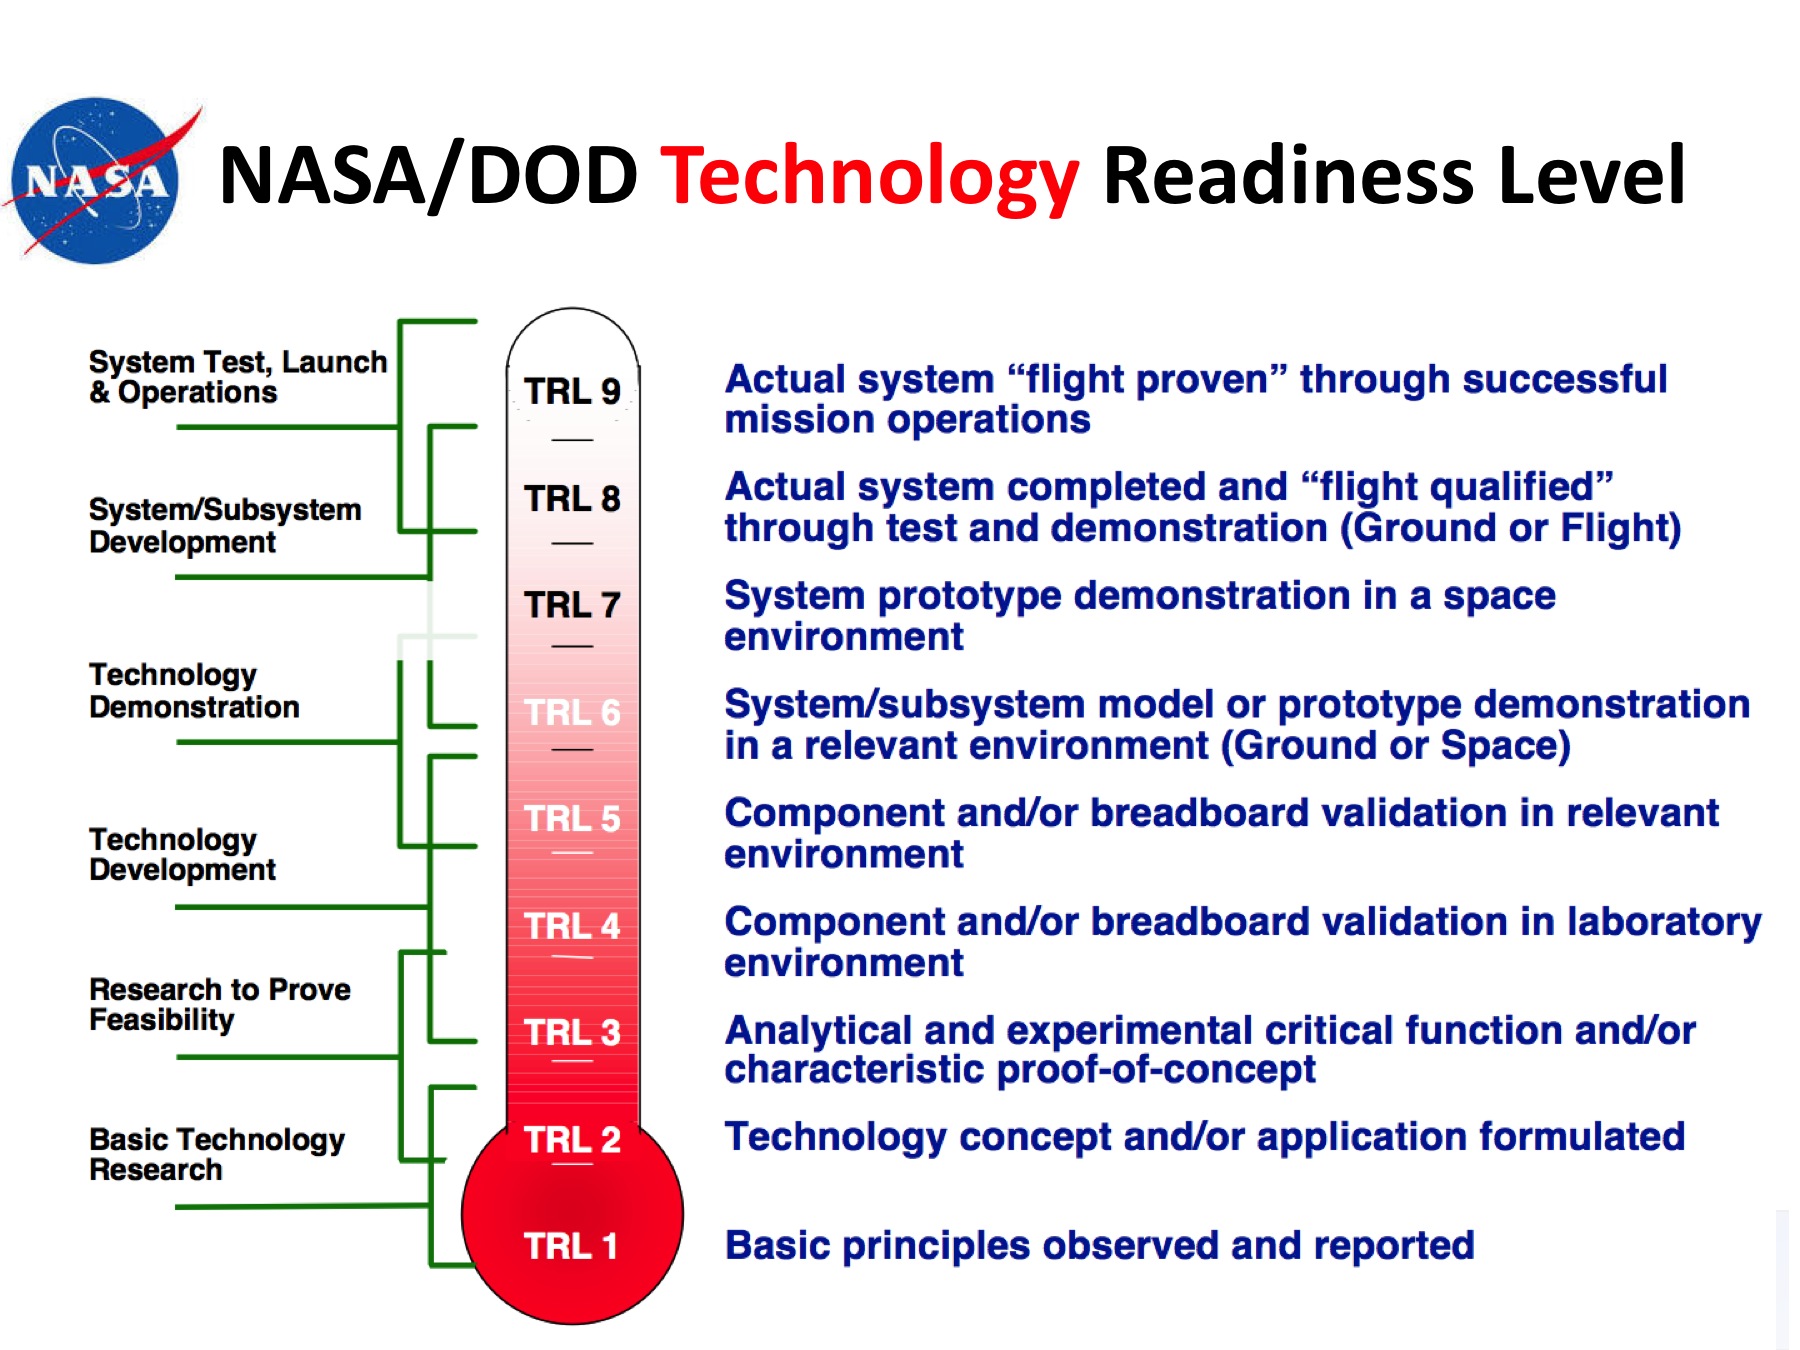
What’s important to note is that the TRL is imperfect. It’s subjective. It’s incomplete. But it’s a major leap over what was being used before. Before there was no common language to compare projects.
The TRL solved a huge problem – it was a simple and visual way to share a common understanding of technology status. The U.S. Air Force, then the Army and then the entire U.S. Department of Defense along with the European Space Agency (ESA) all have adopted the TRL to manage their complex projects. As simple as it is, the TRL is used to manage funding and go/no decisions for complex programs worldwide.
We propose we can do the same for new ventures – provide a simple and visual way to share a common understanding of startup readiness status. We call this the Investment Readiness Level .
The Investment Readiness Level (IRL)
The collective wisdom of venture investors (including angel investors, and venture capitalists) over the past decades has been mostly subjective. Investment decisions made on the basis of “awesome presentation”, “the demo blew us away”, or “great team” is used to measure startups. These are 20th century relics of the lack of data available from each team and the lack of comparative data across a cohort and portfolio.
Those days are over.
Hypotheses testing and data collection
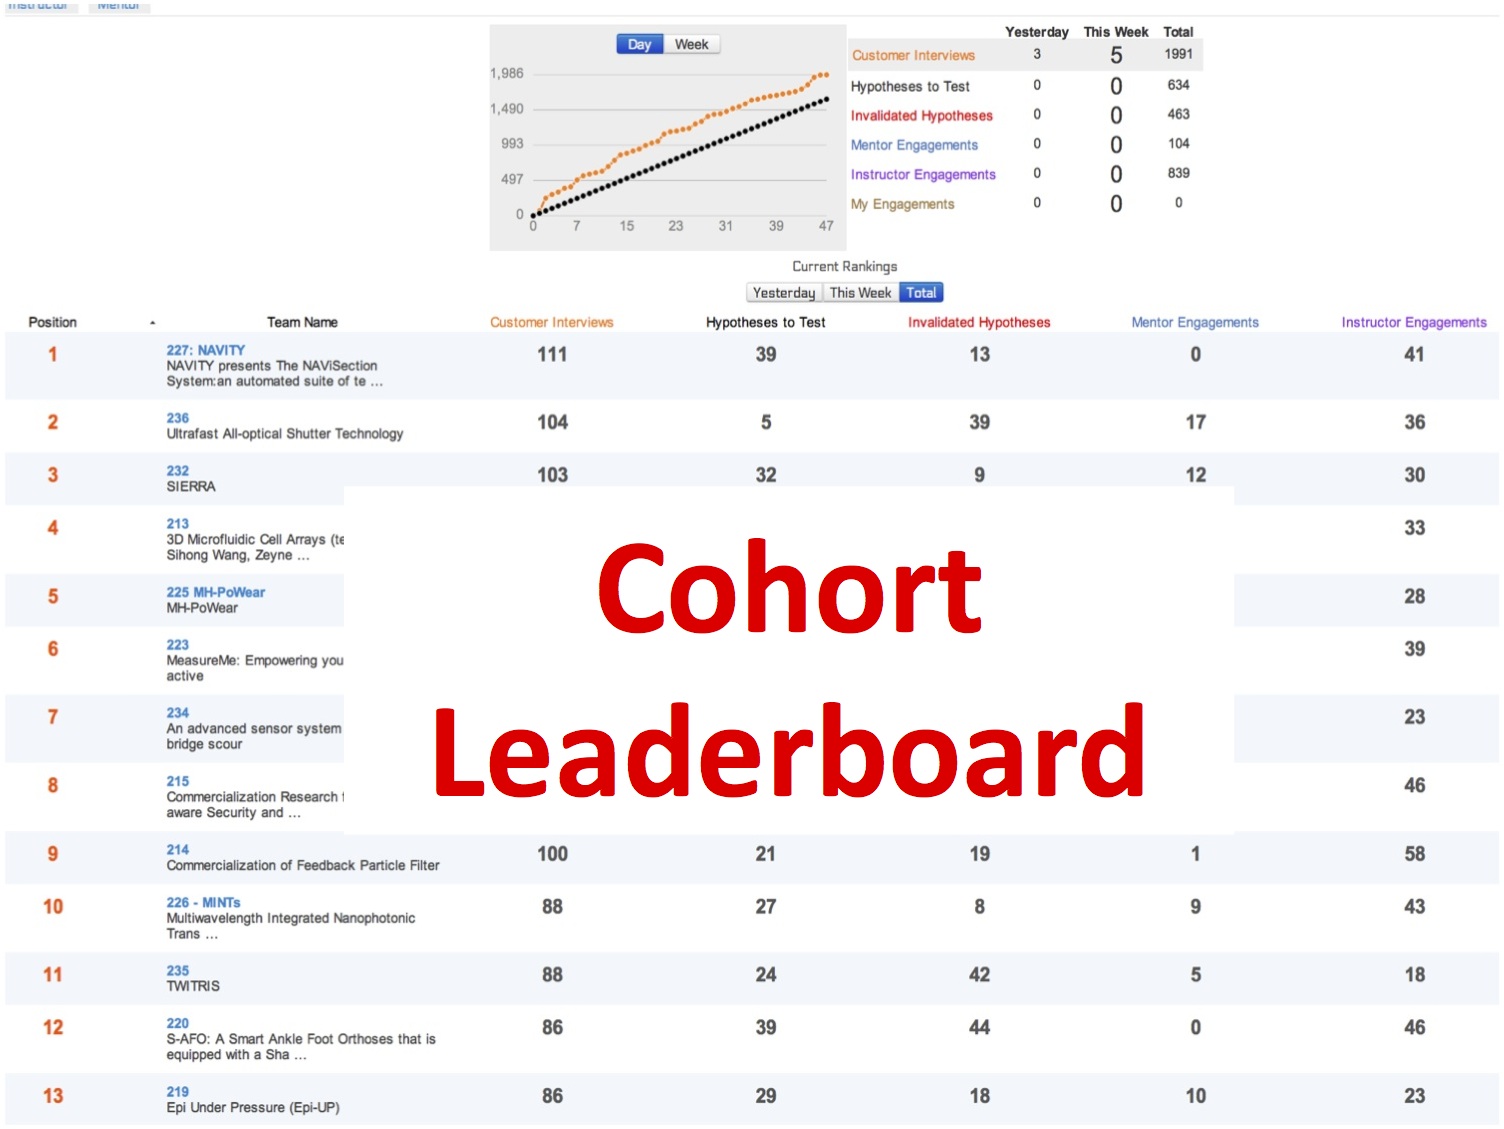
We’ve instrumented our startups in our Lean LaunchPad classes and the NSF I-Corps incubator using LaunchPad Central to collect a continuous stream of data across all the teams. Over 10 weeks each team gets out and talks to 100 customers. And they are testing hypotheses across all 9 boxes in the business model canvas.
We collect this data into a Leaderboard (shown in the figure below) giving the incubator/accelerator manager a single dashboard to see the collective progress of the cohort. Metrics visible at a glance are number of customer interviews in the current week as well as aggregate interviews, hypotheses to test, invalidated hypotheses, mentor and instructor engagements. This data gives a feel for the evidence and trajectory of the cohort as a whole and a top-level of view of each teams progress.
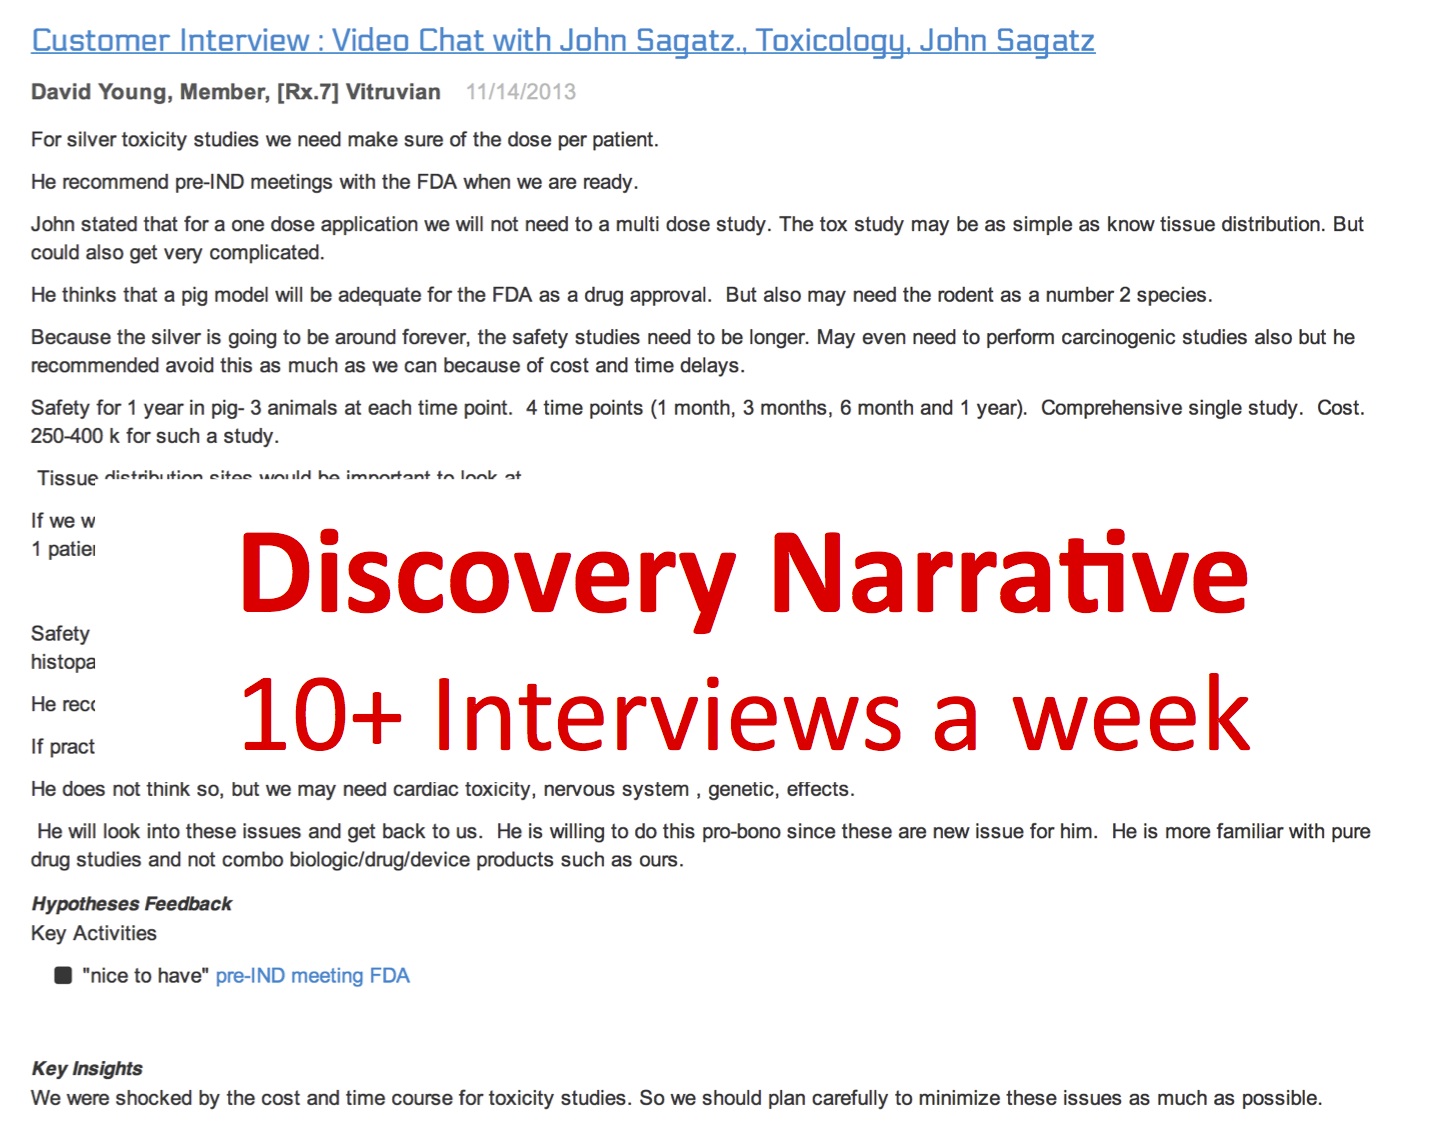
Next, we have each team update their Business Model Canvas weekly based on the 10+ customer interviews they’ve completed.
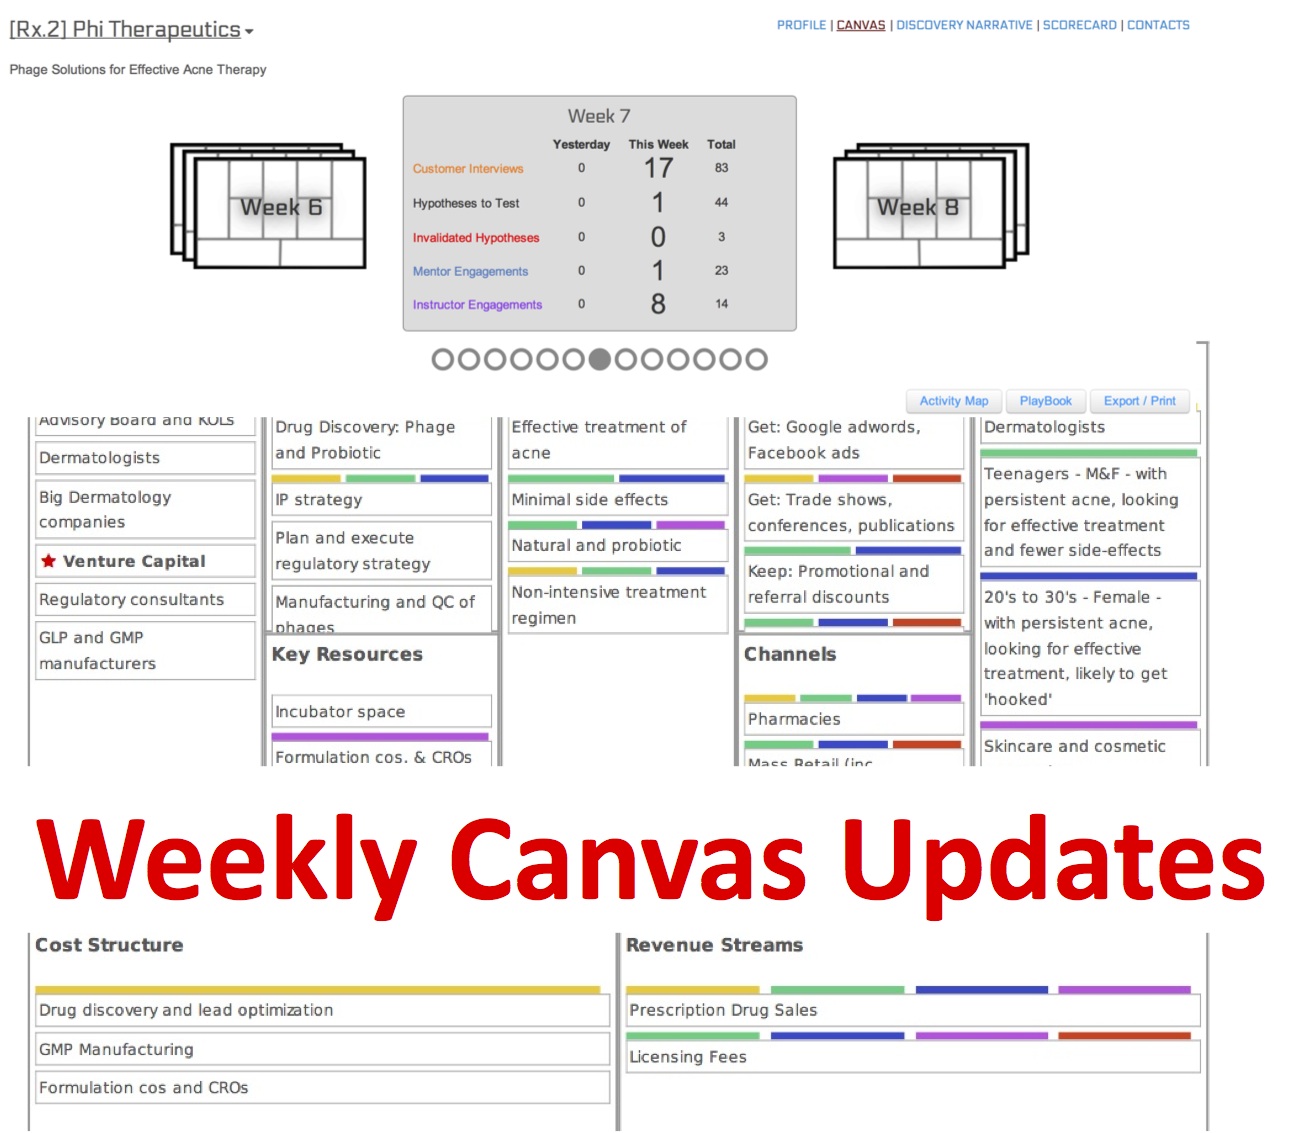
The canvas updates are driven by the 10+ customer interviews a week each team is doing. Teams document each and every customer interaction in a Discovery Narrative. These interactions provide feedback and validate or invalidate each hypothesis.
Underlying the canvas is an Activity Map which shows the hypotheses tested and which have been validated or invalidated.

All this data is rolled into a Scorecard, essentially a Kanban board which allows the teams to visualize the work to do, the work in progress and the work done for all nine business model canvas components.
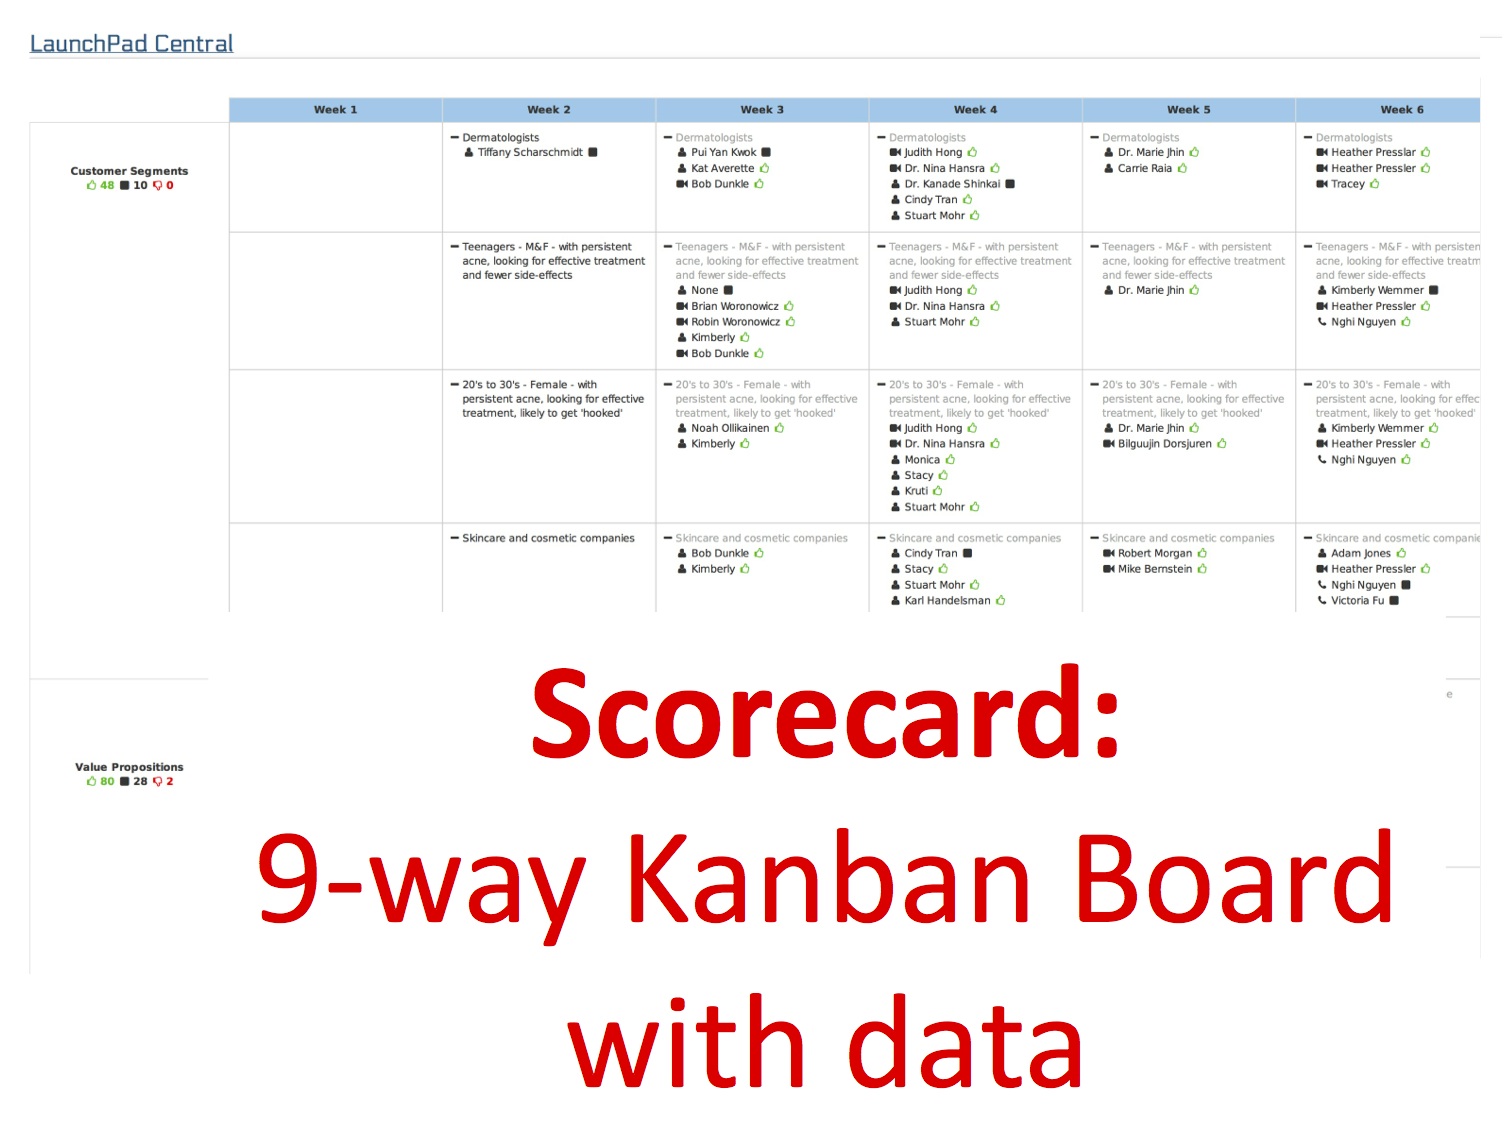
Finally the software rolls all the data into an Investment Readiness Level score.
MoneyBall
At first glance this process seems ludicrous. Startup success is all about the team. Or the founder, or the product, or the market – no metrics can measure those intangibles.
Baseball used to believe that as well. Until 2002 – when the Oakland A’s’ baseball team took advantage of analytical metrics of player performance to field a team that competed successfully against much richer competitors.
Statistical analysis demonstrated that on-base percentage and slugging percentage were better indicators of offensive success, and the A’s became convinced that these qualities were cheaper to obtain on the open market than more historically valued qualities such as speed and contact. These observations often flew in the face of conventional baseball wisdom and the beliefs of many baseball scouts and executives.
By re-evaluating the strategies that produce wins on the field, the 2002 Oakland A’s spent $41 million in salary, and were competitive with the New York Yankees, who spent $125 million.
Our contention is that the Lean Startup + Evidence based Entrepreneurship + LaunchPad Central Software now allows incubators and accelerators to have a robust and consistent data set across teams. While it doesn’t eliminate great investor judgement, pattern recognitions skills and mentoring – it does provide them the option to play Moneyball.
if you can’t see the video above click here
Last September Andy Sack, Jerry Engel and I taught our first stealth class for incubator/accelerator managers who wanted to learn how to play Moneyball.
We’re offering one again this January here.
Lessons Learned
It’s not clear there’s a correlation between a great PowerPoint presentation and two minute demo and building a successful business
We now have the tools and technology to take incubators and accelerators to the next step
We focus on evidence and trajectory across the business model
The data gathered can generate an Investment Readiness Level score for each team
the Lean Startup + Evidence based Entrepreneurship + LaunchPad Central Software now allows incubators and accelerators to play Moneyball
Filed under: Customer Development, Customer Development Manifesto, Lean LaunchPad, Teaching


November 21, 2013
When Product Features Disappear – Amazon, Apple and Tesla and the Troubled Future for 21st Century Consumers
One of the great innovations of the 21st century are products that are cloud-connected and update and improve automatically. For software, gone are the days of having to buy a new version of physical media (disks or CD’s.) For hardware it’s the magical ability to have a product get better over time as new features are automatically added.
The downside is when companies unilaterally remove features from their products without asking their customers permission and/or remove consumers’ ability to use the previous versions. Products can just as easily be downgraded as upgraded.
It was a wake up call when Amazon did it with books, disappointing when Google did it with Google Maps, annoying when Apple did it to their office applications – but Tesla just did it on a $100,000 car.
It’s time to think about a 21st Century Bill of Consumer Product Rights.
——
Amazon – Down the Memory Hole
In July 2009 facing a copyright lawsuit Amazon remotely deleted two books users had already downloaded and paid for on their Kindles. Amazon did so without notifying the users let alone asking their permission. It was a chilling reminder that when books and content are bits instead of atoms, someone can change the content – or simply disappear a book – all without users’ permission. (The irony was the two books Amazon deleted were Animal Farm and 1984.)
Google – Well It Looks Better
In July 2013 Google completely redesigned Google Maps – and users discovered that on their desktop/laptop, the new product was slower than the one it replaced and features that were previously available disappeared. The new Google Maps was worse then one it replaced – except for one key thing – its User Interface and was prettier and was unified across platforms. If design was the goal, then Google succeeded. If usability and functionality was a goal, then the new version was a step backwards.
Apple – Our Code Base is More Important than Your Features
In November 2013 Apple updated its operating system and cajoled its customers to update their copies of Apple’s iWork office applications – Pages (Apple’s equivalent to Microsoft Word), Keynote (its PowerPoint equivalent), and Numbers (an attempt to match Excel). To get users to migrate from Microsoft Office and Google Docs, Apple offered these iWorks products for free.
Sounds great– who wouldn’t want the newest version of iWorks with the new OS especially at zero cost? But that’s because you would assume the new versions would have more features. Or perhaps given its new fancy user interface, the same features? The last thing you would assume is that it had fewer features. Apple released new versions of these applications with key features missing, features that some users had previously paid for, used, and needed. (Had they bothered to talk to customers, Apple would have heard these missing features were critical.)
But the release notes for the new version of the product had no notice that these features were removed.
Their customers weren’t amused.
Apple’s explanation? “These applications were rewritten from the ground up, to be fully 64-bit and to support a unified file format between OS X and iOS 7 versions.”
Translated into English this meant that Apple engineering recoding the products ran out of time to put all the old features back into the new versions. Apple said, “… some features from iWork ’09 were not available for the initial release. We plan to reintroduce some of these features in the next few releases and will continue to add brand new features on an ongoing basis.
Did they think anyone wouldn’t notice?
Decisions like this make you wonder if anyone on the Apple executive staff actually understood that a “unified file format” is not a customer feature.
While these examples are troubling, up until now they’ve been limited to content or software products.
Tesla – Our Problems are Now Your Problems
In November 2013 Tesla, a manufacturer of ~$70,000 to $120,000 electric cars, used a software “update” to disable a hardware option customers had bought and paid for – without telling them or asking their permission.
 One of Tesla features is a $2,250 “smart air suspension” option that automatically lowers the car at highway speeds for better mileage and stability. Over a period of 5 weeks, three Tesla Model S cars had caught fire after severe accidents – two of them apparently from running over road debris that may have punctured the battery pack that made up the floor pan of the car. After the car fires Tesla pushed a software release out to its users. While the release notice highlighted new features in the release, nowhere did it describe that Tesla had unilaterally disabled a key part of the smart air suspension feature customers had purchased.
Only after most of Telsa customers installed the downgrade did Tesla’s CEO admit in a blog post, “…we have rolled out an over-the-air update to the air suspension that will result in greater ground clearance at highway speed.”
Translation – we disabled one of the features you thought you bought. (The CEO went on to say that another software update in January will give drivers back control of the feature.) The explanation of the nearly overnight removal of this feature was vague “…reducing the chances of underbody impact damage, not improving safety.” If it wasn’t about safety, why wasn’t it offered as a user-selected option? One could only guess the no notice and immediacy of the release had to do with the National Highway Safety Administration investigation of the Tesla Model S car fires.
This raises the question: when Tesla is faced with future legal or regulatory issues, what other hardware features might Tesla remove or limit in cars in another software release? Adding speed limits? Acceleration limits? Turning off the Web browser when driving? The list of potential downgrades to the car is endless with the precedent now set of no obligation to notify their owners or ask their permission.
In the 20th century if someone had snuck into your garage and attempted to remove a feature from your car, you’d call the police. In the 21st century it’s starting to look like the normal course of business.
What to Do
While these Amazon, Google, Apple and Tesla examples may appear disconnected, taken together they are the harbinger of the future for 21st century consumers. Cloud-based updates and products have changed the landscape for consumers. The product you bought today may not be the product you own later.
Given there’s no corporate obligation that consumers permanently own their content or features, coupled with the lack of any regulatory oversight of cloud-based products, Apple’s and Tesla’s behavior tells us what other companies will do when faced with engineering constraints, litigation or regulation. In each of these cases they took the most expedient point of view; they acted as if their customers had no guaranteed rights to features they had purchased. So problem solving in the corporate board room has started with “lets change the feature set” rather than “the features we sold are inviolate so lets solve the problem elsewhere.”
There’s a new set of assumptions about who owns your product. All these companies have crafted the legal terms of use for their product to include their ability to modify or remove features. Manufacturers not only have the means to change or delete previously purchased products at will, there’s no legal barrier to stop them from doing so.
The result is that consumers in the 21st century have less protection then they did in the 20th.
What we can hope for is that smart companies will agree to a 21st Century Bill of Consumer Product Rights. What will likely have to happen first is a class-action lawsuit establishing consumers’ permanent rights to retain features they have already purchased.
Some smart startups might find a competitive advantage by offering customer-centric products with an option of “no changes” and “perpetual feature rights” guarantee.
A 21st Century Bill of Consumer Product Rights
For books/texts/video/music:
No changes to content paid for (whether on a user’s device or accessed in the cloud)
For software/hardware:
Notify users if an update downgrades or removes a feature
Give users the option of not installing an update
Provide users an ability to rollback (go back to a previous release) of the software
Lessons Learned
The product you bought today may not be the product you have later
Manufacturers can downgrade your product as well as upgrade it
You have no legal protection
Filed under: Big Companies versus Startups: Durant versus Sloan, Marketing, Technology


November 18, 2013
Lean LaunchPad for Life Sciences – Revenue Streams
We’re teaching a Lean LaunchPad class for Life Sciences and Health Care (therapeutics, diagnostics, devices and digital health) at UCSF with a team of veteran venture capitalists. The class has talked to 2,056 customers to date.
Part 1: issues in the therapeutics drug discovery pipeline
Part 2: medical devices and digital health
Part 3: described what we’re going to do about it.
Part 4: a snapshot of what our teams found outside the building.
Part 5: Value proposition and customer segments in Life Sciences
Part 6: Distribution channels in Life Sciences
This post is an update of what we learned about life science revenue models.
Life Science/Health Care revenue streams differ by Category
For commercialization, the business model (Customers, Channel, Revenue Model, etc.) for therapeutics, diagnostics, devices, bioinformatics and digital health have very little in common.
This weeks topic was revenue streams – how much cash the company can generate from each customer segment. Revenue streams have two parts: the revenue strategy and the pricing tactics.
Figuring out revenue strategy starts by gaining a deep understanding of the target customer(s). Setting a revenue strategy starts with understanding the basics about the customer segments:
who’s the user, the recommender, buyer, and payer
How the target customer currently purchases goods and services and how much they currently pay for equivalent products
Their willingness to pay for value versus lowest cost?
How much budget they have for your type of product?
Revenue strategy asks questions like, “Should we offer cost-based or value-based pricing. How about demand-based pricing? Freemium? Do we price based on hardware sales or do we offer hardware plus consumables (parts that need to be disposed or replaced regularly)? Do we sell a single software package or a subscription? These strategy hypotheses are tested against the target customer segment(s).
Once you’ve established a revenue strategy the pricing tactics follow. Pricing is simply “how much can I charge for the product using the selected revenue strategy?” Pricing may be as simple as setting a dollar value for hardware or software, or as complicated as setting a high price and skimming the market or setting a low price as a loss leader.
You can get a feel for how each of the cohorts address the Revenue Streams by looking at the Revenue lectures below – covering the therapeutics, diagnostics, devices and digital health cohorts.
At the end of the lectures you can see a “compare and contrast” video and a summary of the differences in distribution channels.
Diagnostics
Week 5 Todd Morrill Instructor
If you can’t see the presentation above click here
Digital Health
Week 5 Abhas Gupta Instructor
If you can’t see the presentation above click here
Devices
Week 5 Allan May Instructor
If you can’t see the presentation above click here
Therapeutics
Week 5 Karl Handelsman Instructor
If you can’t see the presentation above click here
Life Science and Health Care Differences in Revenue Streams
”
This weeks lecture and panel was on Revenue; how much cash the company can generate from each customer segment – and the strategy and tactics to do so. Therapeutics, diagnostics, devices and digital health use different Revenue Strategies and Pricing Tactics, in the video and the summary that follows the instructors compare and contrast how they differ.
If you can’t see the video above click here
Therapeutics (Starting at 0:30)
Therapeutics revenue is from drug companies not end users
18 months to first revenue from a deal
Predicated on delivering quality data to a company
Deal can be front-end or back-end loaded
Quality of the data has to be extremely high for a deal
Diagnostics (Starting at 4:10)
Diagnostic revenue is from end users: a hospital or clinical lab
You need to figure out value of your product but…
Pricing is capped by your reimbursement (CPT) code limits
Reimbursement strategy is paramount, design to good codes avoid bad ones
Find a reimbursement code consultant
Don’t do cost-based pricing… go for value-based pricing
Medical Devices (Starting at 8:23)
There really is no such thing as a perfect First Generation Medical Device
So Medical Device companies often start with a Volkswagen product and then build to the Ferrari product
Revenue models are typically direct product sales
Don’t do cost-based pricing… go for value-based pricing, especially where your device lowers the treatment costs of the patient
In most cases, pricing is capped by your reimbursement (CPT) code limits
Or pricing can be capped by what competitors offer, unless you can demonstrate superior cost savings
In a new market there is no reimbursement code but if you show high cost-savings you can get a high reimbursement rate
A risk in device hardware is getting trapped in low-volume manufacturing with low margins and run out of cash
Digital Health (Starting at 10:35)
Digital Health revenue models are often subscription models to a company per month across a large number of users
Intermediation fees – where you broker a transaction – are another source of revenue (i.e. HealthTap)
Advertising is another digital health revenue model, but requires at least 10 million users to have a meaningful model, but can be lower if you have higher value uses like specialist physicians because you can charge dollars not cents
Don’t do cost-based pricing… go for value-based pricing
Value-based pricing is based on the needs you’ve learned from the customer segment and the strength of your product/market fit
the sum of customer needs + product/market fit = the pricing you can achieve
Lessons Learned
Each of these Life Science domains has a unique revenue strategy and pricing tactic
In therapeutics revenue comes in lump milestone payments from drug companies based on quality data
Diagnostics revenue comes value pricing to hospital or clinical lab
capped by reimbursement (CPT) code limits
Device pricing starts by offering an initial value-priced base product and then following up with a fully featured product
capped by reimbursement (CPT) code limits
Digital health products use subscription value pricing. Alternatively may use advertising revenue model
Filed under: Life Sciences, National Science Foundation, Teaching


November 13, 2013
Well They “Should” be Our Customers
When scientists and engineers who’ve been working in the lab for years try to commercialize their technology they often get trapped by their own beliefs - including who the customers are, what features are important, pricing etc.

——–
One the key tenets of the Lean LaunchPad class is that every week each team gets out of the building and talks to 10+ customers/partners to validate a new part of their business model. Back in class they present their findings to their peers and teaching team in a 10 minute Lessons Learned presentation. One of the benefits of the class is that the teams get immediate unvarnished feedback on their strategy.
For researchers and clinicians who’ve been working on a project in the lab for years, getting out of the building and talking to customers at times creates cognitive dissonance. While they’ve been in the lab they had a target customer in mind. However when they leave the building and start talking to these supposed customers there’s almost always a surprise when the customer is not interested in the product.
Often when they consistently hear that their expected customers aren’t interested the first reaction is “the customers just don’t get it yet.” Rather than testing a new customer segment they keep on calling on the same group – somehow thinking that “we just need to explain it better.”
Some times it takes a nudge from the teaching team to suggest that perhaps looking at another customer segment might be in order.
They Should be Our Customers
The Mira Medicine Team is trying to accelerate the path to the right treatment for each patient in complex Central Nervous System diseases. They spent years building their first tool MS Bioscreen, which was developed for the physicians at the UCSF Dept of Neurology. So they naturally believed that their first customers would be neurologists.
This was a very smart team who ran into the same problem almost every smart researcher attempting to commercialize science faces. Here’s what happened.
If you can’t see the video click here.
Listen for:
0:35 “Our primary customer we built this app for was neurologists…
1:00 “(but neurologists have told us) your prototype is interesting… and probably some features are nice to haves…
2:26 “What’s special about neurology? Doesn’t cardiology and oncology have problems like this?
3:00 “Is neurology a key component of what you’re trying to do?
3:15 “I’ve worked on this for two years…”
3:24 “You’ve already done too much prototyping work. You’re hung up on the prototype.”
3:29 “You have a square peg you’er trying to jam in a round hole…”
3:43 “Don’t be afraid to think laterally”
Postscript: 70 customers later they no longer talking to neurologists.
Lessons Learned
Don’t get trapped by your own beliefs
When reality outside the building doesn’t match your hypotheses – test alternate hypotheses
Most of the time your vision is just a hallucination
Filed under: Lean LaunchPad, Life Sciences, Teaching


November 11, 2013
Lean LaunchPad for Life Sciences – Distribution Channels
We’re teaching a Lean LaunchPad class for Life Sciences and Health Care (therapeutics, diagnostics, devices and digital health) at UCSF with a team of veteran venture capitalists. The class has talked to 1,780 customers to date.
Part 1: issues in the therapeutics drug discovery pipeline
Part 2: medical devices and digital health
Part 3: described what we’re going to do about it.
Part 4: a snapshot of what our teams found outside the building.
Part 5: value proposition and customer segments in Life Sciences
This post is an update of what we learned about life science distribution channels.
Life Science/Health Care distribution channels differ by Category
It turns out that for commercialization, the business model (Customers, Channel, Revenue Model, etc.) for therapeutics, diagnostics, devices, bioinformatics and digital health have very little in common.
This weeks topic was distribution channels; how your product gets from your company to your potential customer segments. You can get a feel for how each of the cohorts address the channel by looking at the distribution channel lectures below – covering the therapeutics, diagnostics, devices and digital health cohorts.
At the end of the lectures you can see a “compare and contrast” video and a summary of the differences in distribution channels.
Diagnostics
Week 3 Todd Morrill Instructor
If you can’t see the presentation above click here
Digital Health
Week 3 Abhas Gupta Instructor
If you can’t see the presentation above click here
Devices
Week 3 Allan May Instructor
If you can’t see the presentation above click here
Therapeutics
Week 3 Karl Handelsman Instructor
If you can’t see the presentation above click here
Life Science and Health Care Differences in Distribution Channels
This weeks lecture and panel was on distribution channels; how your product gets from your company to your potential customer segments. Therapeutics, diagnostics, devices and digital health use different different channels, in the video and the summary that follows the instructors compare and contrast how they differ.
If you can’t see the video above click here
Medical Devices (Starting at 0:50)
Medical Device Distribution Channels in general are a sales team hired directly by the company.
A sales team typically includes a sales person and clinical applications specialists.
The specialists help train and educate physician users. They assist with the sale and work with marketing to create demand.
Some device industries are controlled by distributors (indirect sales.)
Distributors tend to resell commodity products from multiple suppliers.
Channel Cost = $350-400,000 per sales team. On average there’s 1 clinical applications specialist to 2 salespeople. A lean rollout for a startup would be 4-5 sales people plus 2-3 clinical applications specialists at a cost of ~$2.5 million/year
Increasing the number of sales people much past 4-5 for a rollout does not proportionally increase revenue in most cases, because you are on the front end of early adopters and wrestling to overcome and reduce the sales learning curve
Travel and Entertainment is a big part of the sales budget since they are all flying weekly to cover accounts
90-180 days for salespeople to become effective
Expect little or no revenue for 2- 3 quarters after they start
Major reason for failure = hiring sales and marketing staff too quickly
Generally an Educational Sale - Hire sales and clinical people first to help early adopters, such as Key Opinion Leaders (KOL’s), master the learning curve with your device so they can write and present papers to influence their peers
Diagnostics (Starting at 5:16)
Diagnostic Channels = Direct sales in the US, with limited Distributor options
Many Distributors in Europe and in Asia
Sold to hospital laboratories, reference laboratories, or performed in CLIA labs
Channel Cost = $350,000+ per supported salesperson
Direct to consumer is a (rapidly) growing channel
Digital Health (Starting at 7:25)
Digital Health Channels = Direct Sales but you’re selling software to both end users and enterprises
Can use existing tech channels and new emerging channels such as Wellness platforms. (Audax Health, Humana Vitality, ShapeUp, Redbrick Health, Limeade)
Cloud-based Electronic Medical Records (EMR) are quickly becoming another distribution platform
App Stores, and Box are also channels for consumers and enterprise customers, respectively
Therapeutics (Starting at 10:17)
Therapeutics Channel = what you’re selling in the early stage is data and Intellectual Property to the pharmaceutical and biotech companies
Complicated Sales process – takes 18 months
Led by the CEO with a dedicated business development person and your science team
You need to define the data they need – this is influenced by how they view their pipeline, and how your technology can fill gaps in their pipeline
Pharmaceutical and biotech companies have therapeutics heads, technology scouts and business development people all searching for technology deals to fill their pipeline
This is a bound problem – there’s probably 80 people you need to know that make up your channel
Lessons Learned
Each of these Life Science domains has a unique distribution channel
In Devices innovative products require hiring direct sales people
but for commodity device products you may use a distributor
Diagnostics requires a direct sales force in the U.S.
Distributors in Europe and in Asia
In Digital Health direct sales is a possible channel, as are traditional software channels (App Stores, Box, etc.)
other DHealth channels such as Wellness Platforms, and cloud-based EMR’s are also emerging
In therapeutics it’s a direct sale of data and Intellectual property
led by the CEO with a dedicated business development person and your science team
Filed under: Lean LaunchPad, Life Sciences, Teaching


November 8, 2013
A New Way to Look at Competitors
Every startup I see invariably puts up a competitive analysis slide that plots performance on a X/Y graph with their company in the top right.
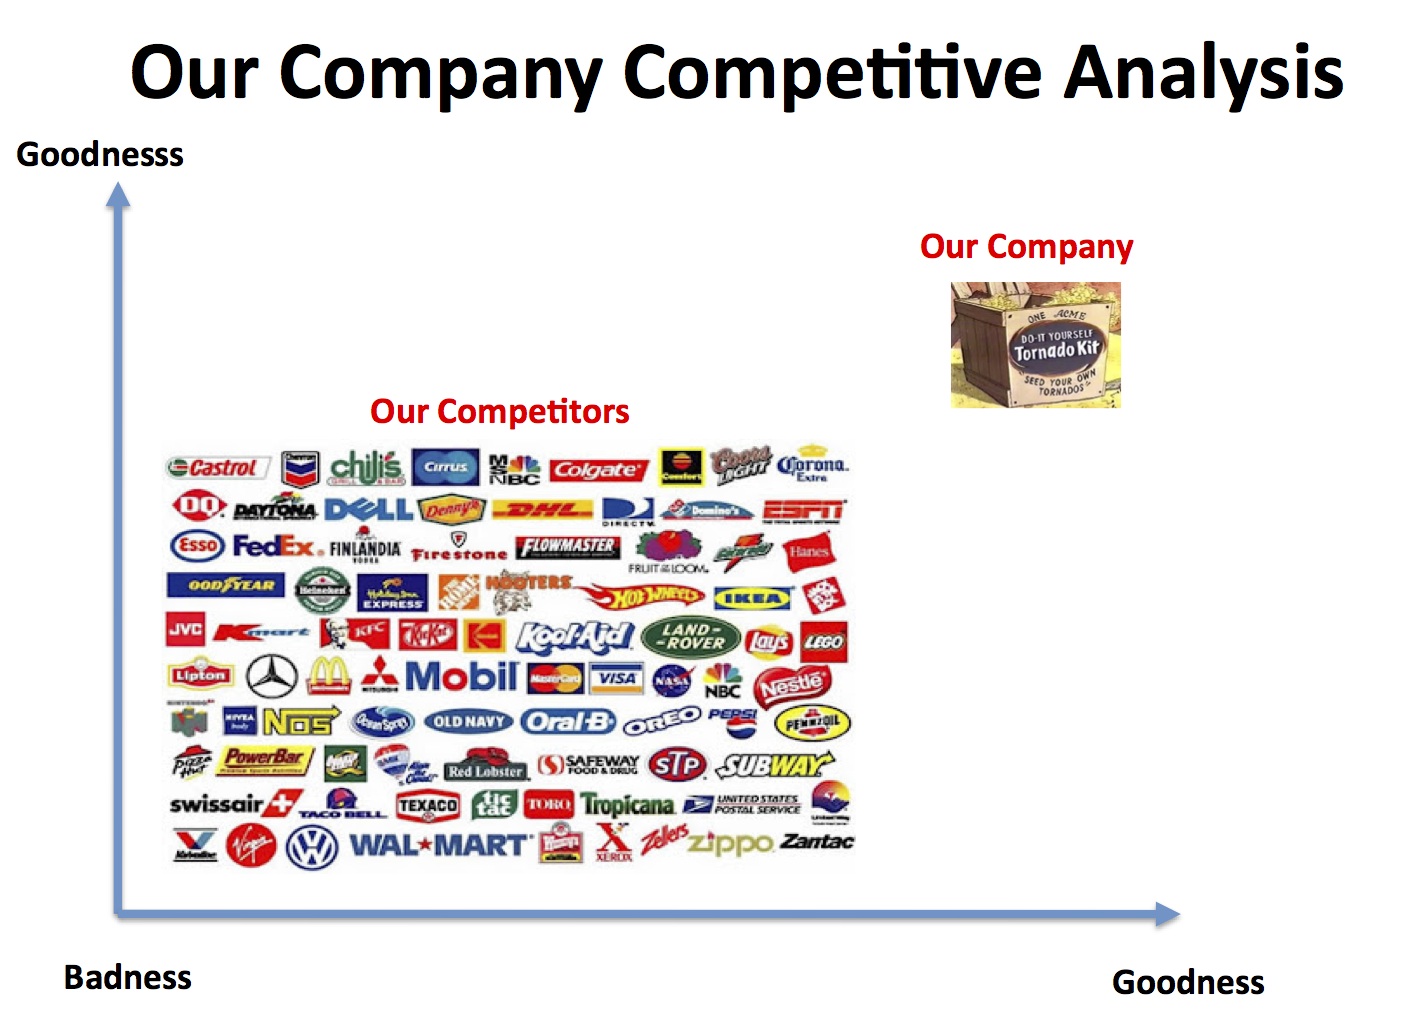
The slide is a holdover from when existing companies launched products into crowded markets. Most of the time this graph is inappropriate for startups or existing companies creating new markets.
Here’s what you need to do instead.
——-
The X/Y axis competitive analysis slide is a used by existing companies who plan to enter into an existing market. In this case the basis of competition on the X/Y axes are metrics defined by the users in the existing market.
This slide typically shows some price/performance advantage. And in the days of battles for existing markets that may have sufficed.
But today most startups are trying to ressegment existing markets or create new markets. How do you diagram that? What if the basis of competition in market creation is really the intersection of multiple existing markets? Or what if the markets may not exist and you are creating one?
We need a different way to represent the competitive landscape when you are creating a business that never existed or taking share away from incumbents by resegmenting an existing market.
Here’s how.
The Petal Diagram
I’ve always thought of my startups as the center of the universe. So I would begin by putting my company in the center of the slide like this.
 In this example the startup is creating a new category – a lifelong learning network for entrepreneurs. To indicate where their customers for this new market would come from they drew the 5 adjacent market segments: corporate, higher education, startup ecosystem, institutions, and adult learning skills that they believed their future customers were in today. So to illustrate this they drew these adjacent markets as a cloud surrounding their company. (Unlike the traditional X/Y graph you can draw as many adjacent market segments as you’d like.)
 Then they filled in the market spaces with the names of the companies that are representative players in each of the adjacent markets.
Then they annotated the private companies with the amount of private capital they had raised. This lets potential investors understand that other investors were interested in the space and thought it was important enough to invest. (And plays on the “no VC wants to miss a hot space” mindset.)
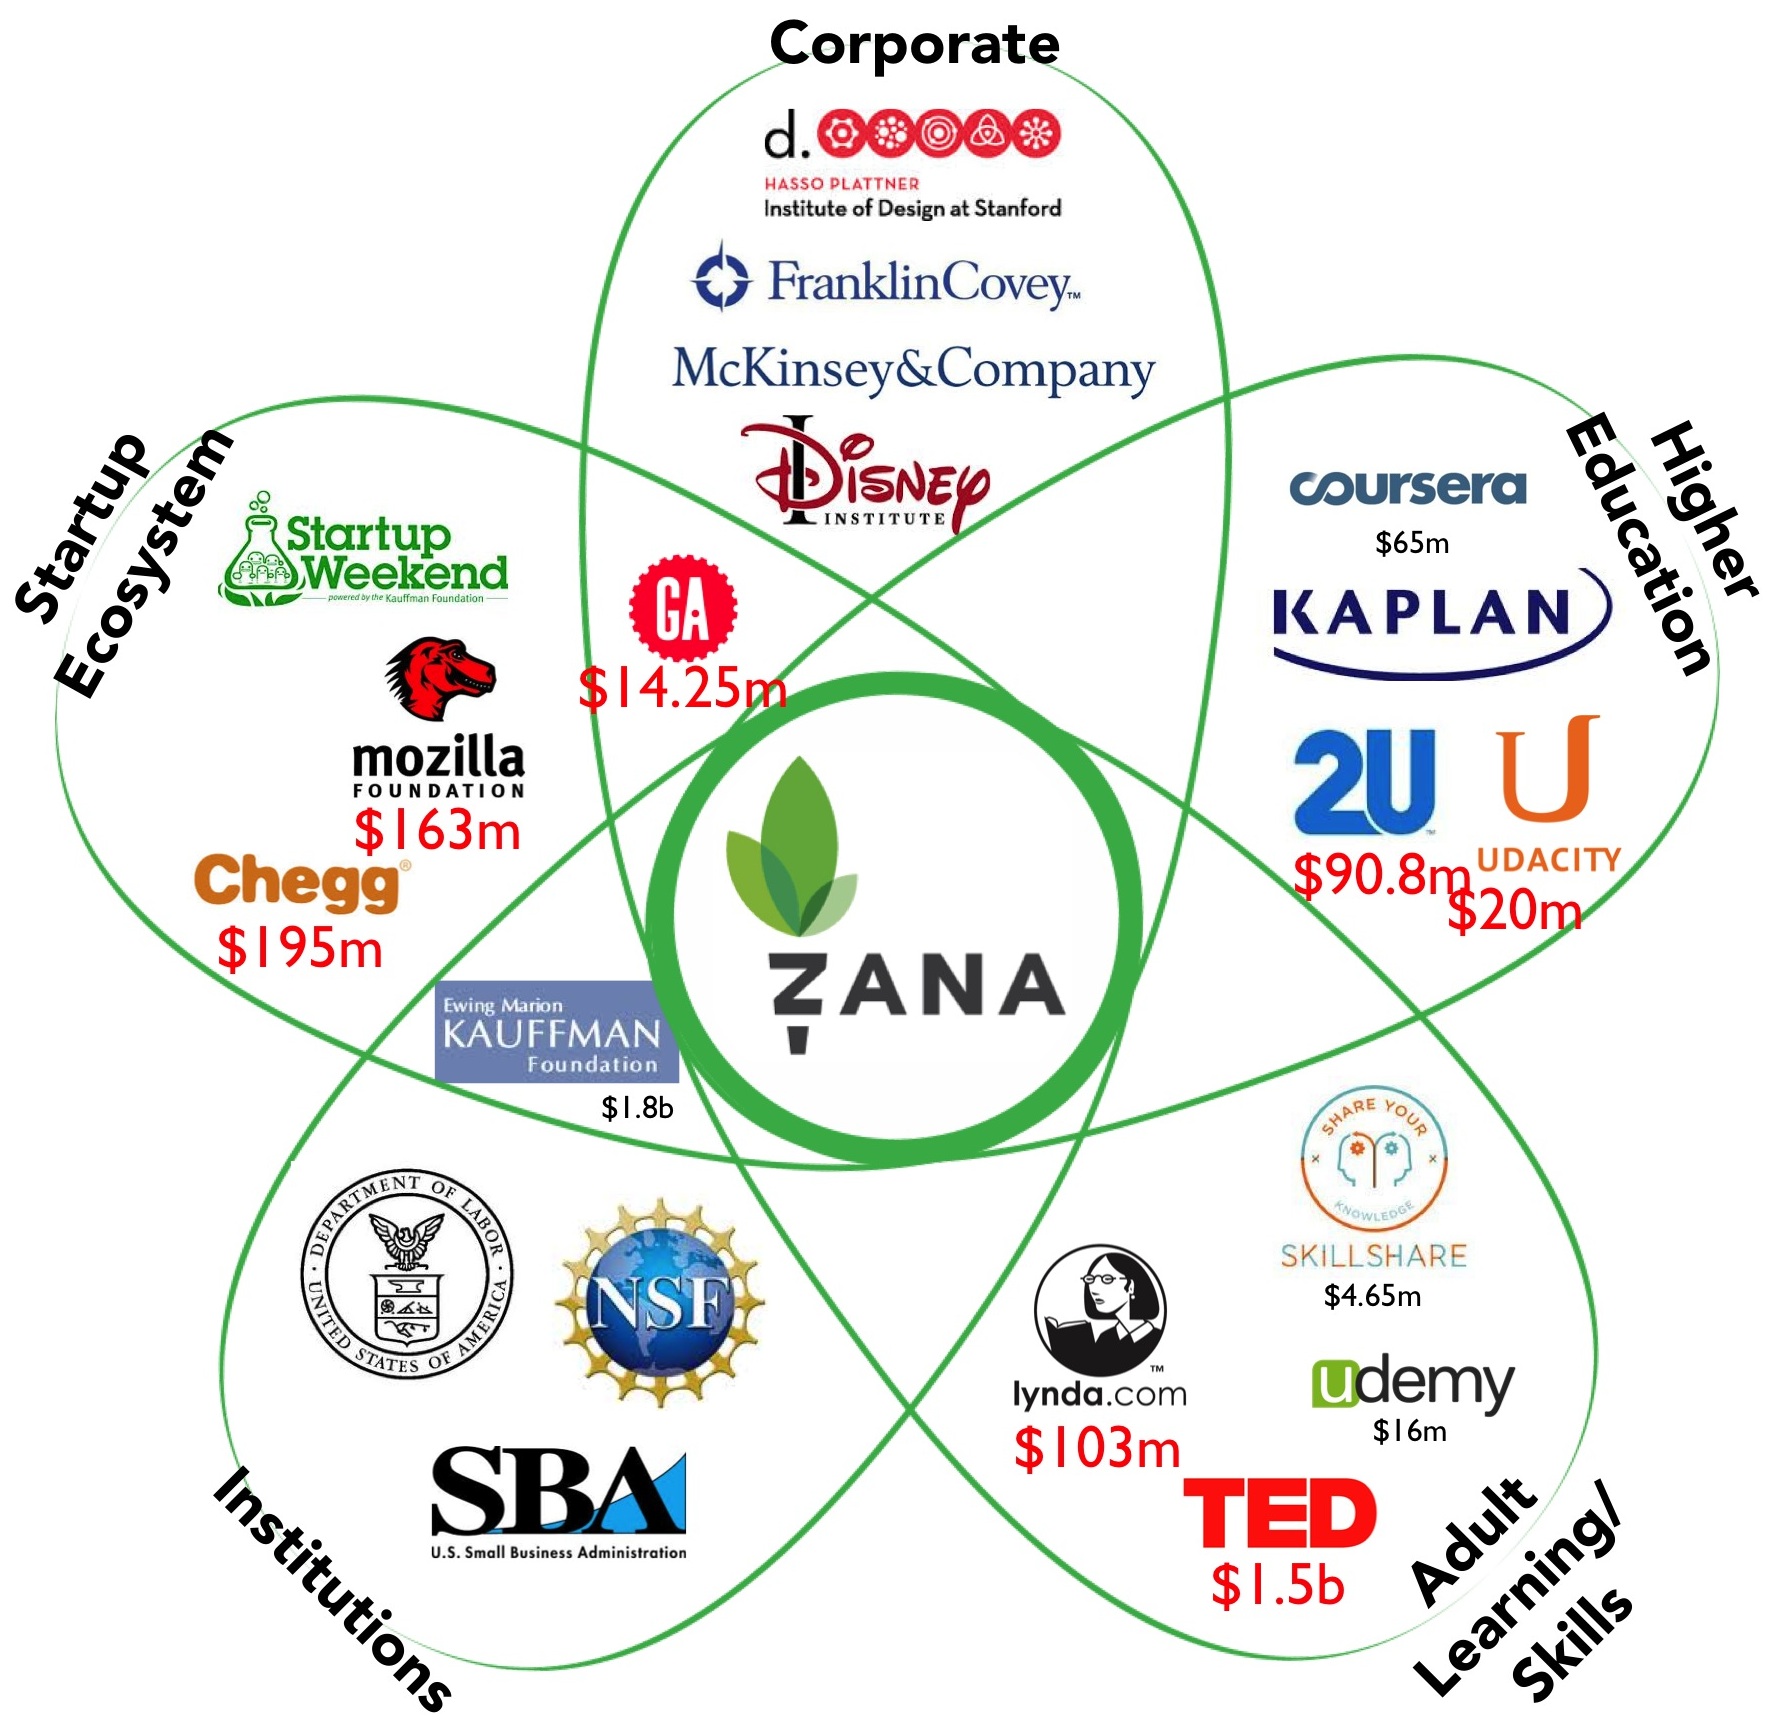
Finally, you could show the current and projected market sizes of the adjacent markets which allows the startups to have a ”how big can our new market be?” conversation with investors. (If you wanted to get fancy, you could scale the size of the “petals” relative to market size.)
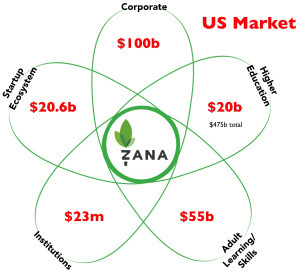
The Petal Diagram drives your business model canvas
What the chart is saying is, “we think our customers will come from these markets.” That’s handy if you’re using a Lean Startup methodology because the Petal Chart helps you identify your first potential customer segments on the business model canvas.
You use this chart to articulate your first hypotheses of who are customers segments you’re targeting. If your hypotheses about the potential customers turn out to be incorrect, and they aren’t interested in your product, then you go back to this competitive diagram and revise it.
Lessons Learned
X/Y competitive graphs are appropriate in an existing market
Mapping potential competitors in new or resegmented markets require a different view – the Petal diagram
The competitive diagram is how develop your first hypotheses about who your customers are
Filed under: Customer Development, Teaching, Venture Capital


November 7, 2013
Lean Goes Better with Coke – the Future of Corporate Innovation
In 2012 I got together with Alexander Osterwalder, Henry Chesbrough and Andre Marquis to think about the Lean and the future of corporate innovation. We had some radical thoughts how companies were going to have change to remain competitive in the 21st century in a blog post. What we didn’t envision was that one creative corporate VP would take that post and build a world-class corporate innovation program around it.
David Butler is the VP of Innovation and Entrepreneurship of at The Coca-Cola Company – responsible for finding breakthrough innovation and building an entrepreneurial culture. Here’s how he’s shaping the future of corporate innovation.
![]() ————–
————–
Innovation isn’t the destination it’s the Journey. What CEOs, management teams and shareholders care about is growth—revenue growth, greater user adoption, increased market share, bigger margins, etc. So the first step for any corporate “innovation” organization is to tie the word, “innovation,” to the more tangible concept of “growth.” That single step can create a lot of clarity and direction for the organization.
Breakthrough Innovation.” Innovation can create 2 kinds of growth: sustaining innovation (small and incremental growth yet predictable) and disruptive innovation (explosive exponential growth yet highly uncertain). Like most big companies, we’re pretty good at the kind of innovation that creates incremental growth. We know how to fund it, how to staff it, how to measure it, etc.
For the past year or so, we’ve been focused on disruptive “breakthrough” innovation (game-changing, etc.) to create exponential growth.
Innovation sounds easy. It never is. In our case, we’re local in over 200 countries with operations in basically every city on the planet. We have a portfolio of more than 500 brands and 4000 products and people invite us into their lives more 1.8 billion times a day. Our market cap is around $170B. For most big, established companies like us, our business models were developed years—even decades ago. We’ve built up strength in executing our business model, not creating new ones. So, if you’re Coca-Cola, where do you begin?
It didn’t take us very long to connect the dots between exponential growth, business model innovation and the “Lean Startup” movement. The Lean Startup movement is almost a decade old now and it’s now easier than ever for anyone to learn “Lean Startup” methods and become more entrepreneurial. In fact, I believe the movement is now mainstream—startups, VCs, accelerators, are no longer “new.”
There are co-working spaces in basically every city in the world—from Nepal to New York. Almost every large organization has some kind of incubator or accelerator program. And this has created a global entrepreneurial ecosystem.
But most big companies are still in the shallow-end of the entrepreneurial ecosystem pool. And this is ironic because big companies have so much to add. Big companies know how to scale—most have a lot to learn about starting (as in Lean Startup) but they know how to leverage assets, use network effects, plan and execute. Big companies with big brands have a lot to learn from startups but together, they can do things neither one of them could do alone. And that has become our vision—to make it easier for starters to be scalers and scalers to be starters.
So this is where my head was when I read Steve’s “The Future of Corporate Innovation and Entrepreneurship” post last year. At the time, we were definitely in the shallow-end. Now, a year later, (and A LOT of learning), we’re moving into the deep-end and Steve’s 8 strategies are more relevant than ever. Based on our experience, here’s are our Lessons Learned from Steve’s 8 corporate innovation strategies and then four more from Coke for consideration:
Lessons Learned
21st century corporate survival requires companies to continually create a new set of businesses by inventing new business models . What is sometimes missed is the opportunity for big companies to leverage their enormous assets (brands, relationships, routes-to-market, etc.) in developing these new models. Most startups can only dream of the kinds of assets most big companies have.
We believe that using the customer development process to monetize these assets through new business models can create huge competitive advantage and more speed to market for us and other big companies.
Most of these new businesses need to be created outside of the existing business units. We’ve found that this can only happen if it’s just on the edge of a business unit. Startups need to be close enough to the BU to validate assumptions and leverage BU resources (people, funding, relationships, etc.) but just far enough out to be able to use different processes and systems to move fast, pivot, etc. But there’s no one-size fits all approach to this—every company will have to figure out what works for them.
The exact form of the new business models is not known at the beginning. It only emerges after an intense business model design and search activity based on the customer development process. This is so true but so foreign for most big companies. And why wouldn’t it be? All of their internal systems are designed to keep doing what they’ve always done best. They are also under huge pressure to deliver quarterly earnings for shareholders and meet analysts expectations. Using an alternative process including different systems and metrics is key.
Companies will have to maintain a portfolio of new business model initiatives, not unlike a venture capital firm, and they will have to accept that maybe only 1 out 10 initiatives might succeed. We’re hoping for 1 out of 10 but hedging our bets by launching and networking “Accelerators” around the world in both developing and developed economies—from Bangalore to Buenos Aires. We call this our Accelerator Program but our goal is to create new startups, not really invest in existing startups like most traditional accelerator programs. When we need to mash-up with a startup to do something neither of us could do alone, we’re doing that but or goal is to really build new companies.
To develop this new portfolio, companies need to provide a stable innovation funding mechanism for new business creation, one that is simply thought of as a cost of doing business. Absolutely, but it’s not just about a new “innovation” fund—that’s almost the easy part. The hard part is designing all of the systems to enable the success of the startups. From Tax to Legal to Finance to HR, designing the new systems requires enormous amount of collaboration, transparency and trust.
Many of the operating divisions can and should provide resources to the new businesses inside the company. That’s the only way this works. Everybody has to have “skin-in-the-game.” But again, when you get this right, it can create enormous engagement and excitement inside the Business Unit and across the company.
We need a new organizational structure to manage the creation of new businesses and to coordinate the sharing of business model resources. Again, absolutely true. But in our case, creating the new structure and systems has been almost like starting a startup. Pitching to senior management, using minimum viable products (MVPs), validating assumptions through lots and lots of testing, pivoting hard when you need to—all of this is required in setting up the structure and systems to do this inside of a big company.
Some of these new businesses might become new resources to the existing operating units in the company or they could grow into becoming the new profit generating business units of the company’s future. We’re betting on the latter. Our goal is to create new, high-growth companies outside of the NARTD industry (non-alcoholic ready-to-drink) through this program. We have literally hundreds of thousands of people focused on our core business. We’re hoping to use this opportunity to leverage our assets in new, fast-growing industries.
In building capability, the company should look for “starters,” not “scalers.” Starters have a completely different mindset and skills than scalers have. We found we needed to hire expert starters—people who knew how to bootstrap, build MVPs, find a free or very low-cost way of testing a hypothesis, pitch, pivot, etc. We also learned that creating the same kinds of conditions that enable co-founders to thrive on the “outside” is very important to maintain on the “inside.” We had to design a whole new hiring process, compensation model, operating model, co-working spaces, etc. to find, attract and retain “starters.”
But it’s not only about creating new revenue streams—creating new behaviors across the company’s culture is key. Getting everyone on the same page with the same language and familiar with new methods and tools is key to making this stick. So along with our Accelerator Program, we’ve also introduced a new “ Open Entrepreneurship ” program to give everyone inside our company the opportunity to learn Lean Startup methods and tools. This is what we mean by making it easier for “scalers” to be “starters.”
Finding the balance between transparency and opacity is critical. Inside the company, the person or team or group that’s been asked to lead this effort must be completely transparent—function agnostic, open, inclusive, freely sharing everything. This is so new for everyone involved, that there can’t be any kind of “black box” or “cool club” perception around this or it won’t work. On the flip side, just like it is for every startup, there is so much iteration, learning, testing, etc. going on that even if you wanted to talk about what you’re doing in detail, it would sort of depend on the day as things change so frequently. We’ve found it best to take a “more is more” approach internally and a “less is more” approach externally.
Nobody, no matter how smart they are, can do this alone. Forming informal networks, both internally and externally, is key. It’s really important for the co-founders of the internal startups to build relationships across the company. And in the same way it’s equally important for the company to authentically connect with the startup community. Being very open and honest with what they’re trying to do is key. And we’ve found that once we built this bridge, we’ve been able to count on a lot of help from the startup community (and visa versa). And as the relationship grows, so does the trust.
These are still early days for us at Coke and we have a lot to learn. But we feel that if we and other big companies can get this right, it could be really big.
Filed under: Big Companies versus Startups: Durant versus Sloan, Customer Development


November 4, 2013
Lean LaunchPad for Life Sciences – Value Proposition and Customers
We’re deep into teaching a Lean LaunchPad class for Life Sciences and Health Care (therapeutics, diagnostics, devices and digital health) at UCSF with a team of veteran venture capitalists. (The class has talked to 1,440 customers to date.)
One of the objectives of the class was to become the Life Science Center of Excellence for the National Science Foundation Innovation Corps. This meant capturing domain specific commercialization expertise for therapeutics, diagnostics, devices and digital health so others can teach this.
Part 1 of this post described the issues in the therapeutics drug discovery pipeline. Part 2 covered medical devices and digital health. Part 3 described what we’re going to do about it. Part 4 gave a snapshot of what one our teams found the first week outside the building.
This is an update of our progress.
It Takes A Village
We’re teaching 110 students in 28 teams across therapeutics, diagnostics, devices and digital health. Teams are made up of clinicians, researchers, and post docs, (some of the team members include the Chief of UCSF General Surgery, the inventor of Fetal Surgery, etc.)
Each of the four cohorts is taught by an experienced life science venture capitalist. Alan May for devices, Karl Handelsman for therapeutics Abhas Gupta for digital health and Todd Morrill for diagnostics.
Jerry Engel and Jim Hornthal, both who taught the National Science Foundation I-Corps classes, are the senior instructors. The UCSF Office of Innovation and Technology (Erik Lium and Stephanie Marrus) is the reason the program exists.
Each of the teams is assigned a mentor to match their domainv(Head of device R&D of Phillips, Genetech, Crescendo, CTO of UCSF, venture capitalists from Sofinnova, Burrill, Lightstone, M34, etc.)
Class Organization – Lots of Moving Parts
Our class meets weekly. We first meet as one group and then we break out the therapeutics, diagnostics, devices and digital health into their own cohorts. The teams present what they learned talking to 10-15 customer/week, and get comments, suggestions and critiques from their teaching team. The instructor then presents a cohort specific lecture explaining how the business model for their area (therapeutics, diagnostics, devices and digital health) builds on and/or differs from the canonical business model in the online Udacity lectures (which the students had to watch as homework.)
We get back together as one group and the instructors share what they learned as they compare and contrast the differences between therapeutics, diagnostics, devices and digital health. We’ve recorded these panels for each part of the business model canvas.
The framework of the class looks like this:

Life Science/Health Care is not a single Category
One of the reasons I teach is because of how much I learn. One of early surprises of this class for me is finding out that the broad category of “Life Sciences” fails to provide the important nuances of each category to entrepreneurs, investors, educators, policy makers, etc. It turns out that for commercialization, the business model (Customers, Channel, Revenue Model, etc.) for therapeutics, diagnostics, devices, bioinformatics and digital health have very little in common.
You can get a feel for how different by looking at the first two weeks of lectures – covering value proposition and customer segment – from each of the therapeutics, diagnostics, devices and digital health cohorts.
Then at the end of the lectures you can see a “compare and contrast” video and a summary of the differences.
Diagnostics
Week 1 Todd Morrill I nstructor
If you can’t see the presentation above click here
Week 2 Todd Morrill Instructor
If you can’t see the presentation above click here
Digital Health
Week 1 Abhas Gupta Instructor
If you can’t see the presentation above click here
Week 2 Abhas Gupta Instructor
If you can’t see the presentation above click here
Devices
Week 1 Allan May Instructor
If you can’t see the presentation above click here
Week 2 Allan May Instructor
If you can’t see the presentation above click here
Therapeutics
Week 1 Karl Handelsman Instructor
If you can’t see the presentation above click here
Week 2 Karl Handelsman Instructor
If you can’t see the presentation above click here
Life Science and Health Care Differences
Once we realized that the four cohorts of therapeutics, diagnostics, devices and digital health were so different we decided to have the instructors compare and contrast how they’re different for each part of the business model. We’ll be posting these “compare and contrast” videos for every week of the class.
If you can’t see the video above click here
Therapeutics (Starting at 0:30)
Therapeutics customer = pharma and biotech companies
Therapeutics Pain & gain = be better than what these companies have in their own drug development pipeline
Therapeutics Validation = 18 months to a first deal with a potential customer – well before FDA trials, and even before preclinical stage
Digital Health (Starting at 2:40)
Digital Health Customer = typically consumer end users
Digital Health Pain & gain = product/market fit needs to be a need, and the value proposition must address it. ”Nice to have’s” do not equal a customer need.
Digital Health Validation = large scale adoption
Medical Devices (Starting at 6:00)
Medical Device customers = short term: physicians in private practice and hospital, long term: medical device companies
Medical Device Customer Goal – figure out the Minimal Viable Product. No such thing as a perfect first generation product that targets a specific physician/customer segment.
Medical Device Validation= 95% of device startups are acquired by a medical device company, 5% build a large standalone company
Diagnostics (Starting at 10:45)
Diagnostic Customers = short term In vitro diagnostics are sold to a hospital laboratory or standalone lab, long-term you’ll be bought by Abbott, Roche, etc.
Lessons Learned
Each of these Life Science domains has a unique business model
Commercialization of therapeutics, diagnostics, devices and digital health all require the Principal Investigators / founders outside their building talking to customers, partners, regulators
Only the Principal Investigators / founders have the authority and insight to pivot when their hypotheses are incorrect
The Lean Startup process and the Lean LaunchPad class can save years in commercialization in these domains
This can be taught
Filed under: Customer Development, Life Sciences, Teaching


Steve Blank's Blog

- Steve Blank's profile
- 381 followers

