
Aaron E. Carroll's Blog, page 139
April 11, 2017
Waivers and the future of repeal and replace
Over at National Review, Yuval Levin argues that a Republican consensus over repeal and replace might slowly be emerging:
It now seems that the familiar debates about tax credits vs. deductions and even about spending levels aren’t exactly where the dividing lines are in the House conference. Rather, … the Freedom Caucus Republicans want to maximize the reversal of Obamacare’s federalization of health insurance regulation to give people more options at lower costs and the Tuesday Group Republicans want to maximize genuine access to coverage and care for everyone in the individual market. Both want a more functional, competitive, consumer-oriented health-care system. And it’s not that either group simply doesn’t care about the other’s primary emphasis, but they do seem to enter the debate with these differences of emphasis and priority. The challenge, therefore, is to maximize both at the same time.
This is good news, because both of those are crucial goals and they can actually reinforce one another. But how do you maximize both … ? I think the waiver idea is an attempt to answer that question. In effect, it says to each state government that, if it can show that Obamacare’s regulations make it too hard for its residents to have a functional individual insurance market and can demonstrate how a different regulatory architecture would better enable it to make use of whatever federal support the legislation would offer and provide more people with access to coverage and care, then it can have that different regulatory architecture. How this might be achievable will vary from state to state, and a waiver approach can make room for such variance. It will also look different to state officials with different assumptions about health economics, which this approach could allow for as well.
It’s a good piece, and I’m sympathetic to Levin’s view that shifting more regulatory authority to the states is a good idea. (Andrew Sprung, who has a detailed and insightful discussion of Oklahoma’s nascent exploration of 1332 waivers, has also explored how decentralization might play into a Republican replacement.)
But I think Levin is wrong about what really divides Republicans. Levin’s mistake—and it’s a common one—is neglecting the role that money plays in federalism. It’s fine to give the states more authority to oversee their insurance markets. But, as I explain here, states don’t have the fiscal capacity to finance massive coverage expansions on their own. They’re required to balance their budgets every year, so any commitment to covering the uninsured will throttle their budgets when the next downturn comes. At the same time, ERISA prevents them from adopting the sort of employer mandates that could improve coverage.
The states thus need federal money; it’s the lifeblood of health reform. And the real cleavage among Republicans is over how much money the federal government is willing to shell out. The Freedom Caucus wants to repeal the ACA’s taxes on industry and the wealthy, financing them with savage cuts to Medicaid and slightly less savage cuts to individual-market subsidies. The Tuesday Group likes the tax relief, but worries about the coverage losses associated with all the cuts.
It’ll take more than waivers to bridge that gap.
It’s telling, for example, that Levin doesn’t mention the Cassidy-Collins bill, which would have granted broad authority to the states to opt out of the ACA’s regulations. Cassidy-Collins was dead on arrival not because it embraced waivers, but because it would have retained the ACA’s taxes and spending. For most Republicans, that’s a deal-breaker.
It’s also telling that Levin doesn’t discuss Medicaid in the piece, even though Republicans remain divided over whether and to what extent to keep the expansion in place. Again, the problem is not opposition to more state control: House Republicans were happy to adopt an amendment allowing states to impose work requirements. The problem, instead, is that Republicans disagree about how to trade off tax relief and Medicaid cuts.
When Levin talks about a federalism-respecting solution, he seems to have in mind something that hews to the anemic spending levels in the American Health Care Act. Even with much less money, he’s optimistic that the states can achieve broad coverage by eliminating ACA regulations. Here, however, he seems to be referring exclusively to the individual market. But if you take the AHCA’s Medicaid cuts as a given, as Levin seems to, a huge increase in the number of the uninsured is inevitable.
Even just focusing on the individual market, Levin understates the effect of the AHCA cuts. Levin opines, for example, that the states might “permit catastrophic coverage plans to be sold and then require every insurer in the individual market to offer at least one ‘default’ catastrophic plan with a premium equal to the federal credit so that everyone can have at least minimal coverage and no one remains uninsured.”
Levin is right: the states could do this. But play it out. In many markets, the credits under discussion in the AHCA are too low to cover the premiums for catastrophic plans. If you’re 35 and live in Nashville, Tennessee, for example, catastrophic coverage will run you about $287 per month, or $3,450 per year. But the AHCA’s credit for someone in that age bracket is just $2,500.
Selling a catastrophic plan at the size of the tax credit will therefore require insurers to increase their deductibles. But catastrophic plans already impose deductibles of $7,150 for an individual—that’s as much as the ACA permits. With that cap on out-of-pocket spending waived, we’d likely see the proliferation of catastrophic plans with deductibles in the five digits.
That’s still “minimal coverage” in some sense. But it’s also less coverage than the ACA guarantees—and five-digit deductibles make the Tuesday Group nervous. The same goes for other regulatory changes, like paring back the essential health benefits. Fewer regulations might yield a reduction in premiums, but people’s insurance would be crappier and less comprehensive. Voters tend to get mad when you make their coverage crappier and less comprehensive.
Contra Levin, then, I don’t think the logjam among Republicans is conceptual. It’s financial. Some Republicans want to stop paying as much for health care for the poor and near-poor. Others think that’d be political suicide. No amount of waivers will get them to agree.


April 10, 2017
Birth Control Causes Depression? Not So Fast
I was on vacation and off the grid last week. So I missed posting on some stuff. Like this, which originally appeared on The Upshot (copyright 2017, The New York Times Company).
One of the biggest American public health victories of the last decade has been the record low reached in the teenage birthrate. Along with that have been lows in rates for teenage pregnancy and abortion. Most researchers believe that improved access to contraception is a large part of this success.
But news continues to focus on the concern that hormone-based contraception — like the pill or the patch — causes depression, and that this should lead us to question its wider use. A more nuanced discussion would consider both the benefits and the harms.
This issue drew widespread coverage at the end of last year with a large study published in JAMA Psychiatry. Researchers tracked all women and adolescent females (ages 15 to 34) living in Denmark from 2000 through 2014. The study found that those who used hormonal contraception had significantly higher risks of also taking an antidepressant.
The study broke down the increased relative risk for each hormonal method this way: combined oral contraceptives (23 percent), progestogen-only pills (34 percent), the patch (100 percent), vaginal ring (60 percent) and levonorgestrel intrauterine system (40 percent).
The risks were highest in adolescents and decreased as women aged. The risks also peaked six months after the start of contraception.
Needless to say, many news outlets covered this finding widely. Some portrayed it as shocking new information that should change the way we think about hormonal birth control. Others saw it as a vindication of many women who said for years that birth control had triggered their depression while scientists and doctors ignored them.
But we have to acknowledge the limitations of this type of research. It’s not a controlled trial, and it’s impossible to establish causality. Women who choose to have sex could also be more likely to consider antidepressant use. Women who are plugged in enough to the health care system to obtain hormonal contraception could be more likely to have their depression appropriately diagnosed and treated — which is a good thing.
It’s also possible that an antidepressant prescription isn’t the best measure of new-onset depression. That would require an actual diagnosis by a health care professional, and such data were not available in the Danish cohort.
Previous studies that looked at rates of severe depression did not find a correlation with hormonal birth control use. Finally, huge cohort studies using many participants are likely to find a statistically significant result even if that result is not clinically significant. This is especially true if the cohort data come from an administrative database, like the one used in this study, that has been specifically identified as problematic in prior publications.
We also have to place this study in context with others. Months earlier, a systematic review of all studies that looked at the relationship between hormonal contraception and depression was published in The European Journal of Contraception and Reproductive Health Care. The authors first noted that there were too few prospective studies. But the data that do exist show that most women don’t show any effect from hormonal birth control, or actually had their mood improve.
Adverse effects were rare, and even rarer when the contraception contained lower levels of the hormone progestin. Finally, women who have underlying mood disorders were more predisposed to have mood-related side effects, but that could be related to their choosing different types of birth control rather than the birth control itself.
When many studies do not find a connection, and then one does, that latter one does not “replace” all prior research. That study has to be weighed along with the rest. It’s also important to consider publication bias, in which a study is more likely to be published if it’s a “significant” result and if it’s newsy. In this case, the finding that common birth control causes depression is both.
But let us assume, for the sake of argument, that this most recent finding is both real and causal. Even then, we need to rely on absolute risks, not relative risks. In the Denmark study, for every 100 women who didn’t use hormonal birth control, 1.7 were later prescribed an antidepressant. For every 100 who did use hormonal birth control, 2.2 were later prescribed an antidepressant. The overall difference (0.5 percentage points) means that if this were a randomized controlled trial, we would expect that for every 200 women treated, one extra woman might need to be treated with an antidepressant.
We can also assume, though, that pretty much all of them would receive the benefit of birth control in family planning. Moreover, lest anyone forget, depression is also significantly associated with pregnancy, especially when that pregnancy is unintended.
None of this is to say that we should ignore the risk of depression. Depression is a listed side effect of birth control; it’s on the package inserts.
All drugs have side effects. The drug I take for my ulcerative colitis has a real, if small, risk of causing myelosuppression. But the benefits I receive from it simply outweigh the risks.
Women need to discuss with their physicians the potential downsides, as well as the potential upsides, of all forms of contraception. We shouldn’t ignore the potential for hormonal birth control to cause mood changes in women. We also shouldn’t pay attention only to those side effects, forgetting to place them in context with the benefits.
@aaronecarroll
Healthcare Triage: The Trump Budget and Meals on Wheels
I was on vacation and off the grid last week. So I missed posting on some stuff. Like this great HCT on Meals on Wheels. Go watch it!
This episode was adapted from a column I wrote at the Upshot. Links to further reading and references can be found there.
April 7, 2017
Block grant funding of public health insurance: the Canadian example
Speaker Paul Ryan wants to reform Medicaid by “block granting” the program, that is,
by capping federal funding and turning control of the program over to states. The aim of such reforms is to reduce federal funding over the long term, while preserving a safety net for needy, low-income Americans. An additional valuable aim of this effort has been to advance federalism by reducing the federal government’s role and giving states and governors more freedom and flexibility in managing their Medicaid programs and helping people in their states.
What are the likely consequences of block granting? Benjamin Sommers and David Naylor write in JAMA about how Canada’s joint federal/provincial funding of health care provides lessons about the likely consequences of block granting.
Canada is a single payer health care system. However, there isn’t a Canadian single payer. Rather, there is a single payer for each province: I am covered by the Ontario Health Insurance Plan (OHIP). These plans are primarily funded by provincial taxes. However, provinces also receive a health transfer from the Canadian federal government, i. e., a block grant. The provincial health insurance plans are run by provincial health ministers, not the federal minister in Ottawa.
So, does provincial autonomy facilitate experimentation and tailoring by the provinces? Sommers and Naylor think not.
there is little evidence that the alleged advantages of block grants have materialized in Canada. Advocates argue that with greater flexibility and proper incentives, states can reduce costs by improving the efficiency of care. In Canada, however, the provinces’ primary means of coping with budget pressures under block grants has been to reduce funding to hospitals and bargain harder with provincial medical associations. Ironically, then, if this scenario plays out in the United States, it would exacerbate one of the chief Republican criticisms of Medicaid — that it pays clinicians such low rates that they have reduced incentives to care for low-income patients.
Indeed, physician refusal to take Medicaid patients is one of Speaker Ryan’s central criticisms of Medicaid.
What about the effects of a block grant system on federal funding of health care?
Once block funding was initiated in 1977, health care funding became a line item in the federal budget that could be arbitrarily cut or capped for fiscal or political reasons, as opposed to a level of spending pegged to the needs and health care use of the population. Importantly, these cuts occurred under both conservative and liberal federal governments.
When the Canadian health transfer began, the federal government paid 50% of provincial costs. However, the transfer has steadily declined, until it is now about 20%. Sommers and Naylor predict that US federal block grants would also decline, and this is clearly one of Speaker Ryan’s goals.
However, Canadian health care spending per capita has not declined.
Graph from the Fraser Institute.
As the cost of providing care has risen, but the federal health transfer has stayed fixed or declined, the provinces have taxed more and the federal government has taxed less. The provincial governments hate this, because they would rather have the federal government make the unpopular choice to raise taxes. But it’s not clear whether block granting has made a big difference in the health care received by Canadians.
American states could similarly increase taxes in response to a declining federal Medicaid block grant, but would they? The key difference between Canadian public health insurance and Medicaid is that the former is universal, while the latter is means-tested. Ontarians prefer lower taxes, but if Ontario decreases funding for OHIP, every Ontarian will experience longer waits for care. But American states can cut Medicaid — and reduce taxes — without affecting the health care of better off and able-bodied citizens.
The affluent and able-bodied are also the citizens most likely to vote. American states determine their own voting procedures. Block granting gives states an incentive to manage voting so as to reduce the participation of the marginalized communities who are most in need of public health insurance. Block granting is likely to undermine the health care for the poor and disabled, and it could reinforce the post-Shelby County v. Holder efforts to restrict voting.
Too little, too late
In their latest amendment to the American Health Care Act, House Republicans have created something called an “invisible risk sharing program.” The amendment is befuddling. The invisible program is a minor tweak that won’t improve the AHCA’s dismal coverage numbers. It’s not even really a program. If there’s any prospect at all of salvaging Republican-style repeal and replace, this newest amendment isn’t it.
The statutory text is spare. It appropriates $15 billion over nine years—or $1.67 billion each year—and tells the Secretary of Health and Human Services to use the money “to provide payments to health insurers with respect to claims for eligible individuals for the purpose of lowering premiums for health insurance coverage offered in the individual market.” The Secretary can supplement that funding with any money from the AHCA’s high-risk pools that states don’t find a way to use.
Beyond that, however, the statute tells us next to nothing about how the program is supposed to work. Hilariously, a section of the statute titled “Details of Program” contains no details. It says, for example, that the program should include “[a] definition for eligible individuals,” but leaves the defining up to HHS. So too with “[t]he identification of health conditions” that, if an eligible person has them, would qualify her insurer for extra payments.
Oh, and the program is supposed to be in place in time for the 2018 plan year.
Read generously, this newest amendment tells HHS to create a kind of reinsurance program for insurers who enroll high-cost individuals. The statute doesn’t use the word “reinsurance,” maybe because Republicans have spent years railing against the risk corridor and reinsurance programs as insurer bailouts. But if those were bailouts, then this is too.
Judging from the title, the program is supposed to look something like the proposal pioneered by Maine and described in this Health Affairs post. But Republicans are delusional to think that the Secretary can establish and implement a complex reinsurance-style program in time for the 2018 plan year. Insurers that want to participate on the exchanges have to submit bids to HHS by June 21. Even if the AHCA passed tomorrow—which it won’t—there’s no chance that Secretary Price could ramp it up in time.
Nor does the amendment explain how the new program is supposed to interact with the ACA’s risk adjustment program, which the AHCA leaves in place. The point of risk adjustment is to equalize risk across insurers: those with healthier-than-average enrollees have to pay into a central kitty, and those with sicker-than-average enrollees get some of that money. But if insurers get “invisible” risk sharing money for high-cost individuals, should they get less in risk adjustment money? The amendment doesn’t say.
In any event, the money is too insubstantial to make much of a difference. Sure, $1.67 billion per year sounds like a lot of money. But $1.67 billion is chump change compared to the subsidy reductions that are contemplated under the AHCA. It’s like using a band-aid to treat a gunshot wound.
April 5, 2017
JAMA Forum: Safe injection facilities
Last winter, the mayor of Ithaca, New York, Svante Myrick, proposed to provide a safe and legal space in which people could inject heroin. It may sound like a radical and desperate way to reduce the harms of drug use. But its effectiveness—and cost-effectiveness—is well supported by research.
So begins my latest post on the JAMA Forum. It’s probably got more links to studies than anything I’ve ever posted there. Take a look!
AcademyHealth: Referral patterns and hospital-owned physician practices
According to a recent study, when hospitals employ physicians, patients may not benefit. More in my new AcademyHealth post.

April 4, 2017
Diversion of stimulants prescribed to adolescents
Too many Americans are dying from opioid overdoses and too many of those opioids were pharmaceuticals that had been diverted to non-medical use. According to National Institute on Drug Abuse Director Nora Volkow,
opioid analgesics are widely diverted and improperly used, and the widespread use of the drugs has resulted in a national epidemic of opioid overdose deaths and addictions. More than a third (37%) of the 44,000 drug-overdose deaths that were reported in 2013 (the most recent year for which estimates are available) were attributable to pharmaceutical opioids; heroin accounted for an additional 19%.
However, opioids are not the only controlled substances that are commonly diverted: it’s also a large problem with benzodiazepines, sleep medications, and stimulants. We have known about the diversion of stimulants prescribed for attention-deficit/hyperactivity disorder [ADHD] for a long time. But I had no idea just how big the problem is.
Sean McCabe and colleagues have a recent article on stimulant diversion in the Journal of the American Academy of Child and Adolescent Psychiatry.
Objective
To assess the prospective 17-year relationship between the medical and nonmedical use of prescription stimulants during adolescence (age 18 years) and educational attainment and substance use disorder (SUD) symptoms in adulthood (age 35 years).
Method
A survey was self-administered by nationally representative probability samples of US high school seniors from the Monitoring the Future study; 8,362 of these individuals were followed longitudinally from adolescence (age 18, high school senior years 1976−1996) to adulthood (age 35, 1993−2013).
In these samples, 21% of kids reported using a stimulant medication at least once, including both usage as prescribed and diverted (non-medical) uses. But among those kids who used a stimulant, the kids who used them only as prescribed were a small minority.
It’s striking that there were almost three times as many kids who only used diverted stimulants as there were kids who only used them as prescribed. Keep in mind that this is not a clinical or convenience sample: the authors used nationally representative probability samples. This is as good a description of stimulant use in the US adolescent population as we are likely to get.
Is non-medical use of stimulants by teenagers a major problem? Unlike diverted opioids, few people die from using diverted stimulant medications. This study does not have a design that can identify a causal effect of non-medical stimulant use. Nevertheless, the descriptive findings of this study are not encouraging.
Among past-year adolescent nonmedical users of prescription stimulants, 97.3% had used at least one other substance during the past year.
Moreover, the Monitoring the Future data allowed McCabe et al. to follow the high school seniors to age 35. The kids who used diverted stimulants as adolescents were doing less well as adults.
Medical users of prescription stimulants without any history of nonmedical use during adolescence did not differ significantly from population controls (i.e., non−ADHD and non−stimulant-medicated ADHD during adolescence) in educational attainment and SUD symptoms in adulthood. In contrast, adolescent nonmedical users of prescription stimulants (with or without medical use) had lower educational attainment and more SUD [substance use disorder] symptoms in adulthood, compared to population controls and medical users of prescription stimulants without nonmedical use during adolescence.
The takeaways from this study are, first, that from the mid-seventies to the mid-nineties about 1 in 5 US high schoolers used stimulants, medically or non-medically. Second, many more kids used diverted stimulants than used prescribed ones. Lastly, the kids who used diverted stimulants didn’t get as far in school and had more adult SUD problems. We can’t say that use of diverted stimulants caused these problems. Among other reasons, essentially all of kids using diverted stimulants also used other drugs. We can say that using diverted stimulants is a good marker of a kid who may be in trouble.
The finding that far more kids use stimulants non-medically than medically — coupled with the high rates of opioid diversion — means that our system for supplying pharmaceuticals is broken. In the future, I am going to have difficulty saying “`controlled’ substances” without sardonic quotes around ‘controlled’.
Expanded coverage has pushed health services employment up by roughly 240,000 jobs
This post was coauthored by Charles Roehrig, Ani Turner, and Katherine Hempstead. Charles Roehrig is the Altarum Institute Fellow and Founding Director of the Institute’s Center for Sustainable Health Spending. Ani Turner is the Co-Director of the Altarum Institute Center for Sustainable Health Spending. Katherine Hempstead is Senior Adviser to the Executive Vice President at the Robert Wood Johnson Foundation.
In a November 2015 Health Affairs blog post, we argued that expanded coverage was responsible for much of the increase in health job growth that we observed from the middle of 2014 through the middle of 2015. In this post, we carry our analysis forward to December 2016 and provide our best estimate of the total number of additional health jobs that are attributable to the expansion in health insurance coverage that began in 2014 under the Affordable Care Act (ACA). While for now, the American Health Care Act (AHCA) is dead, should it be resurrected and a portion of these coverage gains be reversed as projected by the Congressional Budget Office (CBO) in their scoring of the bill, we would expect a proportional reversal in these job gains.
Coverage and Health Job Growth: National Data
The percentage of the US population with health insurance increased slowly from 2010 to 2014 and then rose sharply in 2014 and 2015, coinciding with the expanded coverage provisions of the ACA that were introduced in 2014 (Figure 1). As expected, coverage began to level off in 2016 with a relatively small increase in the percent insured. Health job growth was stable through 2012, but dropped in 2013. Despite the jump in coverage, it dropped further in 2014, but then more than doubled in 2015.
Figure 1: Percent Insured and Health Job Growth (National Data for 2010 – 2016)
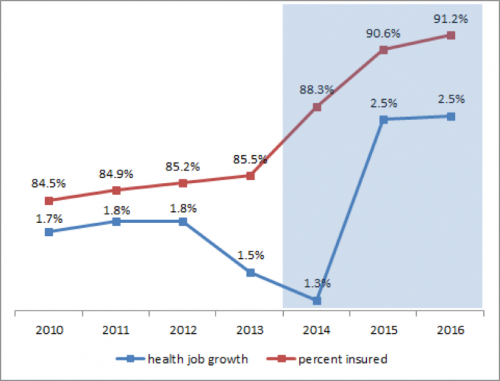
Source: Altarum Center for Sustainable Health Spending. Health job growth is estimated using U.S. Bureau of Labor Statistics (BLS) data while the percent insured is taken from the American Community Survey combined with CSHS analysis of Gallup poll data (for 2016). The shaded area represents coverage expansion under the Affordable Care Act.
What we expected. When coverage expands, the newly insured increase their overall utilization of health care and reduce their levels of uncompensated care. As a result, health care providers experience a growth in demand for care and in revenues. This should lead to increased hiring as they have both the need for additional staff and the means to pay. As expanded coverage levels off, these effects recede and hiring should return to normal growth rates.
What we saw. The patterns in Figure 1 are generally consistent with these expectations and reveal a lag between coverage and hiring. The greatest increase in coverage occurred in 2014 but the jump in the rate of hiring did not occur until 2015. This lag is not surprising, given the timing of coverage expansion (much of the expansion in 2014 occurred part-way through the year) and the time it takes for the newly insured to find a provider and for providers to increase hiring in response.
We estimate that roughly 240 thousand health jobs have been added by expanded coverage between 2014 and 2016. Health jobs grew at an average rate of 2.5% in 2015 and 2016. As a rough estimate of what the growth rate would have been without coverage expansion, we use 1.7%, which is the average rate for the years 2010 through 2013. Using this rate, we estimate that of the 745 thousand health jobs added between 2014 and 2016, about 240 thousand were due to expanded coverage. This is, of course, a rough estimate based upon the assumption that health jobs would have grown at 1.7% in 2015 and 2016 in the absence of expanded coverage and that the faster growth was due solely to expanded coverage.
To examine the hypothesis that the acceleration in health job growth in 2015 and 2016 was due to expanded coverage, we analyzed state-level data to see if states with higher rates of expanded coverage showed higher acceleration in health job growth.
Coverage and Job Health Growth: State-Level Data
Figure 2 displays the relationship between state-level coverage expansion and health job growth. The horizontal axis shows the change, from 2013 to 2015, in the percent of the state population covered by any form of health insurance. The vertical axis displays the change in the health job growth rate following coverage expansion. Specifically, it is the difference between health job growth during the expanded coverage period (June 2014 through December 2016) and the pre-expanded coverage period (June 2012 through June 2014). Forty states are included in the analysis due to lack of data for 10 states (listed in the footnote to Figure 2).
What we expected. We expected the change in health job growth rates to be greater for states that experience the largest increases in coverage. If expanded coverage accounts for all of the job growth change, we would expect states with very little expanded coverage to show very little change in health job growth rates.
What we saw. The data show the expected positive relationship between coverage expansion and change in health job growth. A weighted regression (using the square root of the number of health care sector jobs as weights) shows that this relationship is statistically significant (Figure 3). The regression intercept (0.2%) suggests that only 0.2 percentage points of job growth change would have occurred in the absence of expanded coverage. Thus the state level data are consistent with the hypothesis that expanded coverage accounted for most of the change in health job growth in 2015 and 2016.
Figure 2: Increase in Health Job Growth Rate Vs Increase in Percent Insured
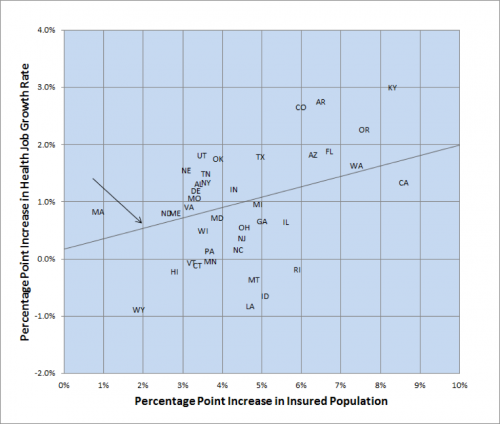
Source: Altarum Center for Sustainable Health Spending. The percentage point increase in the insured population refers to 2013 to 2015 and is derived from American Community Survey data. The percentage point change in health jobs is the difference in job growth between June 2014 and December 2016 and June 2012 and June 2014 (annualized rates). Health jobs data are from the BLS Current Employment Statistics and are available for 40 states (the 10 missing states are AK, IA, KS, MS, NV, NH, NM, SC, SD and WV).
Figure 3: Weighted Regression Statistics

Source: Computed from data in Figure 2 using the square root of health jobs in 2015 as weights.
Implications for 2017 and Beyond
As projected by the CBO, the AHCA, if it were to become law, would reduce the number of people with health insurance by 14 million in 2018, through reductions in tax credits and Medicaid funding. This would largely reverse the previous gains in coverage (18 million) from 2013 through 2016, and therefore, based on our analysis, largely reverse the growth in health jobs that resulted from expanded coverage.
With AHCA tabled, but ACA repeal or modification not fully abandoned, the health sector will continue to operate under uncertainty. Early 2017 jobs data suggest that providers and health systems may have already begun to slow hiring, whether due to this uncertainty or a gradual return to the pace of growth seen prior to expanded coverage. During January and February, monthly health sector job growth averaged only 19 thousand, compared to the monthly average of 32 thousand for 2015 and 2016. Should monthly gains continue at this rate, the health job growth rates will drop below 2% by mid-year and stabilize near the 1.7% average growth seen in 2010 through 2013.
Notes:
Health jobs refers to jobs in health care services such as hospitals, physician offices and clinics, nursing homes, home health, and dentist offices.
The drop in the rate of hiring in 2013 and 2014 was driven mainly by hospitals and a likely contributor was the Sequester which reduced Medicare payments to hospitals by 2% starting in the middle of 2013.
For evidence of such lags, see exhibit 2 in Donohue, et. al, showing how prescription drug use of new enrollees increases incrementally over many months rather than all at once.
This represents a 1.6% increase in jobs that we are attributing to the 18 million individuals gaining coverage between 2013 and 2016. It is roughly in line with previous research suggesting that, for every 10 million people who gain coverage, health care utilization and workforce requirements would increase by about 0.7%, with some added short term increases due to double payments for previously uncompensated care. One recent study estimated a loss of 912 thousand health jobs by 2019 under ACA repeal while another estimated roughly 400 thousand.
The actual number of health jobs increased from 14.7 million in 2014 to 15.4 million in 2016.
State health job growth rates are also impacted by factors such as population growth and aging. Our analysis assumes that these factors did not change significantly during our study period.
Figure 1 shows coverage increasing by 5.7 percentage points which, applied to the 2016 US population of 324 million, gives coverage gains of about 18 million.
We report year-over-year growth. For monthly data, this means comparing health jobs in the current month with health jobs in the same month of the preceding year.
April 1, 2017
Healthcare Triage: Health Care Reform, Tradeoffs, and the Need for Negotiation
We did an episode on the AHCA. Then we did an episode on the CBO report on the AHCA. Then… everything seemed to fall apart. What happened? It turns out, nobody is interested in negotiating about healthcare laws. Which makes it really hard to pass a new healthcare law.
@aaronecarroll
Aaron E. Carroll's Blog

- Aaron E. Carroll's profile
- 42 followers

