Phil Simon's Blog, page 88
October 3, 2013
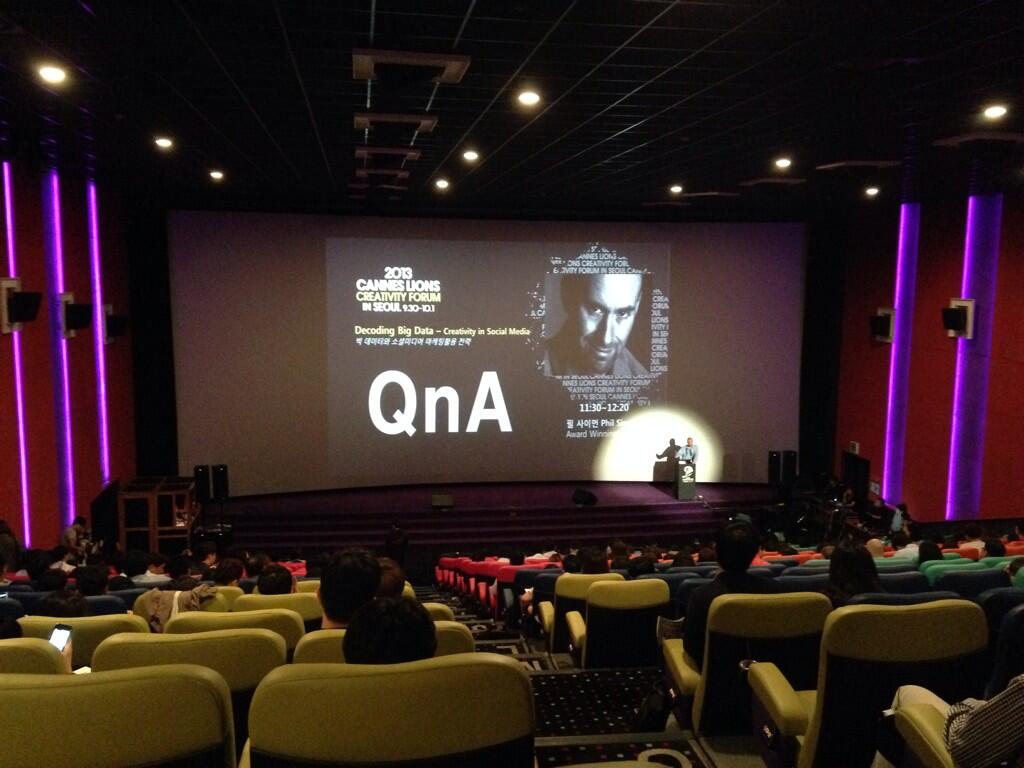
10 Things I Learned in Seoul

I recently keynoted the Cannes Lions Creativity Forum in Seoul, South Korea. Picture below.
While I didn’t spend too much time in the city, I did learn a few things. Here they are:
The Internet is crazy fast here. The hi-def final episode of Breaking Bad I downloaded took under seven minutes. Yes, they were seven long minutes.
The Internet is at least partially restricted here. YouTube videos often wouldn’t play and Amazon Instant Video isn’t available. Normally, I wouldn’t care, but see #1.
Samsung is huge. Bigger than Apple, even.
Yahoo! is not. I asked all 200 conference attendees to raise their hands if they used Yahoo! Zero hands went up.
I also asked all 200 attendees to raise their hands if they didn’t own a smartphone or tablet. Again, nary a hand went up.
It’s common practice to give your business cards to someone as you’re meeting them. This is a bit different than in the US. I normally hand out a card after a brief conversation.
The people are incredibly friendly. Just saying “Hello” earned me major points with everyone.
I can’t recall getting better hotel service, ever. Keeping tourists happy seems to be critical.
Golf is really important here. The hotel sported a driving range, and probably ten percent of the channels featured the sport. There is a public course five minutes from ICN.
Action movies are very popular, especially American ones. No wonder Hollywood is content to churn out boilerplate flicks rife with car chases.
That’s about it. Did I miss anything?
The post 10 Things I Learned in Seoul appeared first on Phil Simon:.


October 1, 2013
On Big Data, Numbskulls, and False Knowledge
“Beware of false knowledge; it is more dangerous than ignorance.”
–George Bernard Shaw
Anyone writing a non-fiction book on a topic ought to be able to explain the subject to a 10-year-old. I’ve said many times that you may only get 30 seconds in an elevator with someone. You might have a short window, and words matter. Make them count.

Over the last six months, I’ve homed what I think is a pretty simple and effective description of Too Big to Ignore. Just the title evokes the question from most people, “What’s Big Data?”
I’ve got my response down to about 20 seconds, using consumer-friendly terms like Facebook, YouTube, Twitter, and Tumblr. While Big Data is rife with buzz these days, there are still plenty of people who have never heard of it. Among those that have, there’s anything but a consensus on what it means.
Hadoop and Martinis
Of course, Big Data is a big deal. But that hardly means that everyone has heard of it, much less really understands it. Educating people is one of the reasons I write books. And make no mistake: A great deal of education is needed.
Case in point. I went to a mixer a few weeks ago in Las Vegas. I wound up in a conversation with a self-described venture capitalist. (Call him Matt here.) I suspected immediately that Matt didn’t know half of what he claimed to know. His claims were suspect and just didn’t pass the smell test. The term poseur came to mind.
After a few moments, the topic turned to Big Data. I played it coy, not explaining that I had recently written a book about the topic. I asked him a few specific questions designed to test his moxie. He mentioned Hadoop and said something nonsensical about “whoever owns it.”
No one owns Hadoop.
That’s when I just couldn’t bite my tongue any longer. “No one owns Hadoop”, I scolded him. “It’s an open-source project. Anyone can download it anytime they want.”
Now, people make honest mistakes all the time, but there’s a bit difference between ignorance and false knowledge, as Shaw points out. As I left the bar, I couldn’t help but think of a line from Jennifer Jason Leigh’s character in The Hudsucker Proxy, “Only a numbskull thinks he knows things about things he knows nothing about.”
Simon Says: Beware of Big Data Poseurs
The dangerous thing about a guy like Matt is that some people invariably will listen to him–and come away either confused or just incorrectly informed about important topics like Big Data. To many a layperson, he seems to know what he’s talking about.
Except he doesn’t. Not. Even. Close.
Don’t be afraid to question self-anointed experts. Just because someone drops a term like Hadoop or Big Data doesn’t mean anything. Look deeper.
Feedback
What say you? This post was written as part of the IBM for Midsize Business program, which provides midsize businesses with the tools, expertise and solutions they need to become engines of a smarter planet. I’ve been compensated to contribute to this program, but the opinions expressed in this post are my own and don’t necessarily represent IBM’s positions, strategies, or opinions.

The post On Big Data, Numbskulls, and False Knowledge appeared first on Phil Simon:.
September 26, 2013
A Quick Update on The Visual Organization
The manuscript for The Visual Organization: How Intelligent Companies Use Data Visualization To Make Better Decisions is now in my editor’s hands. We’re about to start editing, and the book should be out a month earlier than expected (Feb, 2014).
Here are just a few observations as my manuscript is polished into a book:
At least for me, connecting with so many talented and smart folks is one of the biggest benefit of writing books. I often learn by osmosis, and having my theories validated and refined by practitioners only gives me more confidence as a writer.
You need not be a programmer, statistician, or data scientist to get started with dataviz.
As always, the research process has been very instructive. I have learned a great deal about how people and organizations use contemporary data visualization tools and new sources of data to ask better questions and make better decisions. It’s obvious to me that there is no one right way to represent data in a visual manner. It is equally obvious that people can do a great deal more with interactive tools then they can with static ones. The book even posits a model on Visual Organizations of which I’m pretty proud.
There has been a veritable explosion of data visualization applications over the last five to ten years, and more are being developed every day. Yes, there are oodles of options simple Microsoft Excel charts, dashboards, and even traditional business intelligence tools. And there’s just no excuse for not experimenting with them. Many of the applications out there are entirely intuitive; you need not be a programmer, statistician, or data scientist to get started. You just need to be curious.
Perhaps the most astonishing finding for me has been the extent to which Netflix visualizes data. You can read more about it when the book comes out, but it’s almost easier to list the types of the data that Netflix isn’t tracking than the opposite.
The post A Quick Update on The Visual Organization appeared first on Phil Simon:.
September 18, 2013
Visualize Your Timeline

A simple list of personal and corporate events can be informative, but isn’t terribly sexy.
I’ve been playing around with visual timelines, and Timeline.js is pretty sick. You can spend a great deal of time customizing it with different links and images, but the following took me about two minutes once I parsed my data.
While you’re at it, check out Madonna’s most controversial moments.
Simon Says
There are cool ways to represent even simple data.
Feedback
What say you?
The post Visualize Your Timeline appeared first on Phil Simon:.
September 14, 2013
Book Review: The Year Without Pants
I just finished my friend Scott Berkun’s latest book The Year Without Pants: WordPress.com and the Future of Work (affiliate link). It’s awesome. Watch my video review below.
The post Book Review: The Year Without Pants appeared first on Phil Simon:.
September 12, 2013
Expand Your Data Focus
“The outward work will never be puny if the inward work is great.”
–Meister Eckhart
Like many people in the enterprise IT world, I have spent a great deal of time looking inward with my clients. At least in my experience, the focus of most ERP and CRM projects was almost exclusively on internal enterprise data and related tools: ETL, standard reports, StoredProcs, file formats, data conversions, and the like.
 Now, don’t get me wrong. Enterprise data is still incredibly important–and the era of Big Data doesn’t change that one bit. Structured and transactional information on customers, employees, products, and the like still drive countless business decisions.
At the same time, though, old habits die hard. These days, it seems as if relatively few organizations pay much attention to the data outside their walls. This is unfortunate, because there’s quite a bit of potentially valuable information just sitting out there.
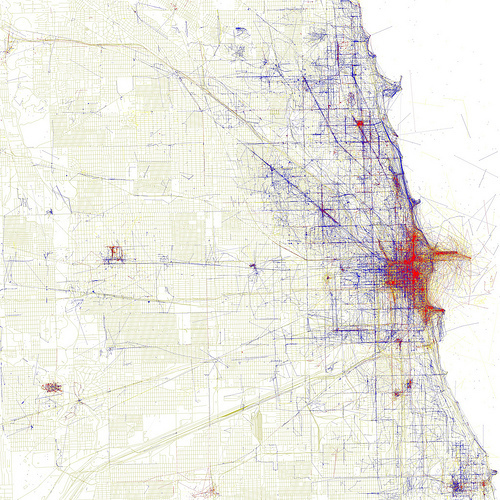
External Datasets: A Big Opportunity
Forget Twitter feeds and Pinterest pins. Think about the open datasets on that sites like Amazon make available. And we’ve seen an absolute explosion in the number and types of these repositories in the last few years. More datasets become public almost daily in a veritable bouillabaisse of categories: media, geography, publications, government, life sciences, and others. It’s a point that I made recently keynoting the Optum/Humedica conference on Big Data.
Think about pulling data from LinkedIn on your employees via its API. What type of problems could that data help your organization solve? Quite a few, in my experience. For instance, not many HR departments know which skills their employees possess. I’ve personally seen companies conduct expensive searches for external candidates when perfectly viable internal ones existed–but nobody knew. Really? Walt has international experience and a degree in chemistry?
How many organizations can take a 360-degree picture of their customers?
How many organizations can take a 360-degree picture of their customers? Very few, I would imagine. Netflix is the exception that proves the rule. Maybe stitching together data and metadata from external sources doesn’t get an organization all of the way home, but clearly there’s value in looking beyond an enterprise own databases, data warehouses, and datamarts.
Simon Says: Look Outside
As APIs become more prevalent, it becomes easier for organizations to quickly access troves of data. This means less of a maintenance burden on IT. In the coming years, as data gets bigger and more open, accessing data from unconventional means will become increasingly important.
Feedback
What say you? This post was written as part of the IBM for Midsize Business program, which provides midsize businesses with the tools, expertise and solutions they need to become engines of a smarter planet. I’ve been compensated to contribute to this program, but the opinions expressed in this post are my own and don’t necessarily represent IBM’s positions, strategies, or opinions.
Photo:  Eric Fischer via Compfight
The post Expand Your Data Focus appeared first on Phil Simon:.
September 10, 2013
Dataviz and Dry Cleaners
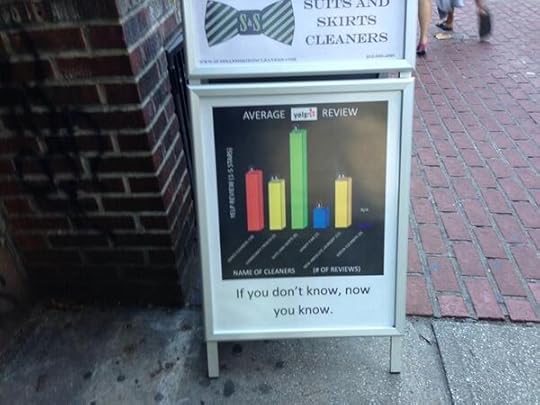
Is it just me, or is data visualization everywhere?
Walking around Manhattan a few days ago, I couldn’t help but notice this simple chart of a dry cleaner’s Yelp reviews.
As I wrap up the manuscript on the new book, it’s evident to me that data is everywhere–and dataviz isn’t far behind. When a low-tech business like a dry cleaner understands the importance of visualizing its social data, you know that times are changing. The chart made me stop, look at it, and snap this picture. If had a shirt that needed to be pressed, you can bet that I would have gladly stopped in.
Simon Says
Sometimes, even a simple dataviz can be effective. Company size and resources isn’t nearly as important as mind-set.
Feedback
What say you?
The post Dataviz and Dry Cleaners appeared first on Phil Simon:.
September 3, 2013
The Visual Organization: Tentative Jacket Copy
I’m a pretty fast writer and believe strongly that it’s essential to get it down before you get it right, to quote Neil Peart. There’s one part, though, that I typically slave over: the jacket copy, a roughly 450-word encapsulation of the entire book. If it sucks, then it’s unlikely that anyone will want to plunk down $25 for the whole thing.
Jacket copy should include stories. Hitting people over the head with technical terms in generally isn’t wise, much less in the limited space on a book jacket. Good copy should mix examples with the larger purpose of the book.
Let me know what you think in the comments. I am curious to read others’ opinions.
Jacket Copy
Are you predisposed to movies with black jacket covers? When it comes to TV shows, do you have a natural affinity for orange? Does your five-start rating for Arrested Development mean that you are likely to enjoy Orange Is the New Black? Are certain colors more popular during certain times of the year with certain audiences? What’s your ideal hue?
If you’re a Netflix customer, then the company knows the answers to these questions—and a great deal more—for you and for each of its 30 million streaming subscribers. The company’s renowned video-recommendation algorithm integrates an astonishing array of data sources. Each one increases Netflix’s knowledge on individual and family user habits and preferences.
Relatively few people are aware, however, that the vaunted Netflix algorithm is only partly responsible for the company’s massive success. Behind the scenes, many pockets of the organization rely heavily upon a slew of powerful, custom-built data visualization applications. Equipped with these tools, Netflix employees are discovering nascent trends, diagnosing technical issues, and unearthing obscure yet extraordinarily valuable customer insights.
And Netflix is hardly alone in its innovative use of new dataviz technologies. Employees at Autodesk use a remarkable and interactive tool that visualizes current and historical employee movement. From this, they can identify potential management issues and see what a corporate reorg really looks like. Through cutting-edge dataviz, startup Wedgies instantly serves up real-time poll results while monitoring poll traction and site issues. The University of Texas is bringing a visual type of transparency to academia. It makes unprecedented amounts and sources of institutional data available on its website. Anyone with the desire and an Internet connection can slice and dice UT data in myriad ways. And then there’s eBay. Powerful data-discovery tools allow employees to effectively “see” what ebay.com would look like as a brick-and-mortar store.
The era of Big Data as arrived but, on many levels, most organizations are woefully unprepared. Far too many enterprises erroneously believe and act like nothing has really changed. As such, they continue to depend exclusively on reporting stalwarts like Microsoft Excel, static dashboards, basic query applications, and even traditional business intelligence tools. And they are missing out on tremendous opportunities.
Amidst all of the hype and confusion surrounding Big Data, though, a new type of enterprise is emerging: The Visual Organization. A relative handful of organizations has realized that today’s ever-increasing data streams, volumes, and velocity require new applications. In turn, these new tools promote a different mind-set—one based upon data discovery and exploration, not conventional enterprise “reporting.”
In The Visual Organization, award-winning author, keynote speaker, and recognized technology expert Phil Simon demonstrates how progressive enterprises have turned traditional dataviz on its head. In their stead, they are embracing new, interactive, and more robust tools that help locate the signals in the noise that is Big Data. As a result, these enterprises are asking better questions and making better business decisions.
Rife with real-world examples and practical advice, The Visual Organization is a full-color tour de force. Simon deftly explains how organizations can do more than just survive the data deluge; they can thrive in it. It is required reading for executives, professionals, and others interested in unleashing the true power of their data.
The post The Visual Organization: Tentative Jacket Copy appeared first on Phil Simon:.
September 2, 2013
Netflix, Big Data, and the Big Leap of Faith

As I pen these words, Breaking Bad is in its home stretch. The gripping drama drew 6 million viewers for the premier of its last season, nearly twice the total of the Season 4 opener. That’s an interesting statistic, my favorite factoid comes from Netflix:
Last year, Netflix discovered that an astonishing 50,000 subscribers watched all 13 episodes of the prior season on the day before Season 5 premiered.
Can someone say binge watching?
Now, Big Data skeptics probably see things like this and typically react in one of the following ways:
So what?
What exactly will Netflix do with this information?
Great information, but big deal.
Netflix doesn’t generally ask these questions, and it sure doesn’t make major financial decisions based upon the short-term. In researching the new book, I spoke to a Netflix Big Data wonk. During the conversation, I got the very strong sense that Netflix just doesn’t focus on these types of questions. At Netflix, data collection, visualization, and analysis trump short-term ROI concerns.
Later that night, Kevin Spacey appeared on Charlie Rose to talk about Netflix and House of Cards.
During the interview, Spacey mentioned how every network he pitched expressed interest in the series. With one exception, each wanted to shoot a pilot first and then look at the results. You can probably guess who gave the go-ahead sans shooting a traditional pilot.
Data collection and analysis trump short-term ROI concerns.
Netflix.
Why spend $100 million on an original series without shooing a pilot? Quite simply, because Netflix possesses enough data and sufficiently strong algorithms to make decisions like these. By showing faith in Spacey et al, Netflix sent a strong signal that it was serious–and ultimately landed the series. (Note that Reed Hastings and company still use good old-fashioned judgment and intuition. Those who believe that Big Data obviates the need for both are mistaken.)
Is there risk? Of course, but House of Cards was worth the gamble. By some accounts, Netflix has already more than recouped its investment.
Simon Says
Netflix gets it. Big Data, dataviz, and data discovery don’t fall into neat ROI calculations. That is, to successfully navigate a Big Data world, one can’t think solely about KPIs, dashboards, and ROI calculations. What’s more, Big Data is additive.
Feedback
What say you?This post was written as part of the IBM for Midsize Business program, which provides midsize businesses with the tools, expertise and solutions they need to become engines of a smarter planet. I’ve been compensated to contribute to this program, but the opinions expressed in this post are my own and don’t necessarily represent IBM’s positions, strategies, or opinions.
The post Netflix, Big Data, and the Big Leap of Faith appeared first on Phil Simon:.
August 29, 2013
12Books’ Interview on Too Big to Ignore

I recently did an interview on 12books about my fifth book, Too Big to Ignore: The Business Case for Big Data. It is now live. You can listen to it here.
Note that registration is required.
The post 12Books’ Interview on Too Big to Ignore appeared first on Phil Simon:.