
Chris Dillow's Blog, page 162
December 11, 2012
"Strivers" vs "scroungers": a false dichotomy
One of the nastier political memes of recent times is the attempt to distinguish between "strivers" and "scroungers." This must be resisted.
In saying this, I'm not referring to the fact that Osborne's real-terms benefit cuts are also a cut in tax credits which will hurt "strivers". Nor am I referring to the fact that the rise in housing benefits owes less to scrounging than to a failure to build homes and to a subsidy for landlords. Nor do I mean that "scrounging" might well be an endogenous preference - a rational response to the inability to find work. Nor do I mean that there's a strong case for supporting "scroungers". And nor do I mean that politicians' claims to support "strivers" is merely rank hypocrisy when they stigmatize, exclude and harrass hard workers who have the misfortune not to be born here.
Leave aside all these facts. I'm referring to something else - that, in very many cases, there's no sharp distinction between "strivers" and "scroungers".
Look at the latest labour market flows numbers. These show that, in Q3, 871,000 moved from employment to unemployment or inactivity*. 3.1% of "strivers" (those in employment) thus became "scroungers". Also, 591,000 moved from unemployment to employment. So 23.2% of those "scroungers" became "strivers". Another 437,000 left economic inactivity to become employed.
This tells us that unemployment is not so much a pool, in which there are "scroungers" and "strivers" outside, but is instead a river, in which many people move from "scrounger" to "striver".
Because of this, the number of long-term unemployed is low. There are only 436,000 who have been out of work for more than two years, compared to over 1.1 million who have been unemployed for less than six months. And some of this long-term unemployment reflects not "scrounging", but the difficulty of finding jobs in a recession. When the economy was doing OK in 2007, there were fewer than 200,000 long-term unemployed - a mere 0.4% of the working-age population. If we equate this number with "scroungers" (and the overlap is only rough) then the prevalence of scrounging is slightly greater than that of polydactylism and rather less than dyscalculia.To put this another way, paying £71 per week to 200,000 people costs less than £800m a year, which is less than half of one per cent of GDP.
To a large extent, then, we should regard out-of-work benefits not as something that "strivers" hand out to "scroungers", but rather as a form of insurance.
Worrying about "scroungers" is, to a large extent, fact-free ideology. The attempt to distinguish between "strivers" and "scroungers" is the oldest tactic in the ruling class's book - divide and conquer. And the British people seem daft enough to fall for it.
* This understates the numbers losing their jobs, as some people would have lost a job and found one again in the three month period.


December 10, 2012
Retirement as freedom
Gillian Tett gives us a nice example of how even the more inteligent members of the political-journalistic class can miss the point. She says:
If “pensioners” [the Rolling Stones*] can now dance so wildly on stage, might it be time to rethink that whole concept of retirement?
However, the issue here is not the physical capabilities of older folk. The evidence suggests that this declines (pdf) only slowly with age.
Nor is it the case that retirement is, as Ms Tett complains, "terrible for the public purse", at least in the UK. The OBR projects that spending on state pensions will rise by 2.6 percentage points of GDP between now and 2061-62, to 8.3%. This is not big money. It is only two-thirds of the standard deviation of the share of government spending in GDP since 1966. And it's less than the increase in public spending between 1990 and 1993 or between 2000 and 2002, and only half the amount by which the OBR expects public spending to fall between now and 2017-18.
Instead, the issue here is freedom. For the vast majority of people, work is not a pleasant means of gratifying the ego - as it is for Ms Tett and people like her - but is instead dull drudgery and the sacrifice of real (pdf) freedom. Even I, whose employment is less burdensome than, I guess, 95% of people, still have to do lots of things I'd rather not.
For most people, then, retirement means liberty. And, surely, liberty is a luxury good - the sort of thing we spend more on as we get richer. It's thus reasonable for richer societies to spend more on securing real freedom. And the OBR expects real GDP to be more than three times higher in 2061 than it is now.
And this is what Ms Tett - and more importantly, our entire political-journalistic-managerialist class - doesn't see, that work is wage slavery and that retirement is freedom.
In fact, what's remarkable about economic growth in recent decades is how little it has been used to increase leisure. In 1931, Keynes famously suggested (pdf) that rising prosperity would lead to a 15-hour working week. Since he wrote that, the working week has dropped only from an average of 43 hours to 31.
Exactly why we haven't chosen leisure to the extent that Keynes expected is a separate question. But it might be reasonable for future generations to make Keynes' choice, and to exercise that choice not so much by working less each week, but by freeing themselves from wage slavery as soon as possible.
* Am I alone in thinking that Mick Jagger is one of the biggest twats who ever drew breath? (I've nowt against Keith: anyone who loves cats and Gram Parsons passes muster.)
December 9, 2012
On passivity
Nick Cohen bemoans, as I have done, the passivity of the British people in the face of inequality and austerity. This poses the question: why are folk so supine? Here are three theories:
1. At an individual level, protest and unrest is U-shaped with respect to job prospects. Young people will take to the streets if they have no hope of a job - as they did in 1981 - because the have nothing to lose. And they might rebel if full employment makes them confident of getting a job anyway, as the soixant-huitards did. It is at intermediate levels of prospects that protest is risky. Nobody wants to make trouble if doing so costs them the chance of a job at Goldman Sachs.
2.Revolutions tend to happen not when conditions are bad, but when there's a big gap (pdf) between actual conditions and aspirations.But there's no such gap now, because aspirations are low. Of course, there are alternatives to our existing arrangements, but none seem widely popular.
3. There's scepticism about what collective action can achieve, and as a result people think the way out of austerity is through their own efforts - an idea which our political class endorses by celebrating "strivers."
It would be tempting to think this is another example of the performativity of "neoliberalism"; it doesn't just claim to describe the world, but helps create it.
But I'm not sure of this. Put it this way. If I were to ask: "What has collective action actually achieved in our lifetime?" my parents and grandparents could point to the creation of the welfare state and to trades unions' role in raising wages. But how can the under-40s reply? Looking at recent history suggests that an aversion to political action - either parliamentary or extra-parliamentary - has a sound empirical basis. And I say this with sorrow.
December 7, 2012
The investment problem
Are there any policies consistent with capitalism that could solve the UK's under-investment problem? This is the question raised by Paul's reasonable observation that "under-investment is at the heart of Britain’s economic decline." He suggests that the solutions to this should include: attacking the hegemony of the City; "a virtuous wage and demand growth circle"; and a "non-investment tax, where it costs corporations and banks more to hold surpluses over a certain percentage limit than it does to invest them productively."
I'm sceptical about all three ideas.
1.October's quarterly CBI survey_(pdf) found that only 6% of manufacturers said that investment was constrained by an inability to raise external finance. This proportion has been low for as long as I remember. Of course, this 6% might be important. But it's hardly a sign that financiers' starving industry of capital is a widespread problem.
2. "Wage-led growth" - whereby higher wages lead to higher aggregate demand and thus stronger investment - is theoretically possible. It happened post-war. But it requires that capitalists be confident that governments can maintain high aggregate demand. If this confidence falters, high wages will lead to investment cuts, as we saw in the 1970s. And, remember, the wage share rose between the mid-90s and mid-00s, without generating a great investment boom.
3. We already have a tax on non-investment. It's been imposed by the Bank of England which has cut interest rates to negative levels in real terms. (In fact, real interest rates have drifted downwards for most of the post-80s period). Whilst this probably has kept investment higher than it would otherwise have been, it has been insufficient to greatly increase it. As Keynes said: "It seems unlikely that the influence of banking policy on the rate of interest will be sufficient by itself to determine an optimum rate of investment."
I don't say all this to suggest instead that "neoliberal" policies would do better at promoting investment.
Quite the opposite. I do so to ask a question. Could it be that there are no policies consistent with capitalism as we know it that would generate sufficient investment to create lasting full employment? It could be that the eastward migration of low-wage work, plus the slowdown in technical progress that's created a lack of (monetizable) investment opportunities mean that any policies to promote investment will be at best only mildly effective.
Now, I honestly don't know the answer to this. Maybe we'll get a second wind of technical progress that does stimulate investment. Or maybe a reduction in uncertainty about the US fiscal cliff and euro debt crisis, combined with pent-up demand, will cause a strong bounce in capital spending.
Instead, my concern is that too many non-Marxist commentators are making an assumption which should be questioned - that there are some policies which could feasibly greatly promote investment.They seem to assume away Keynes' suggestion that "a somewhat comprehensive socialisation of investment will prove the only means of securing an approximation to full employment."
December 6, 2012
The irrelevant structural deficit
Is our current economic weakness merely cyclical or structural? The OBR is, to say the least, not clear: see pars 1.16 to 1.18 here (pdf). It says (par 1.3) that most of its downward revisions to GDP forecasts are "assumed to be cyclical" [emphasis added].
This assumption is very convenient for Mr Osborne. If weak GDP is cyclical, then it follows that much of the deficit is cyclical, which relieves the Chancellor of the percived need to tighten fiscal policy further to reduce the "structural deficit".
This, though, merely strengthens my view that the notion of the structural deficit is a load of hoo. As Rick says:
Because no-one can tell how much of our economic underperformance is structural and how much is cyclical, George Osborne can’t possibly have any idea how big the structural deficit is.
This raises the question. Even if we do have a "structural deficit" - and it's impossible to tell for sure - would it then follow that fiscal policy should be tightened? I think not, for three reasons:
1. A world in which the deficit is "structural" is one in which productivity growth is low and trend output growth is low. But in such a world, investors' would have little demand for risky assets and a high demand for safe ones. It would, then, be easy to finance big borrowing, even if it were structural. To put it less strongly, the question of whether the deficit can be financed at low bond yields is separate from the question of whether the deficit is cyclical or structural.
2. Measure to tighten fiscal policy could aggravate the problem of low productivity. Many of you might think this would be true of tax rises. But it might also be true of any fiscal tightening that amplifies a downturn if - as for example in learning-by-doing models - cyclical downturns (pdf) can reduce long-term growth.
3. A good reason to believe the government's deficit might be structural is that the private sector has a structural(ish) financial surplus. This could be because the dearth of investment opportunities means companies' aren't recycling their profits into capital spending - something which the OBR expects to continue*. And/or it could be because this is a balance sheet recession and the private sector wants to pay off debt.In such a world, it might be better for the government to loosen policy, to give the private sector the room to repair its balance sheets. Fiscal tightening risks crashing the economy as the paradox of thrift takes hold.
These considerations, I think, mean that the idea of a structural deficit is not just imprecise, but irrelevant. Even if its existence could be proved, it would not be sufficient justification to tighten fiscal policy. That justification lies elsewhere.
In this context, perhaps Osborne deserves a little credit. In deciding against tightening yesterday, he's shown that he's not obsessing about whether the deficit is "structural" or not. Quite right too.
* Table 1.8 of its supplementary economics tables.
December 5, 2012
Euro shocks & fiscal policy
There's something George Osborne said today that I want to argue with. It's this:
If, for instance, lower growth was the result of the Government’s fiscal policy, [the OBR}would say so.
But they do not.
They say the economy has “performed less strongly” than they had expected.
They forecast growth this year of -0.1%, but in their view “the weaker than expected growth can be more than accounted for by over-optimism regarding net trade”.
True, the OBR does say this; par 2.8 of this pdf. However, if Mr Osborne thinks this justifies his fiscal stance, he is surely wrong.
First, the OBR's forecasts in March were based upon the view that tighter fiscal does hurt the economy. It assumed that cutting current public spending by 1% of GDP reduces GDP by 0.6% (par C54 of this pdf).Whilst this is a lower multiplier than many believe, it is not the negative one of expansionary fiscal contraction theory. The fact that GDP's shortfall from March's expectations can be blamed upon external factors does not mean austerity doesn't depress the economy. It just means the extent to which it does is not obviously greater than the OBR thought a few months ago*.
Secondly, the fact that the euro area economy is weaker than expected is itself a reason why we should have had a looser fiscal policy - to cushion us from that external shock.
You might reply that the government can't be blamed for not foreseeing the depth of the euro area's troubles.
True. But as I've said, shocks are an unavoidable fact of economics, and a policy that doesn't consider them isn't worth a damn.
Put it this way. Let's say fiscal policy has been looser this year, and we'd experienced the opposite shock, of stronger European growth. What would have happened?
Gilt yields would now be higher, mainly because stronger economic activity depresses demand for safe assets. That means higher government borrowing costs. But such costs would be a price of success, not a symptom of policy failure. And the extra borrowing generated by the looser policy could well be offset by lower borrowing arising from our stronger economy. It's unlikely markets would take fright at this; it's rare for western bond markets to suffer a serious loss of confidence when debt-GDP levels are lowish, the economy is growing and borrowing falling. And even if they did, the Chancellor could restore confidence by tightening now, against a background of a stronger economy.
My point is simple. The cost of a tight fiscal policy given an adverse demand shock from Europe is probably greater than the cost of a looser policy, given a positive shock. To the extent that this is the case, the fact that GDP has fallen this year because of the euro shock does not exonerate Osborne at all. It just shows that he failed to consider properly the high possibility of shocks.
* Actually, the fact that the OBR's forecast for domestic demand was right does not mean their belief in small multipliers is correct. It's quite possible the OBR assumed too small multipliers, but got their forecasts for domestic demand correct because they were overly optimistic about other things.
December 4, 2012
Spending by rich and poor
The very rich, said F. Scott Fitzgerald, "are different from you and me*." Today's ONS report on family spending helps us see how different.Table A6 shows spending by income decile. From this, I've measured the ratio of the highest decile's spending to the lowest decile's for various items; the highest decile has weekly income of over £1405, the lowest has an income under £173.
For all significant items bar two (rent and tobacco), the rich spend more than the poor. At this level of aggregation, there are few inferior goods. Adding up all spending, the richest decile spend 5.7 times as much as the poor. Among the highest ratios are:
Computer software & games = 48.0
Sports equipment & admissions = 32.7
Cinema = 30.0
Rail & tube fares = 20.8
Vehicle purchase = 17.9
Package holidays = 14.2
Wine = 10.2
Men's underwear = 10.0
Petrol 9.9
Among the lowest ratios are:
Electricity & gas = 2.3
Newspapers = 1.6
Gambling = 1.5
Bus fares = 1.3
Sugar & jams = 1.3
Now, these figures are skewed by the fact that richer households are larger than poorer ones, with an average of 3.1 members rather than 1.3, which means the rich are more likely to have kids. And the poorest decile are more likely to be women - which goes some way to explaining the weird fact that the rich spend a lot more on men's grundies than the poor.
One thing that stands out here is the high ratios for rail fares and petrol, which suggests that these travel expenses are luxury goods. By contrast, the low ratios for electricity and gas and for bus fares suggest that price rises for these have regressive effects.
One other thing. The above numbers miss out some other expenses. The richest decile pay 176.6 times more in income tax than the poorest, 466 times more in National Insurance, and save 110 times as much.
* Hemingway's famous retort - "yes, they've got more money" - is apocryphal.
December 3, 2012
On wage and profit shares
Tim fears that the "profits are screwing the workers” meme is catching on. My chart, I hope, might shed light here.It shows the share of profits and employee compensation (wages plus employers' NICs) in GDP*.My chart starts in 1955, when the ONS's quarterly GDP data began.For me, a few points stand out: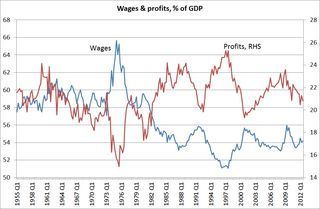
1. The wage share was unusually high in the mid-70s, and the profit share unusually low. It is, therefore a little misleading to speak of changes in income distribution since the mid-70s. Profits then were so low that they either had to rebound or capitalism would have collapsed.
2.The wage share is lower now than it was at any time up to the early 80s. However, this reflects not so much a high profit share as a rise in self-employment incomes.
3. Since the mid-90s, the wage share has risen and profit share fallen.
4.During the recession, there has actually been a shift in incomes from profits to wages. Since 2007Q4, the wage share in GDP has risen by one percentage point and the profit share has fallen by almost two percentage points - thanks to lower oil and financial profits; non-oil, non-financial profits have held up (table K1 of this pdf).
The general message I take from this is that the claim "capitalists exploit workers" is a general statement about the nature of capitalism. It might be true or false - I think true but that's another tale - but it is no truer or falser now than normal.Insofar as workers' living standards are being squeezed, it's because of the recession and stagnation in productivity, not because the rate of capitalist exploitation has increased to unusually high levels.
* I'm using employee compensation because only these data are, so far, available for Q3.
December 1, 2012
Benefit spending: a quick history
Declan Gaffney has pointed out that the Daily Mail's claim that benefit spending accounts for 24.2% of "Britain's total income" is as truthful as we'd expect from the Mail - which is to say, utter bollocks. My chart shows the true picture; benefits data come from the DWP and GDP from ONS*.
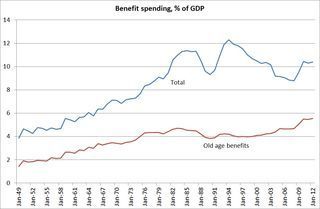 This shows that the share of benefit spending in GDP rose steadily from the late 40s to early 80s, but has since levelled off. In fact, benefit spending in 2011-12 accounted for 10.4% of GDP, less than in the mid-80s or mid-90s.
Note too that benefit spending as a share of GDP fell during the last Labour government.
Also, over half of benefit spending goes to pensioners. The state pension, pension credit and winter fuel payments now account for 5.5% of GDP, compared to 4% in 1997 and less than 2% in the early 50s. This reflects less miserly pensions, plus an ageing population.
Also, since the early 80s, benefit spending has been strongly counter-cyclical. It rose in the early 80s as unemployment rose, fell during the late 80s boom, rose again in the early 90s recession, and fell during the long expansion of the 90s and 00s - a fall which has since been reversed. This suggests that what Keynes said in 1933 is still relevant today: "Look after unemployment and the budget will look after itself."
* Quarterly GDP data are only available from 1955. I've estimated financial year data pre-55 by interpolating annual data.
November 30, 2012
Welfare cycles
Tim asks an intelligent and important question:
Which comes first? The trust that allows a high-tax high-benefit society? Or the high-tax high-benefit society that engenders the trust?
It's certainly true that equality, trust and economic success go together, but as Tim says, disentangling cause and effect are tricky.
This, I suspect, goes to show just how damned difficult the social sciences are.
Think of it this way. There are (at least) two mechanisms here.
1. The causal link between inequality and trust isn't necessarily linear. As Eric Uslaner has stressed, a big cause of distrust is segregation; people distrust people they have little contact with. This implies that small changes in income equality - the sort that don't change social relations between rich and poor - might not affect trust. But bigger changes, which lead to the rich living in gated "communities" and the poor in ghettos would reduce distrust. This means there might also be long time lags between rising inequality and distrust.
2.Trust can be cyclical. When trust is high, people have an incentive to exploit others' trust - by being conmen or welfare scroungers, say - and their bad behaviour leads to increasing distrust.But when distrust is very low, people have fewer opportunities to behave badly - because no-one trusts them with their money - and this leads to more trustworthy behaviour and then to greater levels of trust.
We can see the current popularity of tougher rules for welfare claimants as an example of mechanism 1; the poor, confined to housing estates, are segregated from others, which causes those others to fear they are "scrounging". It's possible that the continued segregation - exacerbated by housing benefit cuts - will strengthen this mechanism.
But eventually mechanism 2 might take over. As life on welfare becomes (even) less pleasant, we'll have (even) fewer "scroungers", and this might lead the median voter to become more supportive fo higher benefits. He might eventually figure: "I'm hearing less about 'scroungers' and welfare benefits seem mean. We should raise them."
In this way, cycles of trust can generate cycles of welfare benefits. We're on the downward part of the cycle now, but we might not remain so. The history of the UK welfare state is more one of fluctuating levels of provision than ever-increases or ever-decreases.
Herein, though, lies a problem. Both these mechanisms contain time lags of unknowable length. Also, we cannot see in advance the relative power of these mechanisms. This implies that we cannot know when the cycle will turn.
For me, this just confirms Jon Elster's wisdom. The social sciences are not a body of laws and deep parameters, but rather a ragbag of mechanisms, some obscure. We might be able to identify which mechanisms worked after the fact. But we cannot use them to make forecasts.
Chris Dillow's Blog

- Chris Dillow's profile
- 2 followers

