
Harry S. Dent Jr.'s Blog, page 86
April 10, 2017
Do You Own the Worst Stock in the Market?
 Great companies can be bad stocks.
Now, that sounds like a neat, pithy phrase to throw around (feel free to borrow it!), but it can be a lot more nuanced than you might expect. For example, if the current valuation fully reflects a company’s prospects, then there’s little opportunity to outperform even if the company is “great.” In addition, stocks move up and down 20% or more on a regular basis. Just because a stock is declining doesn’t mean the company is “bad.”
Parsing the difference between “good” and “bad” is my wheelhouse. Let me show you.
I recently updated my earnings-quality software, and I saw that one of the worst stocks in the market is regarded as a “great” company. The company is in a stodgy and stable business, has a brand name, and been in business over 100 years.
But, the numbers have deteriorated in recent quarters and the overall earnings quality score suggests that stock is one of the worst to own in the S&P 500.
Let’s take a look at the metrics that my software spat out:
Revenue Quality: F
Based on the cash-flow statement of the annual report, receivables continued to rise excluding the effect of acquisitions. Lengthening collection terms when a company is facing material slowdowns in revenue growth increases the risk that the company pulled forward future revenue into the current quarter.
Cash Flow Quality: F
Due to acquisition accounting, companies obtain a benefit to operating cash flows while the cost of the acquisition is treated as an investing cash flow. Despite this benefit, the company’s cash flow quality has deteriorated. Free cash flow has plummeted to negative levels while operating cash flow on a trailing 12-month basis is exhibiting the worst trends in years.
Earnings Quality: F
The company consistently generates negative “Cash EPS” quarter after quarter. This is my proprietary metric that measures the degree a company uses the balance sheet to influence quarterly earnings. The company scores very poor marks here. In addition, the spread between EBITDA Margins to Operating Cash Flow Margins as started to widen considerably post acquisition activity. This is a sign that profits are not translating into sustainable cash flows.
Expectations Analysis: C
The company scores in the middle of the road here. Its business doesn’t illicit a lot of excitement on the part of the investment community. Estimates have been coming down. However, earnings quality continues to deteriorate. If the company were to issue an earnings warning, there’s still significant risk of estimate reductions by Wall Street.
Valuation: F
While the business is stodgy, it could be perceived as a “safe” stock. The stock trades at a huge premium to sustainable cash flows and about 30% higher relative to revenue than it did three years ago.
Shareholder Yield: F
Share count increases, a sub-par dividend yield, and increasing leverage all result in a poor score for shareholder yield. In addition, while its acquisitions are relatively new, the fundamentals are showing deterioration. This increases the risk that quality cash flows will not be available in future quarters to pay shareholders first.
On top of that ugly report card, the stock is already diverging from the S&P 500 index in a declining trend. This is obvious by pulling up a chart, printing it out, taping it on a wall, and standing six feet away.
But, to be more precise, the stock is trading below both the 50- and 200-day moving averages and the relative strength rating is weakening.
When the overall market is strong but a stock’s price performance is already starting to fade given the overvalued, overbought, and overly optimistic about the broader indexes, it is not a good sign. That may seem obvious to you, but making that sort of investment call in real time can be the difference between a modest gain and total bust.
Day after day, we’re bombarded with headlines and percentages. The rumor mill is always in motion, and it’s easy to be influenced by the day to day (or even hour to hour!) fluctuations that ripple through the markets. At the end of the trading day, companies can’t escape their fundamentals, and sometimes it takes work (not simply skimming a couple articles or listening to the latest talking heads) to make sense of it all.
I named my trading service Forensic Investor because that’s what I am – I’m a forensic investor, digging through the data to figure out what’s really going on in the stock market. They’re probably not going to make a TV show out of my work, but it’s pretty profitable stuff. Take a look if you’re interested.
Good investing,

John Del Vecchio
Editor, Hidden Profits

The post Do You Own the Worst Stock in the Market? appeared first on Economy and Markets.


April 7, 2017
I’ve Got My List and I’m Sticking To It
 As I write this, the markets are still near all-time highs and long-term Treasury rates sit at just under 3%.
Because the Fed seems to have met its dual mandate from Congress (full employment and low inflation), the Fed is expected to hike rates another two or three times this year.
And with that, it seems like all is well with our economy chugging along at 2% (even though first quarter GDP is estimated at 0.9%), inflation has hit the Fed’s target at 2%, unemployment is low, and wages are rising. But really, is everything all that great?
I put together my list of potential pitfalls for the markets, especially the interest-rate markets. This list is by no means everything (anyone claiming to have a crystal ball is trying to sell you something), but in my estimation, it does contain the crucial ones.
Let’s start with an easy one: bad news. Despite a never-ending stream of venomous commentary and ominous reporting, bad news hasn’t put much downward pressure on the markets. Despite taking a big loss on healthcare reform, Trump has rolled back enough regulation and pushed hard enough for tax reform to keep the markets happy. Defeat or setbacks in Trumps’ fiscal or tax agenda could reverse the trend though.
Even if Trump does get his fiscal agenda through, the Congressional Budget Office (CBO) has a dire warning about our government debt and deficits (and really, if you’re been paying attention, these warnings should not be surprising). If spending isn’t reigned in substantially, the CBO estimates show debt-to-GDP will rise to 150% in 2047 and our deficit would increase to just under 10%. Entitlements and rising interest rates are the big factors in their calculations. The CBO isn’t predicting when there will be a fiscal crisis, but odds are rising without any sort of a fix.
But forget the CBO estimates 30 years down the road – the White House and Congress need to get a budget or continuing resolution passed or we’ll see a government shutdown by the end of this month! Trump wants an increase in military spending while cutting social programs and funding his border wall… good luck with that!
Let’s talk interest rates, my bread and butter. The Fed-fueled stimulus packages and abnormally low interest rates of the last eight years have been good to real estate. Home prices have exceeded those before the last bubble popped in 2007, so I have to ask, are we in another housing bubble? Boston Fed President Eric Rosengren said in a speech last month that another housing collapse could have a major impact on financial stability. He isn’t predicting that it will happen, but low interest rates and rising property values are a concern because rising rates and falling values could cause major financial stress throughout the banking system, not to mention another hit on leveraged real estate owners. Was that the Fed admitting a policy mistake? See what Harry had to say about this earlier this week in Economy & Markets.
Low interest rates have also been kind to the auto industry. Subprime and ordinary loans are reaching levels of delinquency not seen since 2009. Auto sales reported this week were much lower than expected and used car prices are crashing. Another fiasco in the cards?
Harry has written about the trillion-dollar student loan debt bubble that’s been percolating for years (see here and here, for instance). More than one in four loans are in default today and it was only one in nine just 10 years ago. Tuition is only going up, up, and up. How much longer can this trend go on?
The final bullet point on my list: global events. Last week, the UK triggered Article 50 to begin its exit from the European Union. So far, Brexit hasn’t been that big a deal for the markets, but again, negotiations are just starting and won’t conclude for another two years. How friendly (or not) the negotiations are might have an impact on the markets.
Elections in France could result in political turmoil if Marine Le Pen is elected. Her priorities include France’s national interests ahead of the European Union’s, and if election could spell a possible exit from the EU like that of the UK. Her election later this month could also have a major impact on the markets like Brexit and Trump’s election did.
Remember Greece? They were bailed out, and it’s nearing time to do so again. What will the EU do this time? Kick the can down the road, or take a default in the teeth?
China’s real-estate bubble and debt bubble haven’t been mentioned in a while. There’s the issue of their pesky, nuclear-enabled neighbor, North Korea. Trump met with China’s leader this week with many items on his agenda like currency manipulation, trade inequality, and North Korea’s increasing nuclear threat.
Russia’s meddling throughout the world has irked the U.S. for years. Putin’s backing of Syria’s regime is another sticking point on the U.S. war on terror. Will Trump get tougher or will Putin push even harder?
The above list isn’t exhaustive, but I keep it close because market volatility is often linked with these bullet points – and that’s good for Treasury Profits Accelerator readers! We make money when the Treasury bond markets overreact!
Good investing,

Lance Gaitan
Editor, Treasury Profits Accelerator

The post I’ve Got My List and I’m Sticking To It appeared first on Economy and Markets.
April 6, 2017
Here’s to Last-Minute Tax Moves
 It’s almost tax filing deadline day. Pop the balloons and streamers, right?
But, really, it’s almost here.
The federal income tax filing deadline this year is less than two weeks away, on Tuesday, April 18.
Why am I bringing this up? One, a reminder can’t hurt; but two, as editor of Dent Research’s 401k Advisor, in addition to my duties as portfolio manager of Boom & Bust and editor of Peak Income, I’ve got last-minute 401(k) tax breaks on my mind.
If you’ve read some of my work before, you know I’m all about tax breaks. I don’t believe in giving the government a single red cent if I can legally avoid it. And there’s no better place to create some advantages for yourself than with your 401(k).
I recommend you max out your 401(k) by contributing the full $18,000 (or $24,000 if you’re 50 or older). But contributing anything to a 401(k) is a good start.
Even more so if your employer matches any contributions. Not all offer that benefit, but if they’re kind and able enough, that’s free money on the table.
I’ve said it before, but this is so important: Since every dollar you divert to your 401(k) avoids taxation, the “returns” you get from playing keep away from Uncle Sam, and employer matching, crush the returns you’re likely to earn from the investments themselves.
We’re talking bigger than 40% “returns” for those in the highest tax brackets. Think about that, and then think about the fact that, as Rodney wrote earlier this week, 40% of Americans over 62 have less than $25,000 in financial assets.
At this point, you can’t contribute any additional 2016 funds into your employer’s 401(k) plan. Those contributions had to be taken from your paycheck by December 31.
But you might have some other options at your disposal to lower your tax bill and pad your retirement nest egg.
If you or your spouse have access to a 401(k) at work, you might also be able to make a deductible contribution to a Traditional IRA, if your income falls below a certain limit.
But even if you earn too much to make a deductible contribution, you can make a non-deductible contribution that would still benefit from tax-free dividend, interest, and capital gains compounding.
A Roth IRA is also a great long-term savings vehicle. You get no immediate tax break, but your earnings would grow tax-free over time and, unlike with the Traditional IRA, there are no required minimum distributions once you turn 70½.
For another last-minute tax fix, consider a Health Savings Account (HSA). Due to the massive inflation in healthcare costs over the past decade, more Americans than ever have been corralled into high-deductible health insurance plans, many of which come with access to an HSA.
I personally pay cash for my medical expenses and use my HSA as a “spillover” IRA, though I should be very clear that IRAs and HSAs are very different vehicles when it comes to withdrawal fees and investment options. Though they do have the same contribution cut off: the April 18 tax filing deadline.
I write in more detail about these type of tax-break options, how to approach the Trump Rally with your retirement accounts, and update our first-quarter performance in the latest edition of Dent 401k Advisor, which subscribers received this week.
Coincidentally, we’ve just re-opened access to one of Dent Research’s most elite level memberships. Among many other benefits, you get lifetime access to 401k Advisor. That’s a good thing, if we do say so ourselves.
But there’s limited time and room to sign up. We only have space for 150 new subscribers, and spots are going fast. Get yours now.
Until next time,

Charles Sizemore
Boom & Bust Portfolio Manager

The post Here’s to Last-Minute Tax Moves appeared first on Economy and Markets.
April 5, 2017
Chinese Stocks Beating U.S. Stocks in 2017
 As I told my Cycle 9 Alert readers yesterday, Trump has long talked tough on China, calling it a currency manipulator and blaming it for manufacturing job losses in the U.S.
The tenuous relationship between the world’s #1 and #2 economies is coming into focus this week, as Chinese President Xi Jinping is scheduled to meet with Trump on Thursday and Friday at Mar-a-Lago.
Everyone is, of course, speculating how the meeting will go. But frankly, no one really knows.
My advice is simple: follow the money, not the news.
You see, it’s been exactly 100 trading days since Trump’s election win and he’s still dominating the news cycle. But if you’re only following the news, you may be missing out on a major turning point in the performance of U.S. and foreign stock markets.
Specific to U.S. equity markets, the immediate reaction to Trump’s win has been labeled the “Trump bump.” U.S. markets soared, leaving foreign markets in the dust between early November and late December.
But this year has played out differently, so far.
Foreign stock markets have outpaced U.S. markets. I suppose we could call it the “Trump slump.”
Let’s take a closer look at the sudden shift…
U.S. small-cap stocks were the biggest beneficiary of the Trump bump, between November 7 and the end of 2016. The Russell 2000 gained 14.3% in less than two months.
European markets lagged, gaining only around 3%.
Chinese stocks (FXI) lost nearly 6% over the same time.
And Mexican stocks took a beating on all the border-wall talk, losing a whopping 16%!
The one positive foreign-market outlier was Russia (RSX), which was up almost 18% during the Trump bump.
On the currency front, the U.S. dollar jumped 5.7% in those last two months of the year, while the China’s and Japan’s currencies slumped 4% and 11%, respectively.
But since then, the outperformance of U.S. markets over foreign markets has completely reversed. So far this year…
U.S. stock indices have edged only around 3% higher in 2017.
Meanwhile, European stocks are up about 8%.
Chinese and emerging-market stocks are up 11%.
And ol’ beaten-down Mexico is up a fat 18%, the most of any major foreign market.
Russia’s Trump bump also turned into a slump, as Russian stocks have lost 2% so far this year.
The U.S. dollar is down nearly 3% in 2017, while the yuan and the yen are up between 5% and 6% so far.
Bottom-line: U.S. markets are slumping this year, as money pours into foreign markets instead.
I’ve spent the past week probing foreign market buy opportunities for my Cycle 9 Alert subscribers. And all of my research points to the same place…
China
There are a growing number of ETFs that give investors exposure to China – everything from H-shares (traded by institutions in Hong Kong) to A-shares (traded only on the mainland)…
From small-cap to large-cap…
And including specific sectors of the Chinese economy, from real estate to technology to consumer goods.
On average, a basket of about 20 of these diversified China ETFs lost around 7% between November 7 and the end of 2016. So far in 2017, the same basket of ETFs is up 14%!
The depth and breadth of buying activity in Chinese stocks is too significant to ignore.
My Cycle 9 Alert algorithm has been triggering buy alerts on a majority of these ETFs, as well as on a growing number of individual Chinese stocks – many of which are top holdings of the ETFs.
In fact, of the 20 China ETFs I mentioned above, a full 16 of them have triggered Cycle 9 Alert buy signals in the last week or so. That means a wide swatch of the Chinese equity market is currently in a longer-term uptrend… and also showing market-beating momentum, relative to the S&P 500.
Those are the two key criteria I look for in Cycle 9 Alert – so China is now a buy for us.
It’s impossible to predict how Trump’s meeting with President Jinping will go, let alone how investors will interpret and extrapolate it. And there’s no way of knowing when or if the Trump “slump” will switch back to a Trump “bump.”
But all of my indicators are pointing to a higher-than-average likelihood that Chinese markets will continue to outpace U.S. markets for at least the next two to three months, which is the typical holding period for our Cycle 9 Alert trades.
As I said earlier, and as I told Cycle 9 Alert readers yesterday, it’s better to follow the money than to follow the news.
Ignore the drivel that comes from the Trump-Jinping meeting this week and instead take a closer look at Chinese stocks.
To good profits,

Adam O’Dell
Editor, Cycle 9 Alert
Follow me on Twitter @InvestWithAdam

The post Chinese Stocks Beating U.S. Stocks in 2017 appeared first on Economy and Markets.
April 4, 2017
The $1 Billion Bargain
[image error]The coolest house I ever saw wasn’t a house. It’s Antilia… a 27-story skyscraper in Mumbai. Mukesh Ambani, chairman of the second-largest oil and gas company in India, Reliance Industries, built it for a cool $1 billion.
Just look at this magnificent building…
 Bill Gates should be envious. Who else has a 27-story skyscraper in the heart of the hottest city in their country? It has six levels just for parking! And three helipads. Man! Imagine the parties you could throw there!
For a billion dollars, Antilia is a bargain. It’s 400,000 square feet of living space in the best part of one of the largest and most dense cities in the world. When you break that down, it works out to be just $2,500 a square foot.
Compare that to the top penthouses on Central Park these days.
In 2012, the most expensive was the 6,744 square feet at 15 Central Park West. It cost Sandy Weill, former chief of Citibank, $13,049 a square foot.
The first condo to break the $100 million mark, in 2015, was at One 57 on South Central Park. It cost $9,136 per square foot.
Now the leading-edge penthouse at the newest 220 Central Park is being offered at $250 million for 23,000 square feet. For four floors and 16 bedrooms in the hottest part of Manhattan, you only have to fork over $10,870 per square foot.
We whisked by the $200 million mark without blinking.
And buyers think these are bargains?!
Do you know how I spell these bargains?
B – U – B – B – L – E!
Even our Australian subscribers, who live in the uber-bubbly cities of Sydney and Melbourne, are wondering what the hell we’re smoking over here!
Of course, it can’t just stop there. Beverly Hills won’t be outdone!
Jaws were dropping when a 53,000-square-foot property with vineyards was listed for $195 million. Hey, that’s only $3,679 per square foot.
Now there’s a new listing in Bel Air for… you guessed it… a whopping $250 million! There must be some kind of billionaire club you can only join if you buy a home for at least a quarter of a billion dollars.
And guess what the developer had to say about this new listing? “Why would a billionaire pay $220 million for a yacht, and not that or more for his house?”
That’s bubble logic if I’ve ever heard it.
Look at this photograph…
 This house is 38,000 square feet. It has 12 bedrooms, 21 bathrooms (rich people must need to pee more from all the champagne they drink at the house’s five bars), three kitchens, a four-lane bowling alley, an 85-foot infinity pool with an outdoor pop-up theater-size movie screen, and an indoor 40-seat movie theater… and of course, a helipad on top. Don’t even look at the car and candy collections inside.
At $6,578 a square foot, this is perhaps the highest price ever asked for a suburban mansion.
Personally, I’d take the $2,500-per-square-foot skyscraper in Mumbai over any of these local houses. It’s a bargain in bubbleville.

Harry
Follow me on Twitter @harrydentjr

The post The $1 Billion Bargain appeared first on Economy and Markets.
April 3, 2017
Wasting Away Again in Margaritaville
 I grew up around the Gulf Coast and spent a fair amount of my childhood on the water and the beach. I can handle a power boat, I can sail, and I know what to do in riptides.
I also know the words to most Jimmy Buffett songs, which is sort of a prerequisite for beach life.
My Parrothead (as his fans are called) training started when I a kid, with songs like “Son of a Son of a Sailor,” “Margaritaville,” and “Come Monday.”
But as time went on, and I heard more of the songs that never made it to the radio, I became a fan of his less popular tunes like “African Friend” and “Conky Tonkin.”
College took me away from the coast, as did a stint in Wyoming, a few years in New York, and then a long stay in Dallas. But when I moved back to Florida in the mid-2000s, I quickly rediscovered my beach-life roots and my affinity for Jimmy Buffett music. I guess you could say it was with me all the time, whether I realized it or not.
I’m not a zealous fan – I’ve only been to a few concerts – but I pay attention to Parrothead-related news articles.
Listen to this one…
If I wanted to, I can now plan to spend my golden years in Margaritaville, and so can everyone else.
Florida-based homebuilder Minto Communities just last week broke ground on its new adult-living community concept, Latitude Margaritaville, in Daytona Beach, Florida.
Apparently, Jimmy Buffett partnered with the builder to create a “safe space” for aging Parrotheads who want to spend their retirement years in an alternate state of mind.
Chalk this compound up as another shrewd business move, along with the dozens of Margaritaville restaurants, hotels and casinos, and Landshark beer. (No wonder Buffett was reportedly worth $550 million last year.)
With millions of boomers barreling toward retirement, we’ll need as many of these communities as we can get… and it still won’t be enough.
Today 14% of Americans, or 45 million people, are 65 or older. By 2030, that number will be 65 million. We, as a country, have no plan to deal with 20 million more retirees.
Over the last 15 years, the number of skilled nursing homes in the U.S. remained flat at about 15,000, and will actually shrink by up to 20% by 2020. Clearly these facilities aren’t closing because of lack of demand. Instead, it’s lack of funding.
Most nursing facilities are paid for by Medicare and Medicaid. About 10% of patients pay on their own. Since the 1990s, government payment for care failed to keep pace with rising costs. Nursing facilities routinely lose money on Medicaid patients.
To meet rising demand in the face of limited nursing facilities, we started using more assisted living facilities and increased caring for the elderly in their homes. These approaches save money by shifting the burden of care to less skilled workers and family members, which gets to the crux of the problem.
The biggest obstacle isn’t where people live, it’s how they live.
As we face the daunting task of compassionately caring for this fast-growing segment of our population, assisted living and in-home care could be the best approach, because the problem of cash – or rather, no cash – remains.
Cool compounds like Latitude Margaritaville make for a good story, but they won’t be the norm.
Forty percent of Americans over 62 have less than $25,000 in financial assets. They might have equity in their home, and will be in line for Social Security when the time comes, but they can’t lay their hands on a chunk of cash to pay for a spot in a senior community.
Instead, they’ll most likely remain where they are, living a simpler life and aging in place. Without notable financial resources, it will take the combined efforts of the local community and family members to make sure this happens with care and dignity.
In some respects, technology will help. Through Internet devices and smartphones, we can see if our aging relatives have taken their medicine, if they’ve picked up the morning paper, where they are, or even if they’ve taken food out of the fridge.
But technology has its limitations.
Unless you have a very advanced, very expensive robot, you won’t get help getting dressed, getting out of bed, or bathing without another person or two. Beyond family and outreach programs, we rely on the home health aide industry, which is expected to add at least 300,000 jobs over the next decade, but can’t attract enough people.
And just like most other things, the problem comes down to cash.
Home health aides make an average of $22,400. To attract more workers, we have to pay higher wages. But the funds to pay those wages come from the modest assets of seniors, their families (who have their own financial issues), and the government. This puts us at something of an impasse.
I don’t think seniors will suddenly have more money, and I don’t see the cost of care getting cheaper. Which leaves one big, and expensive, proposition.
More government funding.
There are a lot of ways the government – be it local or federal – could contribute. We could offer bigger tax incentives or refundable credits to family caregivers, give home health aides special tax breaks, or simply allocate more funds to pay for services.
But they all mean the same thing. Higher taxes.
This isn’t unexpected. We all knew that as the boomers retired it would cost more to support them. But that doesn’t make it easier on the wallet.
As I gathered the documents I needed to file my taxes over the last month, I thought about how this situation will unfold in the years to come.
I’ll pay more to Uncle Sam, and having more margaritas won’t make it change. But with the right music in the background, it might be a little easier to swallow. Maybe I should go waste away in Margaritaville.

Rodney Johnson
Follow me on Twitter @RJHSDent
P.S. In case you’ve missed it, we’ve re-opened access to one of our most elite level memberships at Dent Research. By signing up, you’ll get exclusive research from Harry, myself and our team, and discounts on things like the Irrational Economic Summit. Plus, we’ll pay for your Boom & Bust subscription. But this “next level” membership is only available for a limited time, so grab your spot now.

The post Wasting Away Again in Margaritaville appeared first on Economy and Markets.
March 31, 2017
If I Were To Start My Third Hedge Fund…
As the great New York Yankee Yogi Berra once said, “It’s like déjà vu all over again.”
That’s the way I feel about the markets.
I started my first hedge fund in 2002 to capitalize on what I thought would be the collapse of Internet and technology stocks. The sector dominated the market but lacked the revenues to support their valuations. Many stocks were overvalued by an infinite amount as their share value evaporated into dust.
That strategy worked out masterfully – if I may say so myself!
I started my second hedge fund in the fourth quarter of 2007 to capitalize on what I thought would be the collapse of the Housing Bubble. Individuals became addicted to using the equity in their homes to fund their extravagant lifestyle of Cadillac Escalades and a brand new flat-panel TV for every room in the house. The obvious sign that this house of cards was about to implode was when the pace of mortgage equity withdrawals slowed and homeowners could no longer fund their conspicuous consumption.
That worked out even better – sensing a pattern, here?
If I were to start my third hedge fund, it would be right here, right now.
The probabilities of a serious market decline have not been better in years. The stock market remains overvalued on numerous metrics. But unlike the Internet Bubble where market valuations were skewed by a few wildly overpriced stocks, everything is now overvalued.
There is nowhere to hide.
Since 1966, the median price-to-sales ratio on the S&P 500 has never been higher at 2.4x. Never. For perspective, the ratio was 0.80 during the market lows in 2009. That’s a massive surge in the valuation in equities relative to revenue over that period of time.
Meanwhile, profit margins are topping out. Expectations are high but the earnings required to meet those expectations are getting tougher to generate. But, those earnings are being priced dearly too. The median price/earnings ratio on the S&P 500 is 24x. That a level that as only been eclipsed by the Internet Bubble.
Finally, a little-known valuation indicator invented by Norman Fosback – which has called major market tops and bottoms – is the average price of the 25 cheapest stocks in the S&P 500. When stock prices were completed decimated like they were in 2002 and 2009, this indicator was flashing major buy signals.
Now, it’s as high as it was during the Internet Bubble and much higher than the Housing Bubble. I know people have short memories, but try to remember how many stocks fell 90% or more in both of the last two crises. The higher they go, the harder they fall. You don’t want to get caught in the bloodbath.
Individual investors are as optimistic about the markets as they have been in 30 years. After the presidential election last year, a surge of money flew into equity related exchange traded funds. That continued until recently when the pace of buying fell 50% over the past four weeks. Are buyers tired?
Corporations have also been a big source of fuel for the stock market in recent years. But, their buy-backs are starting to slow. Are they running out of fresh powder to prop up their earnings per share and stock prices?
While I’m primarily a short seller, I am not a permabear. I do, however, think it’s much better to take the opposite side of the trade from the general public because it’s investing very late into this cycle. I’ve seen this movie before. It’s a horror film and it always ends badly.
In Forensic Investor, we’re heavily positioned in a defensive posture. A couple of early 2017 trades were even booked at triple-digit annualized returns. I’ve taken advantage of the overvalued and overbought market conditions to top up other short trades to full position size as the fundamentals have worsened and the technical picture of these stocks has deteriorated.
2017 really could be the best opportunity in nearly a decade to be heavily short the market. Either way I think it will be a wild ride. Buckle up!

John Del Vecchio
Editor, Hidden Profits

The post If I Were To Start My Third Hedge Fund… appeared first on Economy and Markets.
March 30, 2017
Drawdowns: “Active” versus “Passive”
December 13, 2016, was a historic day.
The Nasdaq 100 (QQQ) closed above $120 for the first time in almost 17 years!
That’s right… anyone who bought the Nasdaq in early 2000, just before the March 24 peak, has been suffering through a 17-year-long drawdown.
Can you imagine waiting that long just to get your money back? Never mind actually making a profit!
I know… I know… you’ve had “buy and hold” preached at you for all of your investing career. You’ve been told the “hold” part is psychologically difficult, but ultimately worth it in the end.
But is it really worth it?
Or, is there a better way through “active” investing?
We’ll answer that question today.
Before we do that, realize that drawdowns are a simple fact of life in investing. Sometimes they’re small and short. Sometimes they’re large and long.
You can work to minimize drawdowns (that’s risk management). But you can’t eliminate them.
So what does the typical drawdown – for both “buy and hold” and “active” strategies – look like?
Look at this chart from Ben Carlson’s blog, A Wealth of Common Sense.
 He crunched the numbers and determined that the S&P 500 spends…
13% of its time in a 5% to 10% drawdown,
13% of its time in a 10% to 20% drawdown, and
23% of its time in a drawdown greater than 20%
The S&P 500 has been in drawdown more than 70% of the time, since 1927!
And at least half the time, buy-and-hold portfolios were in a drawdown of 5% or more.
Since most investors panic-sell during drawdowns – particularly those bigger than 20% – it’s easy to see why the “hold” part of buy-and-hold is so difficult (psychologically) and damaging (economically).
This situation is not unique to the S&P 500. It’s the typical state of all equity markets, across all time periods: most of the time in drawdown; occasionally making new highs.
But it’s been even worse than that for the tech-heavy Nasdaq 100 ever since the turn of the century. I ran those numbers myself, by analyzing the drawdowns of the PowerShares Nasdaq 100 ETF (Nasdaq: QQQ).
Since 1999, the Nasdaq has spent a full 98% of its time in drawdown!
84% of the time, it’s been in a 20%-plus drawdown.
It’s minted new all-time highs just 2% of the time.
That’s rough!
Show me a human investor and I’ll show you an investor who likely gave up and sold out somewhere along that 17-year journey of drawdown agony! (Did you?)
Active investing is often painted as being riskier than passive, buy-and-hold investing. But nothing is further from the truth – particularly when it comes to the risk of abandoning your strategy during a psychologically-trying drawdown.
As I’ve said, you can’t eliminate drawdowns, but you can minimize them. That’s called risk management, and it’s exactly what active strategies, like Cycle 9 Alert, are designed to do.
To prove it, I applied my Cycle 9 Alert algorithm to all 100 individual stocks in the Nasdaq 100 – going back to the same starting point of 1999. And then I’ve compared the performance of my active strategy to the performance of buy-and-hold. Take a look at the results…
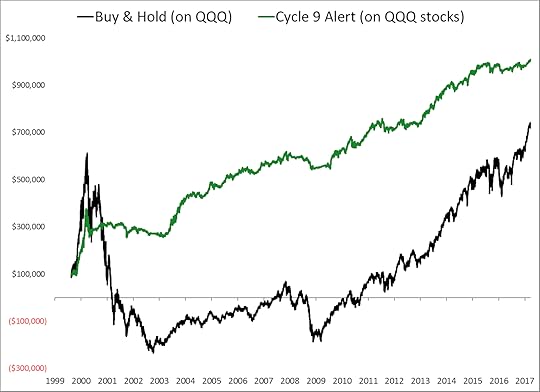 As you can see, not only would the active Cycle 9 strategy have produced more total profits over the entire period, it would have done so with milder drawdowns… quicker recoveries… and many more “new all-time highs.”
Take a look at this table, which summarizes the amount of time spent in each drawdown category…
 All told, my message today is simple.
You must get used to the psychological rub of drawdowns. But you do not have to accept the large-and-long drawdowns inherent in buy-and-hold.
Active strategies, like Cycle 9 Alert, work to minimize drawdowns – both their degree of severity and their duration.
I’m sure you’ll agree with me… living through mild drawdowns is easier than large drawdowns. And making new all-time highs often is easier than waiting year after year to simply get your money back.
To the extent that active strategies minimize drawdowns, they help investors stick to the strategy – which is the key to profitability in the long run.
So the next time you hear someone tell you that passive investing is safer than active investing… set them straight!
And if you’re not already benefitting from the drawdown-reducing feature of active strategies, now is a great time to take a look at my Cycle 9 Alert service.

Adam O’Dell
Editor, Cycle 9 Alert
Follow me on Twitter @InvestWithAdam
P.S. Right now we’ve opened up elite-level membership at Dent Research. We only have a limited number of spots available every 12 to 18 months and they’re usually snapped up quickly. As a member of this special group, you gain access to exclusive research from Harry Dent, significant discounts to Irrational Economic Summit, and we pay for your subscription to Boom & Bust. This is on a first-come-first-serve basis. You’ll find all the information you need here.

The post Drawdowns: “Active” versus “Passive” appeared first on Economy and Markets.
March 29, 2017
With Friends Like These…
Cartels are a tough thing.
The goal is for a small group of influential producers to artificially move a market away from its normal equilibrium, and eventually squeeze more money from buyers to boost profits.
Members rely on each other to do their part, be it charging higher prices, holding back supply, or flooding the market to drive out marginal players.
At their core, cartels require people who want to steal more profit from buyers through false market signals to believe each member will do its part. There’s an inherent fear involved: If you’re willing to steal from clients, why not each other?
And therein lies the problem. They just don’t trust each other.
Unless there is some other tie holding the members together, like family or the threat of force, eventually such arrangements break down.
It brings to mind the old adage of “no honor among thieves,” and explains the current price-fixing problem faced by the Organization of the Petroleum Exporting Countries, commonly referred to as OPEC.
Or as I called them in January, the Energy Liars’ Club.
Some members aren’t doing their part, leaving it to others – namely Saudi Arabia – to pick up the slack.
It won’t work, but I really like watching those nations twist in the wind as they try to hold it together.
Here’s what I mean…
A deal struck last November among OPEC nations called for them to cut oil production by around 1.2 million barrels a day, and for cooperating but non-OPEC members, like Russia and Mexico, to join in the fun.
Oil prices shot up by 20% immediately following the announcement, but there was always trouble in paradise.
OPEC wanted to cut production because oil prices had remained stubbornly low, which cut revenue. But when members sell fewer barrels of oil, they obviously limit their income.
The key is for prices to rise high enough to offset the cuts. In this regard, the production limits have worked.
Each country was asked to cut production somewhere between 3% and 4%, with Iran as a notable outlier. That country was allowed not only to forgo a cut, but also to increase production slightly because of separate issues with U.S. sanctions.
With two notable exceptions, most countries have failed to hold production down.
The November deal asked the United Arab Emirates to cut 139,000 barrels, but it only managed to trim 88,000.
Iraq was told to reduce production by 210,000, but only squeezed out 147,000.
Russia, the largest non-OPEC producer to join the effort, was supposed to limit production by 300,000 barrels, but only managed to reduce the flow by 121,000.
While Mexico met its goal of cutting 100,000 barrels, Saudi Arabia, the de facto leader of the group, went well beyond its own goal to make things work for the OPEC cartel. The Arab nation was supposed to cut production by 486,000 barrels, but in February actually trimmed 787,000.
So while most countries failed to meet their pledges, Saudi Arabia has made up the difference. The result? Oil prices have climbed by a higher percentage than the offsetting cuts.
But there is tension under the surface, as pressure mounts both inside and outside the cartel.
Within, the Saudis are bearing the brunt of the efforts, cutting their production by around 7% to keep things going. They’re giving up more revenue than any other member. That’s gotta hurt their pride as much as their pocketbook.
Externally, there’s the little matter of U.S. producers, both offshore and on land. U.S. production rebounded by 400,000 barrels in the last six months, and is expected to increase by another 500,000 barrels by year end.
That will go a long way in making up whatever supply is cut by OPEC and its band of merry men.
The original production cuts were supposed to last six months. Saudi Arabia wants to extend the agreement by another six months… but only if members get closer to their goals, and there’s speculation that the Saudis will require Iran to join the efforts.
This puts OPEC and the cooperating non-OPEC members in a weird place.
They certainly drove prices higher, but through their own actions and due to outside forces, prices have recently fallen. However, if the price-fixing agreement ends, it’s likely that investors will expect rising production across the board and send prices lower.
In this way, the cartel members have set themselves up for almost certain failure.
Whether production rises because they can’t stick to their agreement, the U.S. and others produce a lot more, or some combination of the two, the outcome will be OPEC’s inability to control the markets, sending prices lower.
It couldn’t happen to a nicer bunch.

Rodney Johnson
Follow me on Twitter @RJHSDent
P.S. We’ve just reopened access to one of Dent Research’s most elite wealth resources, Boom & Bust Elite. If you want even more insightful research from Harry, myself and the rest of the team, and want your portfolio to thrive in the coming months and years, don’t miss this opportunity. Only 150 of these “next level” spots are available so make sure to get yours now.

The post With Friends Like These… appeared first on Economy and Markets.
March 28, 2017
What Do You Do With Dividends?
Income investing is a big part of what I do. It’s rare for me to buy a stock that doesn’t pay a respectable dividend, and I have an entire newsletter – Peak Income – dedicated to finding decent yields in a world where most CDs and savings accounts barely yield anything at all.
But you know what’s surprising about all of this?
I don’t plan to retire for at least another 20 years, and I have no need for portfolio income today. I’ve instructed my broker to automatically reinvest my dividends in additional shares. I don’t get paper checks, and I don’t draw a single nickel out of my investment accounts. In fact, I’m aggressively saving and adding new money to them.
So, if I don’t need the income right now… why do I focus so heavily on getting paid?
After all, a dollar earned as a dividend should be no different than a dollar earned as capital gains. As far back as 1961, economists Merton Miller and Franco Modigliani elegantly “proved” that dividend policy is irrelevant to investors. They said whether a dollar in earnings is paid out to investors as a dividend or reinvested in the company, the investors make out the same either way.
Call me the cynical sort, but I’ve always believed that a bird in hand is worth two in the bush.
Whenever I buy a stock, I don’t know that it’s going to rise in value. Sure, I expect it to. I certainly don’t buy stocks that I expect to fall in value. But the market has a mind of its own, and it rarely does what you expect it to do. And it certainly doesn’t care what you want it or need it to do.
When your stocks pay dividends, you’re able to consistently realize real returns, not paper gains that can disappear in a heartbeat. And if you reinvest your dividends, the number of shares you own – and the dividends they pay – will compound with time. Even a boring, slow-growth stock can generate market-beating returns through dividend reinvestment and compounding.
As a case in point, imagine a stock with a $100 stock price and a 5% dividend. If that company raised its dividend by 10% per year, after 10 years you’d be earning a dividend yield on your original investment of 13% per year, plus whatever you earned in capital gains.
But there are other, more philosophical reasons to focus on dividends too. They tend to be a useful tool to hold companies accountable, which in the end, should mean more income and better returns for you.
Dividends keep management honest. It’s a lot harder to cook the books or engage in questionable accounting when you have to produce a dividend every quarter in cold, hard cash. (Incidentally, my friend John Del Vecchio specializes in uncovering accounting shenanigans with his Forensic Investor letter.
Dividends force discipline on management. Most management teams aren’t outright crooks. I would go so far as to say most are actually honest people. But that doesn’t mean they are always looking out for their investors. Management is often guilty of “empire building,” or wasting shareholder money on low-value projects that serve management more than the shareholders. Well, having to come up with cash every quarter to pay the dividend forces management to prioritize where it spends company resources.
Dividends remind management who the boss is. Remember, the guy in the corner office isn’t the boss. He works for you, the shareholder. And sometimes, the arrogant S.O.B has to be reminded of that. Paying the dividend every quarter is a subtle reminder to management that they work for the shareholders and not the other way around.
Getting down to more practical matters, there is another big reason why I’m focused on current income these days: stock valuations.
The U.S. stock market currently trades at a cyclically-adjusted price/earnings ratio of 29.4, which puts it 76% higher than its long-term average. If history is any guide, that implies losses of 1%-2% per year over the next seven to 10 years.
Now, expensive stocks can always get more expensive. But frankly, that’s not a game I want to play.
In Peak Income, I target investments that pay 6%-10% in current income, with the potential for solid capital gains as well. But again, I’m not depending on the capital gains. If they closed the stock market tomorrow and didn’t reopen it for five years, my income investments would still throw off a very decent return.
If you’d like to read more, click here for a free presentation, and start cashing your dividends.
Charles Sizemore
Editor, Peak Investor

The post What Do You Do With Dividends? appeared first on Economy and Markets.


