
Harry S. Dent Jr.'s Blog, page 83
May 22, 2017
Play Music, Get Rich
 As a kid, I used to tease my dad on road trips for tuning in to the classic rock station. It just seemed so stereotypically old-man-ish.
Yet as I approach my 40th birthday, and the inevitable midlife crisis that comes with it, I found myself dusting off my old Metallica And Justice for All CD for the first time in nearly 20 years – and testing the limits of my car stereo.
Hey, it could be worse. At least I didn’t blow my retirement savings on a Ferrari or run away with the secretary.
While I reminisced about my youth, our editorial director, David Dittman, mentioned that he and Metallica frontman James Hetfield both graduated from Brea-Olinda High School in the Los Angeles suburbs.
It seems that, as a young man, Mr. Hetfield already had his life mapped out. In the school’s 1981 yearbook, he listed his future plans as “Play music, get rich.”
Two years later, Metallica released its first album.
Today, with 10 studio albums, nine Grammys, and close to 2,000 (and counting) worldwide shows behind them, the American heavy metal band’s legacy is unquestioned. And Hetfield is worth an estimated $300 million, making him one of the world’s wealthiest living entertainers.
Play music, get rich.
I can’t say this is a viable career plan for those of us less talented than Mr. Hetfield. But give the man credit.
He had specific goals, and he stuck to them. He played music, and he certainly got rich.
I don’t usually look to rock stars for financial advice, but it’s worth asking: Are there any lessons we can learn from Hetfield’s success?
I can think of a few.
To start, surround yourself with smart and motivated people that you trust, and make sure that their interests are aligned with your own.
By coincidence, I met a fellow dad at my son’s school that was one of Metallica’s marketing managers in the 1990s. He told me that the band’s drummer, Lars Ulrich, would regularly show up at meetings with lists of well-prepared questions, and that he’d grill the executives over specific numbers.
Lars knew his stuff… and he was even known to whip out spreadsheets.
Longtime Metallica fans recognize Lars as the brains behind the operation… and without him, it’s likely that Hetfield would have spent his life laboring in obscurity. In fact, the band formed in 1981 when Hetfield, who had been in a few bands as a teenager, responded to a classified ad that Lars took out in the local newspaper.
Lars wasn’t working for charity, of course. He was looking to fatten his own bank account, but in doing so he helped Hetfield and the rest of the band.
So, lesson number one: Whether we’re talking about your career, or even your investment portfolio, surround yourself with smart people who are properly incentivized to help you. They win when you win.
And, number two, stick to what you’re good at… but don’t be afraid to adapt.
Most Metallica fans list Master of Puppets as their all-time favorite album and the title track as their favorite song in the entire catalogue. But the band didn’t stop there. They continued to adapt.
Two albums later they launched Metallica (the “Black Album”) and jumped from a modestly popular band with a mostly cult following to a household name and one of the most commercially successful bands in history.
They stuck with their core strengths as a metal band, but they adapted.
And, to the point about surrounding yourself with talented people that you trust, they also hired producer Bob Rock to help them refine and polish the album and really push it to reach its full potential.
In business and investing, it makes sense to stick to what you’re good at, but you should also adapt and evolve.
If you’re a talented technician or chartist, then you probably shouldn’t try to reinvent yourself as a Warren-Buffett-style value investor. But you should always look for ways to make your models better. Don’t rest on your laurels.
Finally, keep it simple and don’t over-plan.
Hetfield’s stated objective in life was to play music and get rich. Most of the rest of us probably need plans that are a little more concrete than that, but I’m a big believer in having broad, general goals while leaving yourself the flexibility to react quickly as conditions change.
German military strategist Helmuth von Moltke said, “No battle plan survives contact with the enemy.” As boxing legend Mike Tyson put it, a little less eloquently, “Everyone has a plan ‘til they get punched in the mouth.”
Looking at a less violent example, Amazon.com founder Jeff Bezos always imagined that his company would be much more than an online bookstore. He’s said that he always believed it would grow into the biggest retailer in the world.
But when he founded the company in the mid-1990s, he couldn’t have predicted that he’d eventually utilize aerial drones or that he’d copy Uber’s business model of using part-time amateur drivers with Amazon Flex. Drones and Uber hadn’t been invented yet. These were tactical moves Bezos made along the way.
In your business life and in your financial planning, you should absolutely set goals. But give yourself a little leeway in how you reach those goals; break them down into long-term “big-picture” goals and very specific and achievable short-term goals.
It’s how Hetfield and Metallica built their empire – one song at a time.
Now if you’ll excuse me, I have a midlife crisis to get back to. I’m going to jump back in my car and scream the words to Harvester of Sorrow for the next half hour.

Charles Sizemore
Portfolio Manager, Boom & Bust Investor
P.S. If you want a real-life example, look at how my friend Adam O’Dell combines a short-term trading strategy within our longer-term market outlook here at Dent Research. It’s the perfect approach for any market. Click here to learn more.

The post Play Music, Get Rich appeared first on Economy and Markets.


May 19, 2017
The Beauty of Covered Calls
My goal and my promise to Peak Income readers is to secure for them a high and stable income stream, no matter their situation: in retirement, close to retirement, or just even thinking about retirement.
I want paychecks to hit brokerage accounts every month, with consistency and low risk and without worry. No wonder I’m often called a tightwad.
But, as much as the next guy, I also like to snag capital gains when I see a good opportunity.
And, right now, I’m doing just that by looking at a conservative, overseas private income fund that juices its yield…by writing covered calls.
Let me start here: A call option is the right – but not the obligation – to buy a stock at a certain price by a certain time.
Here’s an example.
A May 19, 2017, call option on Apple (Nasdaq: AAPL) with a strike price of $155 would give the buyer the right to purchase 100 shares of Apple at $155 per share on or before May 19.
If Apple closes at $154 per share, the option expires worthless. No one would voluntarily buy a stock at $155 if they could buy it at $154 instead.
But if Apple goes above $155, that option is “in the money” and suddenly has value. If Apple goes to $160 before May 19, the buyer can execute at $155 and pocket a quick, $5-per-share profit.
So you see how this works. Call buyers pay a premium to speculate on stocks that they expect to go higher.
But what about the call seller that takes the other side of the trade?
Their motivation is much different.
They collect the premium from the buyer in the hope that the option expires worthless and they get to keep the full value of the premium. Of course, it doesn’t always work that way.
In our example that saw Apple rise to $160, the option seller would have to buy Apple at the market price of $160 and then turn around and sell it to option buyer for $155 per share, taking a $5-per-share loss.
That’s not a lot of fun.
But it brings me to covered-call writing, the strategy used by a handful of funds in the Peak Income model portfolio. We don’t have a lot of them, but the ones we hold have been good to us.
When you write a covered call, you sell an option on a stock you already own. So, extending our Apple example, if you owned 100 shares of Apple, you could sell a call option against it and pocket the premium.
If the share price doesn’t move above the option’s strike price before expiration, you pocket the premium and whatever modest capital appreciation, along with any dividends paid. That’s your best-case scenario.
In your worst-case scenario, Apple runs higher and your shares are called away from you. But, as far as worst-case scenarios go, it’s really not all that bad.
You still sell your Apple shares at a profit, and you still have the cash you collected when you originally sold the option. Your upside was capped, but no harm was done.
And that’s the beauty of a covered-call strategy. It’s a low-risk way to milk a little extra income out of a stock you own. And we’re not even buying single stocks, like Apple, in Peak Income. We’re buying a fund.
Click here to learn exactly how readers are doing it.

Charles Sizemore
Portfolio Manager, Boom & Bust Investor

The post The Beauty of Covered Calls appeared first on Economy and Markets.
May 18, 2017
Real Value That Pays You First – and Big
 It’s often said in sports that “the best defense is a good offense.” When it comes to investing – and my particular approach to portfolio-building – that means focusing on companies that produce floods of cash and that “pay us first.”
What does “pay us first” mean? Well, it means companies that put shareholders and long-term stability at the top of the priority list.
And when we can buy these rare companies at clearance-sale prices, we have to jump before it’s too late.
Then we sit back, enjoy the dividends and share buybacks, and watch our investments increase in value.
This way, there’s no need to worry about “the market.”
“Buy and hope” is never a good strategy – particularly not now, with the market at all-time highs and the second-longest bull market in history.
It’s easy to kick down barns, however; much harder is crafting solutions. And I have one right now.
As I noted, cheap, cash-gushing companies offer built-in gains, and lately my focus has been on the energy sector.
Now, this corner of the market is certainly cheap. The sector has been a “hot potato” for going on three years, with losses of more than 30% – and as much as 50% at the depths of the selloff – since its mid-2014 highs.
This bear market for oil-and-gas-focused companies was deadly. More than 200 formerly high-flying drillers, transporters, and service-providers crashed into bankruptcy from the start of 2015 through October 2016.
But not all energy businesses are created equal. And because most market thinking is superficial in the near term, I’ve long had my oven mitt on, ready to catch the tastiest energy “hot potato.”
This is where I found the latest addition to my Hidden Profits model portfolio, and it’s hot – in a very good way.
Let’s back up a minute. The oil and gas supply chain is divided into upstream, midstream, and downstream subsectors. Investors usually focus on the first two. “downstream,” gets the least love. Other investors think it’s “too tough.”
Downstream includes refining crude oil into gasoline, diesel, jet fuel, and other essential products. This generates something held in very high regard in this space… Something we like to call “hidden profits,” hence the name of my newsletter.
We go where others are too busy or too occupied to venture. That means we find real values that pay you first – and big.
Plus, right now the cost of inputs for refiners is low and the “crack spread” – the margin between what a refiner pays for oil and rakes in from product sales – has been rising since March. In other words, that’s very bullish indicator.
But not all refiners are created equal. Far from it. There’s one great, highly refined opportunity available to us right now.
Keep in mind that refining is messy. Environmental permits are costly and take forever to secure.
No wonder there hasn’t been a new refinery built in the U.S. since 1977. Or that over half of U.S. refineries have closed since 1984! A well-positioned refiner can easily expand its existing locations, and my find just happens to find itself in the sweetest spot of any other company in the refinery game.
Superficial investors worry about yesterday and today, but I see what’s setting up this forgotten star for a double or more – just by being back in favor. That’s without accounting for growth.
Every part of this company looks great. But the opportunity won’t last
Get this company and its spring-loaded return now!
Good investing,

John Del Vecchio
Editor, Hidden Profits

The post Real Value That Pays You First – and Big appeared first on Economy and Markets.
May 17, 2017
The Evidence that Stocks Are More Overvalued than Ever
[image error]Tuesday morning, the Dow was just 27 points away from 21,000 again!
How can anyone believe this is NOT a bubble?!
Nobel Laureate and economist Robert Shiller developed the best valuation indicator I’ve seen. His cyclically adjusted price-earnings ratio is known as the Shiller P/E, or CAPE.
And he agrees with me: We’re clearly in bubble territory!
Yet Fed Chair Janet Yellen and investing legend Warren Buffett – and way too many other experts and investors – continue to believe otherwise!
They should take notice of what I’m about to say…
Shiller uses the average of the last 10 years’ earnings to smooth out wild fluctuations near tops and when earnings suddenly crash in major recessions or depressions. This makes the model more reliable than the simple price-to-earnings ratio (P/E).
Doing this shows us that we’ve only gone higher twice before, and there are specific reasons for that, which I’ll explain below.
First, look at this chart…
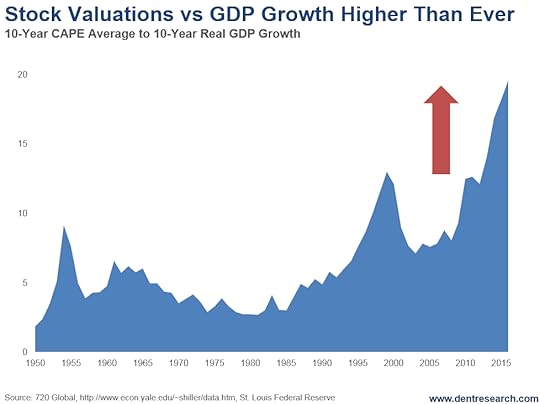 As you can see, we’ve seen several peaks, biggest of which were in 1929, 1999, and now.
So, by saying that we’re not in a bubble, are the experts insinuating that 1929 wasn’t a bubble?
That the 90% crash, the greatest in U.S. history, was just bad luck… a “black swan?”
It certainly seems that way, but then again, most people can only see a bubble with 20/20 hindsight.
It’s true that today’s ratios aren’t as high as 1999, but that’s missing an important detail. That is, stock prices and valuations soared at the turn of the century because my four key cycles were moving up together.
A quick comparison of the 1925-29 bubble, the current bubble, and the tech bubble of 1995 to early 2000, shows what effect this different environment has on valuations.
The 45-year Innovation Cycle peaked in 1920, with the exact peak of the railroad industry. It then turned down into 1942.
The 39-year Generational Spending Wave pointed up strongly into late 1929, with a massive generation of immigrants. Then it crashed and had a secondary high again in 1937 before crashing once more.
The 34-year Geopolitical Cycle turned up in 1915 and peaked in 1930, converging with demographic trends through late 1929.
The 10-year Boom/Bust Cycle turned up in late 1923 and peaked in late 1929. Then it crashed into late 1933, the depths of the Depression.
So, three of my four key indicators converged in an upward arc into late 1929.
All four of them headed downward simultaneously from late 1930 into 1933. During this time, the Shiller CAPE indicator managed to reach only 32.6, but again well after the peak! It was only 18 at the peak in late 1929.
These four cycles converged again into early 2000.
The Generational Spending Wave turned up from late 1982 through late 2007. The 45-Year Innovation Cycle turned positive from late 1988 through 2010. The Geopolitical Cycle headed up from late 1982 into 2001 (until 9/11, to be precise). Finally, the Boom/Bust Cycle was up until February 2014 and has pointed down since then, with a bottom projected around early 2020.
All four cycles were heading up – together – into early 2000. This made the tech bubble of late 1994 into early 2000 the most favorable period in history, even more so than the Roaring 20s bubble… the greatest before it.
That’s why we witnessed the highest-ever valuations. It was baked into the cycles cake.
Now, all four cycles have converged on a downward path into early 2020…
The impact of the Geopolitical Cycle on stocks alone is to halve valuations from top to bottom. Based on this cycle, P/E ratios of 22 to 24 would be more normal at this point, with Dot-Com Era peak ratios of 44.2 unattainable.
There’s also another way to look at this…
Here’s a chart that adjusts the CAPE ratios for GDP growth which is much lower in the recent boom than in the roaring 90’s.
 The picture is clear: P/E ratios are higher than ever, and much higher that 1999 when you adjust for lower growth and economic momentum.
And if that’s not proof enough, there’s another valuation indicator that puts to rest any doubts that we’re in a bubble. You can read the May issue of Boom & Bust for the details.
Do yourself a favor: Don’t be lulled into a false sense of security by the experts claiming we’re not in a bubble.
We are in the largest and broadest bubble in modern history. And it will burst.

Harry
Follow me on Twitter @harrydentjr

The post The Evidence that Stocks Are More Overvalued than Ever appeared first on Economy and Markets.
May 16, 2017
It’s a “Risk On” World Right Now
 In today’s markets, traders clearly believe that risk IS reward…
That’s one reason long-term interest rates are climbing: Investors are absolutely more attracted to equities’ potential upside than to the safety of Treasury bonds.
Bulls think low volatility is a good sign that stocks are poised to go higher. Bears, meanwhile, think markets are disregarding risks and traders are too complacent.
Bond-market volatility has indeed been rather low. But it’s nothing compared to what’s happening in stock markets.
The go-to measure of stock volatility is the Chicago Board Options Exchange Volatility Index (VIX), a composite of S&P 500 Index options.
In the first quarter, the VIX – also commonly referred to as the “fear gauge” – was at its lowest level since 1995.
Stocks closed lower four out five trading days last week, rebounded yesterday, but have drifted down again today.
Benchmark yields have also trended a bit lower, with the 30-year U.S. Treasury bond dipping below 3% and the 10-year U.S. Treasury note slipping to 2.31%.
Recent economic indicators haven’t helped the cause…
Nearly two-thirds of U.S. gross domestic product (GDP) is comprised of consumer spending and retail sales accounts for half of that. Needless to say, retail sales is important to the health of our economy.
April retail sales were expected to rise 0.6%. Analysts expected “core” retail sales – which excludes auto and gas sales – to rise 0.4%. Well, sales only rose 0.4% and 0.3% respectively.
Last Friday’s April consumer inflation report also disappointed. The Consumer Price Index (CPI) did rise 0.2% on the month, in line with expectations. But “core” CPI – which excludes food and energy – was up just 0.1%. And the year-over-year core CPI dipped below the Fed’s 2% target.
Last week, the Fed explained away recent disappointing data (the PCE deflator, GDP, and manufacturing weakness) as “transitory,” or a temporary blip of weakness.
The U.S. Department of Commerce reported on Tuesday morning that housing starts slowed by 2.6% in April compared to March, to an annualized rate of 1.17 million. Analysts expected a run-rate 1.26 million. The April number was, however, 0.7% higher on a year-over-year basis.
The Commerce Dept. also reported that permits for new construction were down 2.5% month over month to 1.23 million in April. Permits were up 5.7% compared to a year ago.
Housing starts and permits tell us a lot about demand for homes and the outlook for new home sales.
New home sales have a ripple effect on our economy because it creates revenue not just for the builder but for businesses that sell appliances, furniture, and other things people fill their homes with and that provide landscaping and other services essential to making and keeping a nice home..
Todays’ data were mixed, but a trend is emerging.
And if it continues, I’m not sure how the central bank can justify its plan to raise its benchmark interest rate two more times in 2017.
We’ll see more data and we’ll get more insight from Fed officials between now and the next time they meet on June 13-14. In fact those chatty folks, altogether, will provide daily speeches between now and Memorial Day. It’ll be interesting to hear how they spin recent disappointing data.
If stocks end up shaking off weak data and move higher, bond yields will follow.
And that bodes very well for our potential profits here in Treasury Profits Accelerator!
I explain exactly why in this week’s special live Q-and-A session with Dent Research readers.
You can watch it and get the inside scoop on how to profit from both positive and negative market surprises, right here.
Good trading,

Lance Gaitan
Editor, Treasury Profits Accelerator

The post It’s a “Risk On” World Right Now appeared first on Economy and Markets.
May 15, 2017
Profiting from the Unexpected
 Every weekday morning I roll out of bed just before 5 a.m.
I sleepwalk to the kitchen, where my coffee-maker on a timer has just finished brewing, and reach for a much-needed cup. Then I flip on the television, and switch between local news and either CNBC or Bloomberg.
As I hate myself every single day for rising so early to exercise, I take note of the weather, any craziness that happened overnight in the Houston area, and the current trends in futures and interest rates.
There’s one thing I typically disregard: whatever the market pundits are discussing.
I don’t believe such people to be dumb, uninformed, or misguided. I’ve worked with many, and they’re among the smartest people I know.
I just can’t reconcile what they say on television with the real world. It’s as if they take what’s going on in the equity markets and then find a way to make it fit with the economic news of the day.
This earnings season is a perfect example.
First-quarter earnings for the companies in the S&P 500 look to be up about 13% over last year. That’s awesome! Based on these numbers, many commentators on my screen claim that equities are not just fairly valued, but are poised to move higher.
With earnings jumping by double-digits, they say, why wouldn’t we be at all-time highs and shooting for the moon?
If this were true, then wouldn’t the opposite be too?
When earnings fell for three consecutive quarters at the end of 2015 and the beginning of last year, shouldn’t the markets have gotten pummeled? Equities took a hit in the first quarter of 2016, no doubt, but bounced back strongly in the following months, even as earnings trailed.
It can’t be GDP growth driving investors to buy more stocks. We’ve just capped another year of plodding 2% growth, and kicked off this year with a whopper of a first quarter, when GDP expanded by 0.7% (and that number is annualized).
The truth is something that we don’t hear in the mainstream media.
Investors have come to expect higher equity prices simply because stocks have risen in the face of bad news for almost a decade. And what choice do they have?
Laughable interest rates, where they earn about the rate of inflation? Or maybe real estate, where, if the market turns, they’ll be stuck in a losing position for years?
By sticking with equities, no matter what data points cross their screens, investors have been rewarded with gains.
So far.
As the equity bubble builds, we’re setting up for a huge surprise, and it won’t be any fun.
Maybe investors will finally sour on tepid growth and bloated debt. Or perhaps they get spooked by the Chinese shell game of state-funded enterprises propping up inefficient businesses as off-the-books debt explodes to trillions of dollars. Maybe the pin that pricks the bubble is the European banking system, where non-performing loans in Italy and Greece make up 19% and 50% of all loans, respectively.
But even negative surprises can offer opportunity.
Just as we have long positions in the Boom & Bust portfolio that benefit as long as the current trend continues, we also have investments that’ll do exceptionally well when the markets roll over.
In short, we’re preparing for the unexpected, which is what every investor should do.
The goal is to earn profits wherever they present themselves, be it on the long side, the short side, or even interest rates. While we expect interest rates to remain low for some time, the normal swings offer opportunities… if you know where to look.
Lance Gaitan has banked profits in the bond market for the last couple of years, but not by clipping coupons. Instead, he waits until the markets are extended, with rates moving up or down too quickly, and then invests for a snapback.
The hold time is short, and the gains are impressive.
In one day last March for example, he made close to 70% by trading against overreactions to an upside jobs report and a comment by the New York Fed chair.
Using a program like his can give your portfolio a turbo charge in an otherwise dull market.
As we’ve mentioned in Economy & Markets the last few days, Lance is holding a special free Q&A at 4 p.m. EST tomorrow if you want to know more about what he does.
It’s called “Raiding the Reserve: How to Turn Boring Fed Reports into $1,300 in Four Days,” and he’ll detail how he profits from unexpected reactions to Fed-related news and reports.
Mark it on your calendar here.
No matter what your approach, as we wind up this earnings season and plod our way through what looks to be another quarter of sub-par GDP growth, make sure that you’re not surprised by what’s just around the corner.
Or, better yet, make a plan to profit from the unexpected. Your portfolio will be happy you did.

Rodney Johnson
Follow me on Twitter @RJHSDent

The post Profiting from the Unexpected appeared first on Economy and Markets.
May 12, 2017
Plan, Prepare, Profit: The Upside of Market Surprises
The unofficial start to summer here in the U.S. is marked by Memorial Day. But June 1 kicks off the official Atlantic hurricane season.
I live in Florida, and hurricanes can cause a lot of damage. If you’re caught unprepared, you’ll suffer the consequences.
So May 7 through May 13 is Hurricane Preparedness Week. It’s a great reminder to get ready if you haven’t already done so. Stock up on water, food, and fuel. Review evacuation routes. Make sure family members know where to go if a major storm is headed your way.
The National Weather Service is getting pretty good at predicting storm tracks, but, like any forecaster, it’s far from perfect.
Planning and preparing are the only sure ways to put you in position to get through hurricane season.
Now, planning for surprises is the foundation on which I developed Treasury Profits Accelerator. My decades of experience in the financial markets showed me that Treasury bonds react sharply to surprise economic reports. A 2008 study by the Federal Reserve Bank of New York backed me up.
That study, How Economic News Moves Markets, explored how the release of new economic data affects asset prices, including equities, fixed-income securities, and foreign exchange markets. The study included analysis of a dozen economic releases and the price effects of those releases on stocks, bonds, and exchange rates.
I’ll cut to the chase: The NY Fed study concluded that certain releases had the biggest price effect on bonds, and those price changes lasted the longest over other asset classes. Also, specific economic releases had a greater impact on prices than others.
When I write my weekly edition of Treasury Profits Accelerator, my goal is to help my readers prepare for the coming week’s market-moving economic releases.
For example, in October 2014, a poor retail sales report helped subscribers gain 9% in about a week!
In March 2015, surprisingly poor wage growth in the jobs report fueled a 6% gain!
A terrible Institute for Supply Management (ISM) Manufacturing report in December 2015 led to a 76% gain in a single day!
An upside surprise in jobs created from the February 2016 jobs report steered subscribers to a 69% gain in one day!
There are plenty more examples of Fed speeches, Fed policy action, and even geopolitical events leading to massive profits.
My system helps my readers profit from overreactions in the long-term Treasury bond market. When there’s any kind of big surprise and an ensuing price overreaction, we ride the market back to where it should be – for big profits.
This is what’s commonly referred to as a “reversion to the mean” trade.
It doesn’t really matter what successes I’ve had in the past. I’m always looking for new opportunities. I look at what the market is expecting and what might trigger a big move.
So far this year, markets have been pretty quiet. After the Fed hiked rates last December and promised three more rate hikes this year, bond yields actually fell! Go figure…
It doesn’t really matter why they fell. Too much of a good thing will inevitably become a not-so–good thing. As investors piled into Treasury bonds early this year, my system signaled that the price had moved too high and that yields were too low.
After seven days, we closed out an 89.42% winner based on the overreaction!
Reactions to recent economic reports have been relatively subdued lately, but there are plenty of potential pitfalls and surprises ahead.
The data’s been mixed lately; the “advanced” (first estimate) report of first-quarter GDP was pathetic, a growth rate of just 0.7%.
Last week’s Personal Income and Outlays report was disappointing, light on income and spending. The Fed’s key inflation indicator (the Personal Expenditures Price Index, often referred to as the PCE deflator), was negative. Overall, the entire report was subpar.
The April ISM Manufacturing Index also fell short of expectations, for the first time in seven months. It wasn’t a horrible surprise, but it was disappointing nonetheless.
Last Friday’s employment report was above expectations in terms of jobs created and the unemployment rate. Wages even grew…but the head-scratcher, based on these numbers, was that overall labor participation fell when it should have risen.
The Fed announced no change in policy last week but offered its usual explanation of the weaker-than-expected data as “transitory,” or a seasonal phenomenon. The central bank thinks jobs are strong, and it noted that business investment picked up.
The bottom line is that two more promised rate hikes are still in the cards for this year.
The markets seem prepped for another hike in June, but I’m not so sure. If hard data (like prices, jobs, and manufacturing) gets softer, the Fed will surely back off talk of hiking.
Between now and the Fed announcement in June, there will be plenty of data to digest and plenty of opportunity for surprise.
And we like surprises!
Treasury Profit Accelerator subscribers profit when there’s an overreaction in Treasury bond prices – to a surprise in either direction.
You can prepare for hurricane season by reviewing evacuation plans, stocking up on food and water, and, most importantly, being aware of approaching storms.
That’s how we approach surprises in the Treasury bond market and financial markets in general: planning and preparing.
And with Treasury Profit Accelerator, we do exactly what the name suggests.
There’s a lot more to it than what I’ve just told you obviously. And I get several emails a week asking me to explain my system in greater details.
I can understand that. After all, I wouldn’t put my money into a strategy that I didn’t understand from top to bottom.
That’s why next Tuesday at 4 PM EST, I’ll be hosting a LIVE Q&A session entitled Raid the Reserve: How to Turn Boring Fed Reports into $1,300 in 4 Days, where I’ll be answering many of those questions about my Treasury Profits Accelerator system… how it’s able to deliver such big gains in such short time periods… and what you should be doing now in advance of what promises to be a very volatile time on Wall Street in the months and years ahead.
And be sure to submit your own question to me at economyandmarkets@dentresearch.com.
I hope you can join me. It’ll take place, right here, so please bookmark the page and check back Tuesday at 4 PM EST.
Good investing,

Lance Gaitan
Editor, Treasury Profits Accelerator

The post Plan, Prepare, Profit: The Upside of Market Surprises appeared first on Economy and Markets.
May 11, 2017
Been Dead Since 2008
[image error]Nearly a decade.
That’s a long time to still be flogging this dead horse.
I’m talking about buy-and-hold investing.
It’s dead.
Been dead since 2008.
But not buried yet.
Instead, mom and pop investors still fall into the trap. And they pay dearly for it.
There’s a better way: finding a system that excels during times of increased volatility, especially on the downside.
That is, following a quick-hit strategy that gets you into AND out of stocks, bonds, and commodities at the best possible times. That has rules to follow. That’s easy to use. Maybe even something you can set and forget.
Just NOT buy and hold.
And if you want to juice their returns, they could even pick a strategy that uses options.
Options are frightening to the uninitiated. I get that. Although they really shouldn’t be.
But if you haven’t done it before following someone who tells you exactly what do to, and how to do it, and even gives you the precise ticker symbol is a tremendous benefit.
One of my favorite options strategies right now relies on volatility to grab quick gains. I’m talking double and triple digits in as little as a week.
Skeptical?
Good. You should be.
But it’s entirely true. Here’s an example…
Lance Gaitan is our Treasury’s guru. On June 16, 2016, he emailed subscribers with the following note:

The next day, he explained…
So, the Fed decided to keep rates right where they are, as we expected. They blamed shrinking job gains and low inflation for not hiking at this meeting.
I listened to Fed Chair Yellen drone on for an hour in her press conference, where she talked a lot but said little. She just about put me to sleep, and none of what she said was very enlightening.
Yellen said the Committee expects inflation to remain low because of earlier declines in energy prices. But obviously, the key in their decision not to hike was the declining job gains in the recent jobs report.
Even though it wasn’t mentioned specifically in the written statement, the Fed was also concerned about the looming British vote to exit the European Union. Yellen responded as such to a question in her Q&A. In any case, and not surprisingly, the vote not to hike was unanimous.
The Bank of England (BoE) also held steady on their policy decision yesterday. With the Brexit vote coming into view, the BoE inaction was expected.
And the central bank most boxed into a corner also held steady. The Bank of Japan (BoJ) was widely expected to further stimulate or go more negative with interest rates. The yen strengthened even more and the NIKKEI 225 stock index fell over 3%!
In fact, global equities are faltering on central bank inaction. What else can central bankers do, add more stimulus? Even though U.S. stocks have moved lower over the last week or so (and bounced slightly yesterday), we haven’t seen a big sell-off yet.
Central banks are running out of bullets and the markets are starting to realize this. The inaction this week of the Fed, BoJ and the BoE seems to be a possible tipping point for a major fall in stocks…
Remember, this is actually good for us. My model works best when we have high volatility. So, as far as I’m concerned, I welcome a good stock correction!
In the meantime, bond yields continue to plummet. Global sovereign bond yields are the lowest in history… as in they have literally never been this low before. The lows for the long-term Treasury are coming into view and volatility is increasing. This is good news for our short-term strategy, which triggered an alert to bet on a snap-back in yields.
On June 23, just one week later, Lance sent out an alert to close the trade for profits of 76%! See for yourself…
And do you know how he does this?
He plays the markets overreaction to economic announcements, like the nonfarm payroll report, the ISM manufacturing index, GDP (first release), consumer confidence, retail sales, housing starts and personal income.
Even better, he picks an instrument that’s considered so boring, most aren’t even aware of the micro moves constantly shuffling the board.
Here are other examples of the effectiveness of Lance’s system:
When comments from the Fed moved yields higher, Lance jumped into a trade and his readers had the chance to make a 113% gain in four days on half of their position and 137% gain on the other half shortly after.
When poor retails sales moved yields lower, they had the opportunity for a 99% gain in seven days.
Poor wage growth gave Lance and company a chance to grab gains of 86% in three days as yields snapped back.
The Greek default led to Lance capturing gains of 47% in just one day.
A poor ISM Manufacturing Report helped Lance and his readers bank 76% in one day.
When one Jobs Report surprised to the upside, Lance’s system grabbed 69.37% in a day.
The list goes on!
The great news is that I expect volatility to pick up sharply in the coming months… and that juices Lances’ trades and gains even more. Volatility creates the opportunities for snap-back moves.
The early stages of the next downturn are likely to see a continued rise in longer term rates due to late stage inflation (a lagging indicator) and fears of the Fed finally tapering down its balance sheet slowly.
But when the economy finally starts to crash, along with stocks, bond yields will plummet dramatically. Lance and his Treasury Profit Accelerator subscribers will be ready to grab the profits.
Next Tuesday, Lance is “hosting” a Q&A session called “Raid the Reserve: How to Turn Boring Fed Reports into $1,300 in Four Days” to explain exactly how he’s able to do this. Don’t miss it.
And, of course, if you have any questions you’d like him to answer, send them to us at economyandmarkets@dentresearch.com.

Harry
Follow me on Twitter @harrydentjr

The post Been Dead Since 2008 appeared first on Economy and Markets.
May 10, 2017
The Fed Fudge Factor in Treasury Yields
I hate taxes.
I don’t begrudge paying for a functioning government, it’s the dysfunctional favoritism that ticks me off.
This amorphous blob in Washington sucks dollars out of my wallet and then tells me not to worry about how it’s spent, even as I watch the government hand my dollars out like candy.
I’m still beside myself about General Motors.
The common version of events tells us that the company went bankrupt. Right.
Tell that to the investors that owned GM bonds backed by physical equipment. They were told to go to the back of the line. Instead, union pension funds (junior creditors, mind you) were given first dibs on the assets, and ended up with 100% of their benefits.
That doesn’t really sound like a bankruptcy, does it?
And then GM was allowed to punt what became known as “old GM,” saddling that sad sack with all the debts and burdens, but hanging on to its operating losses.
This meant GM wouldn’t pay income taxes for years as it raked in cash with no debt.
And don’t get me started on the home builders, who were allowed to extend their lookback when matching up losses in the late 2000s, against earlier profits, again to drive their tax burdens below zero.
Did I mention I hate taxes? But I pay them.
The IRS can confiscate assets like no other entity, so I never get close to the questionable line. In fact, I estimate my taxes and pay quarterly.
I’m so conservative that I hold a year’s worth of tax payments aside, to make sure that I can write the checks as they come due.
But keeping the funds in just cash makes no sense, so I create a short-term bond ladder. The returns are tiny, but they exist, and I’m always looking for another way to boost my balance sheet.
To find suitable investments, I turned to my brokerage firm’s website, searching A-rated bonds with maturities two months, five months, and eight months out. As an ex-bond trader, I’m very familiar with how yield curves work, even when they are as short as two to eight months.
I immediately reached for yield in the A-rated pile, discarding anything financial, looking for companies that make real stuff and operate mostly in the U.S. As I perused the offerings, I was struck by what I didn’t find.
Yield.
Now, when you look at returns on bonds that mature in eight months, there won’t be much yield anyway. But these bonds were paying .06% and .159%. And these are annualized numbers!
I immediately flipped back to the main yield/maturity matrix page on the firm’s website, and I scanned return ranges by quality and issuing class, and found something surprising.
What was an anomaly years ago is now commonplace. U.S. Treasury bonds carry higher yields – and in some cases, much higher yields – than lowly A-rated paper.
Diageo, PLC, the alcohol company, paid 0.056%, while John Deere paper returned .15%. U.S. Treasury bonds of the same maturity paid 0.92%… six times what I’d earn on the John Deere bonds and 15 times what I’d get on the Diageo paper.
And it’s much better than I’d get if I tried to buy German or Japanese government bonds. Those pay, or rather require that I pay, -0.88% and -0.22% respectively, and that’s for 2-year bonds!
Clearly, when it comes to short-term fixed income, the U.S. qualifies as a high-yield offering, even though there’s no chance of the U.S. defaulting. If the blame for the high borrowing cost is not a function of repayment risk, then it must be something else.
And we know what that other factor would be – the Federal Reserve.
With low growth and low productivity, the U.S. economy isn’t breaking any speed records. Lending is softening, not expanding. And yet the Fed is pushing rates higher, against the tide.
The central bank makes this happen by offering reverse repurchase agreements to money market funds and other institutional short-term borrowers at the rates it wants to achieve. But the Fed only works in government issued collateral, so these bonds end up paying more than lower rated bonds of the same maturity.
It’s all very strange.
While I might be able to capture a bit more yield because of this, I end up losing as a taxpayer. The Fed’s distortion of the short-term market pushes up the borrowing cost of the government when it issues T-bills. And there are other, bigger losers – banks.
The Fed might not be following the lead of the moribund economy, but long-term bond buyers know the score.
(Incidentally, my colleague Lance, who runs the Treasury Profits Accelerator trading service, often recommends short-term trades based on market overreactions to Fed speeches and announcements, and rising and falling bond yields.)
After hitting a high of more than 2.6% earlier this year, 10-year U.S. Treasury bond yields recently touched 2.2%. As the Fed pushes up short-term rates and investors pull down long-term rates, the difference between the two shrinks, indicating a flat yield curve and modest economic growth.
Banks pay depositors based on the short-term rate set by the Fed, but they lend money long –term based on prevailing rates. The difference between the two is called the net interest margin (NIM), and as it shrinks, banks earn less on their fundamental reason for being, which is taking deposits and lending.
If NIM remains low, then bank prospects grow dimmer, taking some of the punch out of the financial sector in the months to come, adding to the headwinds for the equity indexes this year.
We’ve long maintained that long-term interest rates will stay low for years, allowing for some volatility based on central bank intervention (ending QE and eventually cutting its balance sheet) and geopolitical events.
As the Fed raises short-term rates to give itself some breathing room ahead of the next recession, banks will pay the price.
But at least I’ll earn a bit more money while waiting to pay my taxes.

Rodney Johnson
Follow me on Twitter @RJHSDent
P.S. I mentioned Lance’s trading service earlier. Watch this space the next few days as we’ll be taking on the Fed, and leading into a special Q&A that he will hold next week about his Treasury Profits Accelerator service.
Lance will detail all the ins and outs of his algorithm that helps subscribers prepare for and profit from surprises and overreactions to Fed news and other reports. We’re talking near triple-digit gains, sometimes in as little as a day. Or a seven-day trade in January that notched almost 90%, based off the fact that Treasury bonds were overbought. Click here to learn more.

The post The Fed Fudge Factor in Treasury Yields appeared first on Economy and Markets.
May 9, 2017
How Bull Markets Work
 Much has been made about the age of the current bull market, which started to run in March 2009 and has been raging now for more than 2,600 days.
That makes it the second-longest such run in market history.
But there’s something you have to know about the last seven-plus years…and every other period of sustained stock-market gains…
It’s a dirty little secret, obscured by talk of pure length of time…
Bull markets move higher in fits and starts.
It’s the proverbial “one step forward, two steps back.”
Or, more realistically, it goes like this: three steps forward (suddenly)… one or two steps back (slowly).
Let me first show you some numbers to illustrate what I mean. And then I’ll explain how this “fits-and-starts” phenomenon affects most investors… and how you can get the most from the market by embracing it.
Here’s a table showing returns of the four major U.S. stock indices, for four distinct time periods – between November 8 (Election Day) and today:
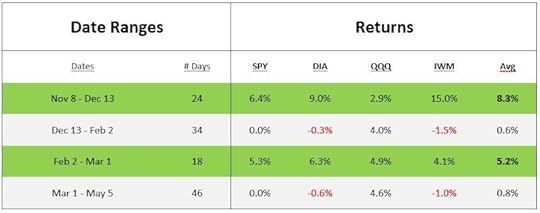
As you can see, there’s a significant difference between the first and third time periods (shaded green) and the second and fourth (shaded grey).
U.S. stock indices made strong gains during those “green” periods – 8.3% in 24 days and 5.2% in 18 days. That’s the “three steps forward (suddenly)” part of the fits-and-starts cycle I’m describing.
Meanwhile, stocks went nowhere but sideways during the other two “grey” periods – gaining just 0.6% in 34 days and 0.8% in 46 days. And those averages were buoyed by the Nasdaq 100… the other three indices were flat or slightly negative.
That’s the “one or two steps back (slowly)” part of the fits-and-starts cycle I’m talking about.
Now, these numbers alone show a basic truth about bull markets: There are long periods of time when stocks are boring… punctuated by briefer periods of time when stocks march (or shoot) higher.
Knowing this truth, you should be prepared to do three things:
Stay invested most of the time (as long as the trend is up),
Keep a portfolio of diversified plays, and
Stay patient during the “one or two steps back (slowly)” phase of the cycle.
Point #1 ensures that you’re already into position when the bullish, “three steps forward (suddenly)” phase appears without notice.
Point #2 is, well, just Diversification 101 and plain common sense.
Point #3 addresses the behavioral aspect of investing.
That is, your behavior – particularly during the tough times – dictates your success or failure. You’ve got to keep calm and collected during the “two steps back”… to ensure you’re in the game when the “three steps forward” rally unfolds.
Where Are We Now?
Essentially, we’re still in the “one or two steps back” phase that began around March 1.
U.S. stocks are at or near their highs, but we haven’t seen a strong, “three steps forward” rally in a while.
The pullback phase has been slow and orderly… which is just the type of pullback you want to buy into.
That trading wisdom that says “never short a dull market” – that’s because strong, “three steps forward” rallies tend to appear suddenly once the market has sufficiently lulled everyone to sleep.
Remember…
Bull markets make you money… but you’ve got to be “in it to win it,” as we say.
That’s why Cycle 9 Alert is designed to help you…
Stay invested most of the time (as long as the trend is up),
Keep a portfolio of diversified plays, and
Stay patient during the “one or two steps back (slowly)” phase of the cycle.
Click here to learn more about how you can profit from the market’s fits and starts.
To good profits,

Adam O’Dell
Editor, Cycle 9 Alert
Follow me on Twitter @InvestWithAdam

The post How Bull Markets Work appeared first on Economy and Markets.


