
Harry S. Dent Jr.'s Blog, page 134
October 5, 2015
More Important, Why Is Mark Carney Talking About Climate Change?
 Mark Carney is Canadian by birth. He’s also Irish, at least by citizenship. He went to college at Harvard, then joined Goldman Sachs. He worked in the Canadian Department of Finance, eventually becoming the Governor of the Bank of Canada. That’s a pretty good career by itself, but he didn’t stop there.
He’s since jumped the pond and is now the Governor of the Bank of England as well as the President of the G20’s Financial Stability Board.
From all this I presume the guy knows a thing or two about finance and central banks. Which is what makes the topic of his recent speech so interesting.


October 2, 2015
The 5th Convergence: Why This is Not a Buy-and-Hold Market!
 This morning we had to face some hard truths. The economy’s beginning to show its true colors.
Last month it’s already starting to happen.
Economists, Wall Street analysts, and your stock broker, will not see this coming.
Protect yourself now and sell any financial assets you aren’t actively trading, like with one of our analysts who actually see this coming, before the greatest bubble in history continues to burst.

Harry
Follow me on Twitter @harrydentjr

 Back in April
 October 1, 2015
Don’t Worry: Bear Markets Are a GOOD Thing
 It always amazes me how after a small decline in the stock market, pundits from all over come out of the woodwork to determine if this is the bottom. It’s been a while, but bear markets do happen!
Bear markets are a good thing. They clean out the excess. It’s sort of like a forest fire that clears out the brush and paves the way for new growth. Everything works in cycles.
Unfortunately, the longer the current bull market remains intact, the more pain will be felt on the downside once the trend changes.
September 30, 2015
Detroit’s Old News: Time for Another Round of Bankruptcies
It seems like only yesterday that Detroit filed for bankruptcy. It’s actually been more than two years since the initial filing, and almost a year since a judge approved the bankruptcy plan.
With the stroke of a pen, bond investors with a contractual claim on the city’s assets and revenue were swept away. This had to be done, we were told, to make room for the junior creditors, including pension funds covering unions, which eventually received almost 100% of what they were owed.
The Detroit bankruptcy made a mockery of the law, arbitrarily assigning assets and creating ownership claims where none existed. Claiming that the value of the Detroit Art Museum could be used for pensions but not for bondholders wasn’t a stretch – it was dishonest. If the museum was owned by the city, then the proceeds from its sale should’ve gone into the pot for all creditors. Period.
Apparently that doesn’t happen in a municipal bankruptcy, where judges seem to decide based on something other than the law.
But the Detroit bankruptcy did have one great thing going for it – timing. The U.S. economy stalled then accelerated in both 2013 and 2014, while the equity markets climbed higher. China was still a juggernaut and Europe seemed to have steadied itself, at least for a little while.
Now, all of that’s behind us.
At a time when things seem bleak, we’re due for another round of bankruptcies in well-known areas. Only this time, the economy and markets won’t provide any cushion.
Global markets are moving lower in a stair-step fashion, with big drops followed by small rallies. Chinese economic reports are disappointing, and are probably overly optimistic, while Europe deals with its own set of difficult issues including mass migration from Syria.
At home we’ve been able to post modestly positive economic numbers, but our markets have joined the rest of the world. It’s as if investors finally looked behind the curtain of the economy, saw the members of the Fed, and weren’t impressed.
With a lack of great investment opportunities in front of us, all of us should be very focused on preserving what we have.
That makes it even more important that investors review their portfolios, looking for potential time bombs like bonds of the issuers below.
Chicago, IL
The windy city has quite a problem. In the face of underfunded pensions, the city did what many government bodies do – it took a holiday.
For several years at the start of this decade the city contributed less to its pensions than it should have. The decision was out in the open for everyone to see.
Now the holiday is over, and Chicago must come up with hundreds of millions of extra dollars a year. That’s money it doesn’t have.
Mayor Rahm Emmanuel tried to force a pension overhaul on the union members, including teachers, city workers, and first responders. His plan was quashed when the state supreme court ruled against a similar initiative by the governor regarding state level pensions.
The court ruled that, since pensions are contracts, they cannot be impaired. The union workers must get every penny that previous administrations promised, no matter how infeasible the cost.
Now the mayor has proposed a massive property tax increase. Without it the city will have to lay off workers, including policemen and firefighters, forgo street repair, and end its rat-control program.
Bond rating agencies already cut Chicago debt to junk status. Now the city sounds like it will move quickly toward junkyard status. It’s no wonder that Chicago just displaced Detroit as the city with the biggest drop in value in the S&P Case-Shiller Home Price Index.
Wayne County, Michigan
The county that includes Detroit has all of Motor City’s problems, but none of its solutions. The county suffers from that well-known, one-two punch of lower tax revenue and rising pension costs. Currently, Wayne County runs a structural deficit of $52 million, which includes sending $20 annually over the past several years to its pension coffers.
County officials note that they have taken steps to fix their finances, including a 5% pay cut for appointees and a spending freeze. But these changes simply hold some costs in place while others, like pensions, keep growing.
At the same time, there is little the county can do to raise revenue. Detroit has experienced a small revival since the bankruptcy, but the modest uptick in business activity doesn’t generate nearly enough revenue to pay the legacy costs of decades of financial neglect.
Atlantic City, NJ
The third locale on the list is the gambling mecca of the East. The fortunes of Atlantic City have always followed casinos, which is not a good sign in today’s economy. With four of the big gambling houses bankrupt, Atlantic City finds itself hurting for revenue.
The city has a $100 million hole in its budget. This is made worse by the fact that it keeps losing tax refund lawsuits. So far the city has been forced to refund $186 million in taxes after Casino owners contested their assessments.
But the pain isn’t all on the revenue side.
Atlantic City employs 29 city workers per 1,000 residents, almost triple the rate of Newark, with 11 employees per 1,000 residents, and Jersey City, with 10 employees per 1,000 residents. The mayor recommended laying off more than 200 workers, but that would still leave the city with a much higher worker-per-resident ratio than other cities.
So far, the New Jersey government, including the governor, has been quiet on the possibility of a bankruptcy in the state. The state has gone so far as to give the city more time to repay state loans. If Atlantic City goes under, it would be the first municipal bankruptcy in New Jersey since the depression.
While the state government hasn’t mentioned that the city might go bankrupt, it hasn’t taken that option off the table either. It could be that the governor wants to keep all avenues open, since he has the same financial issues at the state level. As long as bankruptcy is possible, he might have more leverage when negotiating pension reforms with unions.
The three examples here don’t complete an exhaustive list. Many other towns, counties, and states have fiscal woes that will only be addressed through some version of bankruptcy or negotiated restructuring.
By the time that happens, investors have already lost. The best way to protect yourself is to go through your portfolio today, and make sure there aren’t any hidden time bombs.

Rodney
The S&P 500: It’s Worse Than You Think
 We all know that feeling… when something seems fine on the surface, even though trouble is brewing just below.
The feeling is almost imperceptible at first.
Then you recognize it: a weird feeling in your gut, even if you don’t know what to make of it.
Over time, worry and fear affects your ability to make decisions…
And finally, your worst fears are confirmed. But, usually, only after it’s too late to save yourself!
That’s pretty much the progression of the “something-just-ain’t-right” feelings that investors have endured for over two years now.
And this chart shows why…

2013 and 2014 were great years for stocks – the S&P 500 climbed 30% and 11%, respectively. What’s more, the steady climb higher was almost completely void of volatility.
So, on the surface, everything seemed perfectly fine.
But as this chart shows, there was trouble brewing under the surface. As the S&P 500 marched higher over the last two years, a growing majority of stocks inside the index fell lower.
In other words, fewer and fewer individual stocks have been participating in the broader bull market!
You see, the moving average is a simple measure of a stock’s trend. If a stock’s price is above its 200-day average, you can call the stock “bullish,” or in an uptrend. And if the stock’s price is below its 200-day average, you can call the stock “bearish,” or in a downtrend.
And over the last two years, the number of stocks that are above their 200-day average (i.e. bullish) has been steadily declining… even though the price of the S&P 500 has been steadily rising.
You can see this in the chart above. The S&P 500 (SPY) on the top half of the chart shows “bullish prices.” Meanwhile, the “market breadth” – or percentage of stocks in the S&P 500 currently above their 200-day moving average – is plotted on the bottom half as “bearish breadth.”
Market breadth is just a technical term for the percentage of stocks in the S&P 500 which are currently above their 200-day moving average.
In May 2013, more than 90% of the stocks in the S&P 500 were above their 200-day averages. Almost all stocks were in bullish uptrends… and so the broad market’s bullish trend was considered “healthy,” since it was supported by a large number and variety of individual stocks.
But now, less than 20% of stocks in the S&P 500 are above their 200-day moving average. That means that 80% of S&P 500 stocks are now in bearish downtrends. And that’s a troubling sign for the broad market.
Simply put: a broad bull market can’t be healthy if so many of its stocks are sick.
Of course, this shouldn’t catch you completely off guard. We’ve been warning about this for some time now. And the good news is… it’s not too late to do something about it.
I told subscribers to our monthly Boom & Bust subscribers to get out of all long stock positions on September 11, when my broad market sell signal was triggered. And I suggest you do the same – get out before it’s too late!
Then tomorrow, I’ll explain how you can use the 200-day moving average as a wealth-preservation tool, and also how my Cycle 9 Alert and Max Profit Alert trading services use trend filters to capture short-term gains on both sides of the market.
Best,

Adam
Chief Investment Strategist, Dent Research

September 29, 2015
The Fed-Induced Market Cycle Continues
 The markets had a lot to digest yesterday. The Dow fell over 300 points. The S&P 500 broke below 1,900 for the first time since August. The economy posted minimal gains in consumer spending and personal income. Yields were flying around doing all sorts of crazy things.
And yet, nothing has fundamentally changed.
We’re still stuck in this ongoing state of volatility, much of it thanks to the Fed. Just before these would-be economic gods held their key interest rate at zero a couple weeks ago, volatility went berserk.
But it hasn’t settled down since. U.S. Treasury bond yields are up 3% one day and down the same the next. What gives?
The institution lost credibility when it decided not to hike rates. It might not have done itself any favors in the days to follow when it said we could expect a rate hike by the end of the year. Either way, they’re just blowing smoke. And everyone knows it.
The Fed is waiting for a couple data points to line up before they make their move. So it should be clear that when inflation ticks higher and wages start trending up, they will raise rates.
That is, assuming those things will happen.
According to Fed chair Janet Yellen, we are very close to a rate hike. Meanwhile, the markets have priced in less than a 50% chance the federal funds rate will go up by year end.
There’s a few key pieces of economic data coming out later this week that should propel this drama forward – namely Friday’s jobs report.
But right now, the market’s so confused that whether we get positive or negative economic data, investors seem to overreact. Again, despite positive economic news yesterday morning, the market suffered one of its worst selloffs in a month (which says a lot given the kind of month we’ve had).
So, until it’s clear what the Fed’s next move will be, you can expect this pumped-up volatility to continue.
Remember though, volatility will give Dent Digest Traders opportunities to profit! Making money on wild swings in the Treasury market is what we do.
Just take a look at the chart of the 30-year U.S. Treasury bond below:
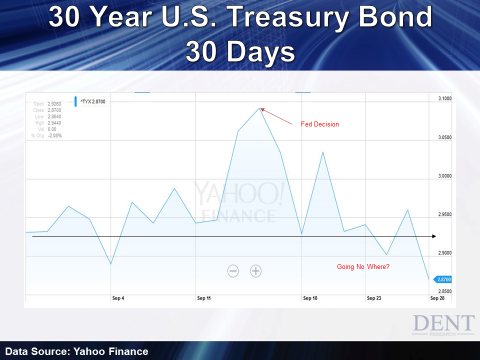
Look at that volatility! Like I said, up 3% one day, down 3% the next. This is the kind of environment that offers a lot of short-term trading opportunities for us.
Based on these movements, subscribers of Dent Digest Trader were able to cash in a 16% gain recently – not bad considering we held that most recent trade for just a week – and I just sent another trade alert this afternoon that you can take advantage of tomorrow.
For us, the getting’s been good. More trades and gains to come as this Fed-induced market cycle continues. I’d tell Yellen “thanks” if I wasn’t so sick of seeing her face.

Lance Gaitan
Editor, Dent Digest Trader

Here’s How Much Manhattan Fell During the Great Depression
The richest people I know or meet always tell me the same thing: prime cities in the developed world simply can’t go down!
New York, London, Paris, San Francisco, Vancouver, Singapore, Sydney – they’re all invincible! Or so these guys would have you believe.
If there’s any two things history doesn’t support, it’s that the biggest cities always reign supreme… and that the ultra-rich always remain rich.
There’s a reason all good mothers tell their children to become doctors or lawyers. People in those professions will likely end up in the 1% to 10% bracket where they make their money more systematically – like from high salaries. They might not make it into the top 0.1% to 1%, where incomes and net worth are totally unstable, but they’ll make a hell of a living, and have stability to boot. The guys at the top? They may get rich off some radical new business or IPO or from Wall Street speculation. But they might burn out just as quick.
That’s just how they work. Radical innovators, speculators, and even conquerors “live and die by the sword.” They’re too invested – both emotionally and financially.
I get it. But as one of those people who started a radically different business and took huge risks, you’d be shocked by how much my income and wealth has varied over the last 20 years. You’re not on top forever!
So for these people who think they’re going to be rich forever and that they can park millions in cash in prime real estate and get away scot-free, they’ve got another thing coming.
There were two points when the top 1% controlled near 50% of the net worth in the U.S. – 1928 to 1929, and 2007 to 2015. The very top, the 0.1%, control as much as 25% at these peaks.
But those peaks don’t last, as the bubbles that create such extreme wealth don’t last. Their wealth tends to get cut in half in the years and decades to follow.
This has devastating consequences to the real estate prices in huge cities where these global elite park their cash.
They see such cities as the safest place to park large amounts of money. Where else can you buy a 4,000 to 9,000 square-foot penthouse for $20 to $120 million? They can go for as much as $13,000 a square-foot! Try buying a big block of stock for that amount without moving the markets against you. You can’t! So real estate in such megacities seems like a great idea.
But here’s what that assumption might cost them by simply looking back at history. This chart shows how Manhattan – the greatest district in the great city in the world! – fared in the Roaring 20s… then the Great Depression.

The high-end peaked the latest (and most dramatically) in 1929, then crashed 67% into 1939. That’s twice what the average house fell by from 2006 to 2012, and more than twice what the Case-Shiller index shows for top cities that went down into 1933! Even the low-end went down 58% after peaking in 1927.
For comparison in Washington, DC, the median house – the true middle market representing the average American – went down only 26% from 1925 to 1933.
The Case-Shiller index shows the top cities hit new highs again in 1943 – 10 years after its bottom. In DC, the median house recovered back to its highs by the 1940s. But in Manhattan, real estate was still down near its lows in 1939. Sources claim it didn’t reach new highs again until 1953 – others claim 1960!
How could it possibly take as much as 30 years to recover!?
Simple – the greater the bubble, the greater the burst!
The question is, who’s buying these properties at such outrageous prices?
Buyers on the highest end are often foreigners just looking to get a stake and park (or launder) money out of their country – they more often than not don’t really live there.
In any major coastal city you go to, the high-end buyers tend to be affluent Chinese, Russians, Brazilians, or Mid-Easterners. But with the way oil has collapsed, hitting the currencies of Russia and the Mid-East… and the way the commodity collapse has hit Brazil and its currency over 50%… it’s now more down to the Chinese.
But China’s government is finally getting serious about cracking down on money leaving the country under the guise of real estate – as I’ve been predicting would have to happen, the way money’s been fleeing out of China at an unprecedented rate.
Suddenly, those foreign buyers won’t be around anymore – at least not to the extent they have been. Remember the Japanese affluent buying up real estate globally in the late 1980s? They disappeared almost overnight when their real estate bubble collapsed and their wealth with it. And that will leave nothing left to stop this bubble from bursting.
Luxury home builder Toll Brothers and top real estate agents are reporting to Bloomberg that they see Manhattan’s high-end starting to taper off rapidly.
One of Toll Brothers’ executives, David Von Spreckelsen, said: “The days of super pricing and of raising prices every other week, I think, are probably past.” They’re switching gears from the larger apartments to smaller units in the $2000 per-square-foot range… imagine that!
Then Ziel Feldman of Manhattan-based HFZ Capital Group says: “I don’t want to be hostage to a $10-to-$20 million condo market.” As of second quarter, 50% of new development listings were over $5 million. That will not last.
When the high-end cracks, it will crack in many bubble cities driven by foreign buyers. And when this next real estate bubble bursts, it will happen on a much more global scale – much more severe than the last one.
Don’t say we haven’t been warning you.
Harry
Follow me on Twitter @harrydentjr


