
Michael Roberts's Blog, page 30
May 9, 2022
Inflation: wages versus profits
The Governor of the Bank of England, Andrew Bailey set the attitude of the mainstream view on the impact of inflation in February, when he said that “I’m not saying nobody gets a pay rise, don’t get me wrong. But what I am saying is, we do need to see restraint in pay bargaining, otherwise it will get out of control”.
Bailey followed the Keynesian explanation of rising inflation as being the result of a tight (‘full employment’) labour market allowing workers to push for higher wages and thus forcing employers to hike prices to sustain profits. This ‘wage-push’ theory of inflation has been refuted both theoretically and empirically, as I have shown in several previous posts.
And more recently the Bank for International Settlements (BIS) study confirms that “by some measures, the current environment does not look conducive to such a spiral. After all, the correlation between wage growth and inflation has declined over recent decades and is currently near historical lows.”
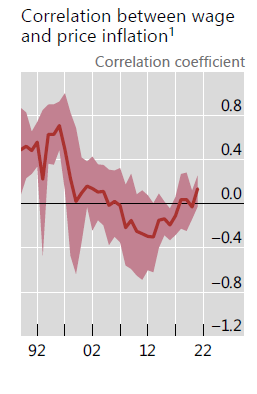 BIS
BISBut this wage push theory persists among orthodox Keynesians because they think full employment breeds inflation; and it is supported by the authorities because it ignores any impact on prices by businesses attempting to boost profit. Bailey did not talk about ‘restraint’ in market pricing or profits.
The wage-push theory existed before Keynes. As far back as in the mid-19th century, the neo-Ricardian trade unionist Thomas Weston argued in the circles of the International Working Man’s Association that workers could not push for wages that were higher than the cost of subsistence because it would only lead to employers hiking prices and was therefore self-defeating. For Weston, there was an ‘iron law’ of real wages tied to the labour time required for subsistence which could not be broken.
Marx rebutted Weston’s views both theoretically and empirically in a series of speeches published in the pamphlet, Value Price and Profit. Marx argued that the value (price) of commodity ultimately depended on the average labour time taken to produce it. But that meant the shares of that labour time between the workers who created the commodity and the capitalist who owned it was not fixed but depended on the class struggle between employers and employed. As he said, “capitalists cannot raise or lower wages merely at their whim, nor can they raise prices at will in order to make up for lost profits resulting from an increase in wages.” If wages are ‘restrained’ that may not lower prices but instead simply increase profits.
Indeed, that is what is happening now in the current bout of inflation. In the Great Recession recovery, price growth was actually quite subdued over the first few years of that recovery. Corporations instead applied extreme wage suppression (aided by high and persistent levels of unemployment). Unit labour costs (ie the cost of labour per unit of production) fell over a three-year stretch from the recession’s trough in the second quarter of 2009 to the middle of 2012.
There has been a general pattern of the labour share of income falling during the early phase of recoveries characterized most of the post–World War II recoveries, though it has become more extreme in recent business cycles. By 2019, labour’s share was at all-time low. The decade of the 2010s saw basically a stagnation of average real wages in most major economies.

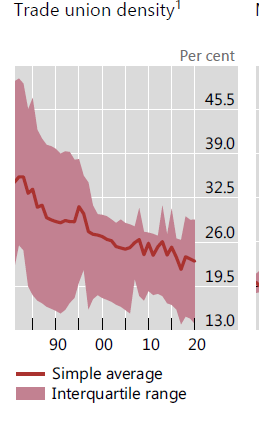
In a recent report, the Bank for International Settlements (BIS) makes the point that “in recent decades, workers’ collective bargaining power has declined alongside falling trade union membership. Relatedly, the indexation and COLA clauses that fuelled past wage-price spirals are less prevalent. In the euro area, the share of private sector employees whose contracts involve a formal role for inflation in wage-setting fell from 24% in 2008 to 16% in 2021. COLA coverage in the United States hovered around 25% in the 1960s and rose to about 60% during the inflationary episode of the late 1970s and early 1980s, but rapidly declined to 20% by the mid-1990s “
 BIS
BISSince the COVID slump, labour’s share of income and real wages have been falling sharply even as unemployment falls. This is the complete opposite of the Keynesian inflation theory and the so-called ‘iron law of wages’ proposed by Weston against Marx. The rise in inflation has not been driven by anything that looks like an overheating labour market—instead it has been driven by higher corporate profit margins and supply-chain bottlenecks. That means that central banks hiking interest rates to ‘cool down’ labour markets and reduce wage rises will have little effect on inflation and are more likely to cause stagnation in investment and consumption, thus provoking a slump.
Prices of commodities can be broken down into the three main components: labour costs (v= the value of labour power in Marxist terminology, non-labour inputs (c =the constant capital consumed, and the “mark-up” of profits over the first two components (s = surplus value appropriated by the capitalist owners). P = v + c + s.
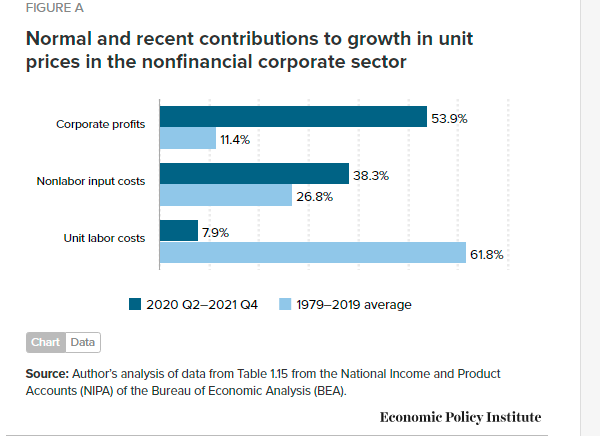
The Economic Policy Institute reckons that, since the trough of the COVID-19 recession in the second quarter of 2020, overall prices in the producing sector of the US economy have risen at an annualised rate of 6.1%—a pronounced acceleration over the 1.8% price growth that characterized the pre-pandemic business cycle of 2007–2019. Over half of this increase (53.9%) can be attributed to fatter profit margins, with labour costs contributing less than 8% of this increase. This is not normal. From 1979 to 2019, profits only contributed about 11% to price growth and labour costs over 60%. Non labour inputs (raw materials and components) are also driving up prices more than usual in the current economic recovery.
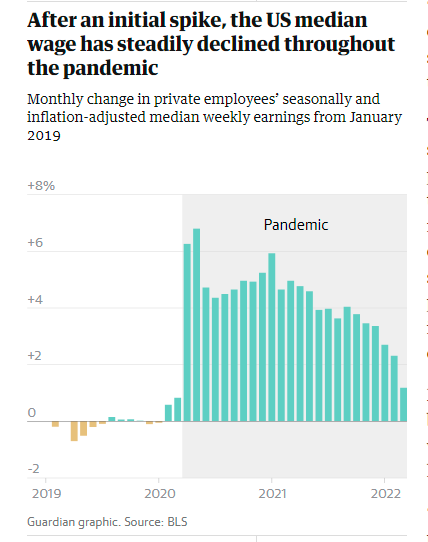
Current inflation is concentrated in the goods sector (particularly durable goods), driven by a collapse of supply chains in durable goods (with rolling port shutdowns around the world). The bottleneck is not labour asking for higher wages, shipping capacity and other non-labour shortages. Indeed, in the current inflation spike, US weekly earnings growth has been slowing month by month.
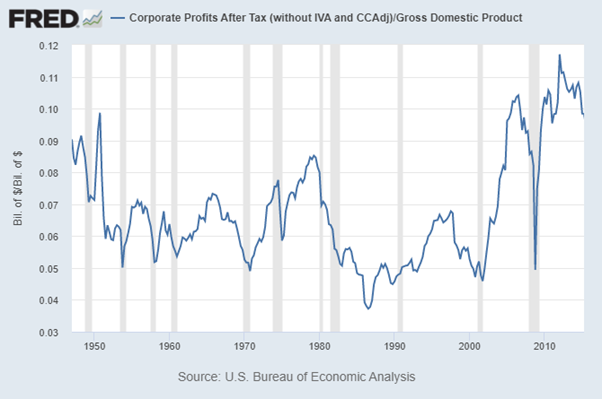
It’s profits that have been spiralling upwards. Firms that did happen to have supply on hand as the pandemic-driven demand surge hit have had enormous pricing power vis-à-vis their customers. Corporate profit margins (the share going to profits per unit of production) are at their highest since 1950.
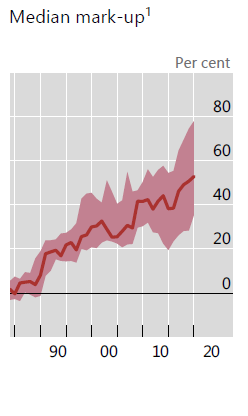
The BIS study finds similarly: “Firms’ pricing power, as measured by the markup of prices over costs, has increased to historical highs. In the low and stable inflation environment of the pre-pandemic era, higher markups lowered wage-price pass-through. But in a high inflation environment, higher markups could fuel inflation as businesses pay more attention to aggregate price growth and incorporate it into their pricing decisions. Indeed, this could be one reason why inflationary pressures have broadened recently in sectors that were not directly hit by bottlenecks.”
 BIS
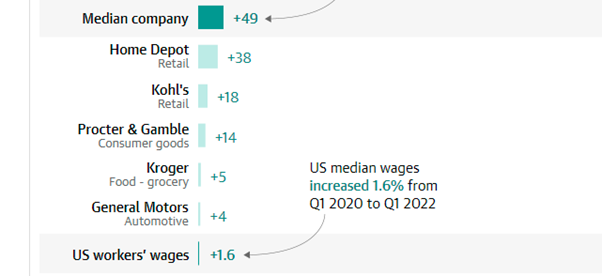
BISAn analysis of the Securities and Exchange Commission filings for 100 US corporations found net profits up by a median of 49% in the last two years and in one case by as much as 111,000%!
Chief executives are acutely aware to the ability to hike prices in this inflationary spiral. Hershey bar CEO Michel Buck told shareholders: “Pricing will be an important lever for us this year and is expected to drive most of our growth.” Similarly, a Kroger executive told investors “a little bit of inflation is always good for our business”, while Hostess’s CEO in March said rising prices across the economy “helps” profits.
Does this mean that companies can raise prices at will and are engaged in what is called ‘price-gouging’? Marx, arguing with Weston in 1865, did not think that was the case in general. The power of competition still ruled. George Pearkes, an analyst at Bespoke Investment, pointed to Caterpillar, which recorded a 958% profit increase driven by volume growth and price realization between 2019 and 2021’s fourth quarters. Eliminating price increases may have dropped the company’s 2021 quarter four operating profits slightly below the $1.3bn it made in 2020. “This isn’t price gouging … and it shows pretty concretely that there’s a lot of nuance here,” Pearkes said, adding profiteering is “not the primary driver of inflation, nor the primary driver of corporate profits”. Indeed, companies that push prices as hard as the current environment allows to maximise profits in the short run may find themselves paying a price in market share down the road as others get into the game. It is clear, however, that the concentration of capital is any sector, the greater ability to hike prices. “When you go from 15 to 10 companies, not much changes,” one analyst argued. “When you go from 10 to six, a lot changes. But when you go from six to four – it’s a fix.”
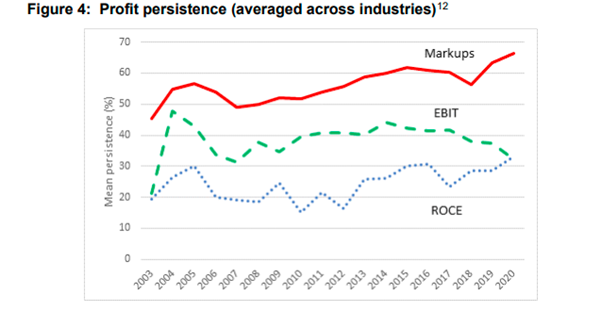
Recently, the UK’s Competitions and Market Authority (CMA) published an important report. The CMA found a mixed picture.Profit persistence has increased as measured by markups over marginal costs and the return on capital but not when measured by profits before tax.
And the CMA also found that the more international competition there was, the less ability for firms to increase prices and mark-ups. “This highlights the important role that international trade plays in contributing to keeping UK markets competitive.” The BIS summed up this debate: “In product markets, the degree of competition comes into play. Firms with higher markups – an indication of greater market power – could raise prices when wages increase, while those without such pricing power may hesitate to do so. Strategic considerations in price-setting are also relevant. Firms may feel more comfortable raising prices if they believe their competitors will also do so. Price increases are more likely when demand is strong. With less concern about losing sales and less room to adjust profit margins, even firms with less pricing power could pass higher costs through to customers.”
As a partner in the Bain consultancy, an adviser to many corporations, argued, “when times are tough, screw your customers while the screwing is good!”. The consultant went on: “I don’t think this is actually nefarious at all. Companies should charge what they can. Profit is the point of the whole exercise.”


May 3, 2022
It’s not looking good for 2022
Economic growth
The US economy unexpectedly contracted by 0.4% in the first quarter of 2022, compared to the previous quarter, due in large part to a decline in inventories and exports. Consumer and business spending continued to grow however, suggesting that activity still has some momentum.
US real GDP quarterly change %

Growth in the euro area slowed to 0.2% in the first quarter. The Italian economy contracted, the French economy posted 0% growth and Germany grew by 0.2%. China’s growth slowed in Q1 to 1.3% compared to 1.5% in Q4 2021. But the economy is still growing, despite the severe COVID lockdowns in key cities. Korea also slowed to 0.9% in Q1. Other countries like the UK and Japan are still to report Q1 growth.
And going into Q2, JP Morgan economists’ global manufacturing output PMI tumbled 2.4% points in April to its lowest level since June 2020. Global factory output for April is looking grim. At 48.5, the global manufacturing PMI points to an outright contraction of 0.8%ar in the three months through April. Given the tracking for February and March (0.35%m/m on average), the latest PMI points to a nearly 3% collapse in factory output last month.
Business returns
US corporate quarterly results were poor. Apple warned that supply chain disruption due to COVID-19 meant it was likely to struggle to meet consumer demand this quarter, affecting up to $8bn in revenue. Amazon reported a 3% fall in online sales in the first quarter of the year, pointing to an easing of the pandemic-driven boom on online retail. And Meta, formerly known as Facebook, reported its slowest revenue growth in a decade, reportedly as businesses cut discretionary advertising spending.
Amazon stock price $

Inflation
Alongside the growth slowdown, inflation continued to accelerate in the G7 economies. US inflation hit 8.5% and counting. US employment costs rose by 4.5% in the year to the first quarter, the fastest rate in 21 years. Euro area inflation accelerated to 7.5% in the 12 months to April, beating March’s record high of 7.4%. Netherlands inflation rose to 9.7% yoy. Both Brazil and Russia experienced double-digit rates. And even Korea and Australia reached 5%.
US CPI inflation yoy %

Interest rates
Both the Fed and the Bank of England are set to hike rates by at least 0.5% pts this week with likely further hikes during the rest of the year. The Reserve Bank of Australia hiked its policy rate for first time in eleven years. These hikes and the prospects of more are driving up lending costs as indicated by the US Treasury bond yields reaching 3% for the first time in three years; while mortgage rates rose, threatening to reverse the US house price bubble (US home prices are up 34% since the beginning of the pandemic). The Bloomberg global aggregate bond index has fallen by over 11% this year.
US ten-year government bond yield (%)

Currencies
With the US Fed planning as series of hikes and with worries about the global economy and war, the US dollar hit a twenty-year high against a basket of advanced economy currencies. The Chinese renminbi recorded its largest one month fall on record following growing concerns over future growth in the country and expectations of rising US interest rates. A strong dollar and rising interest rates are increasing the risk of default by a range of poor countries in the Global South.
US dollar index against other currencies

Financial assets
In the US, the real return on equities averaged 9.2% a year between December 1981 and December 2021, far outstripping growth in average real earnings of 0.5% a year and overall GDP growth of 2.7%.
But now things are changing fast. Global equity markets have fallen over 11% since January. Chinese equities and European stocks have seen larger declines with China suffering from renewed lockdowns and Europe vulnerable to the fallout from the war in Ukraine and disruption to the supply of Russian energy. The American equity market has a heavy exposure to technology. Shares in Facebook and Netflix have fallen 44% and 65% respectively this year after announcing declining user or subscriber numbers. Shares in Apple, Google and Amazon have also declined. Apple warned that supply chain problems and factory closures in China could cost the business $8bn in the current quarter.
US S&P 500 stock index

In sum: slowing growth, rising inflation and interest rates, falling financial returns; rising risk of defaults on loans; and war.
See my report Forecast for 2022. https://thenextrecession.wordpress.com/2022/01/01/forecast-for-2022/
May 2, 2022
A Marshall plan for Ukraine?
The Great Recession of 2008-9 was a turning point for the US global strategy. Up to then, the general aim was to ‘engage’ important economic powers like Russia and China. Throughout the 1990s onwards, the US government pressed for the opening-up of their economies to multi-nationals and banks from the ‘West’. These economies would then grow and trade, but in doing so also provide the global profits expansion that US imperialism needed as domestic profitability began to slip. ‘Globalisation’ would take advantage of cheap labour and new markets in China and the rest of the Global South which had expanded sharply from the early 1980s, under this policy of ‘engagement’. It was no accident that the World Bank published a report in 2013 calling on China to move quickly to a full ‘market economy’.
But the Great Recession changed all that. It became clear to the US strategists that, while globalisation brought extra profit, it also led to much faster economic expansion of countries like Russia, China and east Asia. The problem here was it was becoming clear that the likes of China and Russia (but particularly China) were not prepared to play ball with American imperialism and its multi-nationals. Russia sought to link up with Europe and separate it off from the UK and the US; while China sought to rival the US in technology and spread its influence throughout the global south. US capitalism plunged during the Great Recession and the advanced capitalist economies crawled along afterwards during the Long Depression of the 2010s. Meanwhile, China grew rapidly and Russia also built up it energy and mineral exports. This was too much. Something had to be done to put these rival economic powers in their place. ‘Engagement’ was dropped for ‘containment’.
Under the Trump administration, the US sought to isolate China with tariffs and bans on Chinese goods and companies. It insisted that Europe start paying for an expansion of NATO and arms in Europe. Under Biden, that policy was extended to back any pro-West and nationalist parties against Russia. The aim to was to include in NATO all countries along Russia’s borders, most of which were keen to take advantage of supposed economic prosperity from the European Union and ‘protection’ from Russian control with NATO. This has culminated in the Ukraine conflict.
Ukraine is now being destroyed by Russian bombing and arms. Thousands have died, millions have been displaced and/or fled the country. The economic base of the country is being annihilated. Before the war, Ukraine was already a very poor country with a real GDP of just $160bn. Before this war is over – and it looks like lasting years, not weeks or months any more, that GDP is going to be halved at least.
Ukrainian sources estimate the cost of restoring infrastructure: financing the war effort (ammunition, weapons, etc.); losses of housing stock, commercial real estate, compensation for death and injury, resettlement costs, income support, etc.) and lost current and future income at from $500 billion to $1,000 billion. The World Bank estimates that Ukraine’s produced capital stock per capita in 2014 was approximately $25,000, which amounts to approximately $1.1 trillion at the aggregate level. Early reports by government officials and business leaders suggest that 30-50% of that capital stock has been destroyed or severely damaged. Assuming 40% destruction, the cost stands at $440 billion. In addition, on the assumption of a cost of €10,000 per refugee (per year), the cost of financing 5 million refugees for one year is €50bn, or 0.35% EU GDP. So to restore the Ukraine economy and rebuild is likely to cost $500bn minimum, say over the next five years. That’s about 1.0% of EU GDP per year or 0.75% of G7 GDP – at a minimum.
Will the West in its wisdom decide that it is worth spending that sort of money to fund Ukraine’s war effort indefinitely, supporting its population and rebuilding the country as a NATO bulwark against Russia? It looks like it. Ukraine is becoming the touchstone of the US global containment policy. Already US President Biden is pushing US Congress to agree to $30bn in support of Ukraine. But he is refusing to cancel or reduce student debt that has now reached $1.8trn. International policy is more important that helping American youth to get an education.
For example, here’s what Martin Sandbu, the Keynesian columnist in the FT, said: “the EU, which should shoulder the bulk of this (and support radical debt relief for Kyiv as with post-war Germany) should not see this as an expense. EU companies will be contracted for infrastructure, housebuilding, transport and more — but should transfer skills and technology to Ukrainians. Beyond this, it is an investment in Europe’s values and its security. It would bring 44mn people firmly inside the liberal democratic fold and into the social market economy — a historic achievement to rival the continent’s post-cold war reunification and the Marshall Plan itself.”
Will the US and Europe go further and opt for what might be called a Marshall Plan for Ukraine? The Marshall Plan (officially the European Recovery Program, ERP) was an American initiative enacted in 1948 to provide foreign aid to Western Europe. The initiative was named after United States Secretary of State George C. Marshall. The US transferred over $13 billion in economic recovery programs to Western European economies after the end of WW2. The aims was to rebuild war-torn regions, remove trade barriers for US mulit-nationals, modernize industry, improve European prosperity, and so prevent the spread of communism George Marshall’s stated goal in his 1947 speech was “to permit the emergence of political and social conditions in which free institutions can exist”.
How does the Marshall Plan compare with the cost of an aid plan for Ukraine? Well, $13bn in 1948 was about 1.1% of US GDP then and is equivalent to about $130bn now. So any Marshall Plan for Ukraine would have to deliver double that, as shared between the US and Europe. The 1948 plan was composed of both outright grants and loans. The aid accounted for about 3% of the combined GDP of the recipient countries between 1948 and 1951, which meant an increase in GDP growth of less than half a percent. Ukraine will need much more.
What really revived Europe’s capitalist economies from 1948 was not so much the Marshall Plan, but the opening-up of US and European markets to Europe’s industries, which could expand based on very cheap and plentiful labour after the war and the ability to purchase the latest technology. Is that the way forward for a weak and destroyed Ukraine? Only if Ukrainians can live on extremely low wages and expect little in the way of public services, while Ukraine’s capitalists (who used to be called ‘oligarchs’) and US and Europe’s multi-nationals take over Ukraine’s natural resource base.
But It seems that the US (and Europe more reluctantly) are prepared to stump up the cash to get Ukraine fully restored as a pro-West state in order to weaken Putin’s Russia. Most historians reckon that the political gains for capitalism after 1945 from of the Marshall Plan were even more important than the direct economic ones. Europe was kept safe from Communism. Indeed, the CIA received 5% of the Marshall Plan funds (about $685 million spread over six years), which it used to finance secret operations abroad. Through the Office of Policy Coordination, money was directed toward support for pro-business labour unions, and anti-Communist newspapers, student groups, artists and intellectuals.
In an analysis of the Marshall Plan, Keynesians Bradford DeLong and Barry Eichengreen concluded that: “It was not large enough to have significantly accelerated recovery by financing investment, aiding the reconstruction of damaged infrastructure, or easing commodity bottlenecks. We argue, however, that the Marshall Plan did play a major role in setting the stage for post-World War II Western Europe’s rapid growth. The conditions attached to Marshall Plan aid pushed European political economy in a direction that left its post-World War II “mixed economies” with more “market” and less “controls” in the mix.
As for Ukraine, it is not the end of the cost for the West. The US is now insisting that Europe break with the use of Russian oil and gas. Phasing that out even as fast as the end of this year is going to cost Europe in higher energy prices and lower supply. That will take perhaps another 0.5% of GDP out of the European economy, which is already heading towards a recession. Inevitably that will force governments to expand their spending, both on weapons to meet new NATO commitments and on ‘butter’ as unemployment rises.
Again, this is at a time when government debt to GDP in most economies is at its highest since the Marshall Plan began. According to the IMF, global government debt to GDP stands at 97%, up 20% just from 2017 and is forecast still to be way higher in 2027 than in 2019 before the COVID pandemic hit. In the advanced capitalist economies, government debt to GDP was over 120% in 2020, with US gross debt at 134%. If you include private sector debt, then global debt reached 290% of GDP in 2021, up 40% from 2001. And the IMF forecast for 2027 does not take into account a Marshall Plan for Ukraine and the NATO build-up.
 Source: BIS
There is big price ahead for working people in the West to pay for saving Ukraine from Russian domination and opening up the country to Western multi-nationals. But it seems to the strategists of capital that it is a price worth paying by the working people of Europe and the US, with more costs to come in dealing with China over the rest of this decade.
Of course, the burden of funding Ukraine could be reduced if the Western powers order the seizure of Russian FX reserves held abroad as reparations for Ukraine – that might be worth some $400bn. But then that would be another step up the ladder towards outright confrontation with resisting powers like China. No wonder this week Chinese leaders discussed how to protect their $3trn of FX reserves from seizure by the Western powers.

April 27, 2022
Has globalisation ended?
Apart from inflation and war, what grips current economic thought is the apparent failure of what mainstream economics likes to call ‘globalisation’. What mainstream economics means by globalisation is the expansion of trade and capital flows freely across borders. In 2000, the IMF identified four basic aspects of globalisation: trade and transactions, capital and investment movements, migration and movement of people, and the dissemination of knowledge. All these components apparently took off from the early 1980s as part of the ‘neoliberal’ reversal of previous national macro-management policies adopted by governments in the environment of the Bretton Woods world economic order (ie US hegemony). Then the call was to break down tariff barriers, quotas and other trade restrictions and allow the multi-nationals to trade ‘freely’ and to switch their investments abroad to cheap labour areas to boost profitability. This would lead to global expansion and harmonious development of the productive forces and resources of the world, it was claimed.
There was nothing new in this phenomenon. There have been periods of increased trade and capital export before since capitalism became the dominant mode of production in the major economies by the mid-19th century. In 1848, the authors of the Communist Manifesto noted the increasing level of national inter-dependence brought on by capitalism and predicted the universal character of the modern world society: “The bourgeoisie has through its exploitation of the world market given a cosmopolitan character to production and consumption in every country. To the great chagrin of Reactionists, it has drawn from under the feet of industry the national ground on which it stood. All old-established national industries have been destroyed or are daily being destroyed…. In place of the old local and national seclusion and self-sufficiency, we have intercourse in every direction, universal inter-dependence of nations.”
Indeed, we can distinguish previous periods of ‘globalisation’. There was the period of 1850-70 which saw trade and investment expand sharply in Europe and the US (after the civil war), under the auspices of the British hegemony. The depression of the 1870s to 1890s saw the end of that wave. But another wave of global expansion took place in 1890s through to WW1, as new capitalist powers usurped British hegemony. No one power established hegemony and that globalisation wave was stopped in its tracks by world war and continued to reverse through the Great Depression of the 1930s and up to WW2. Then there was a new wave of global expansion under Bretton Woods and US hegemony, before the profitability crisis of the 1970s led to slumps and retraction. From the mid-1980s and through 1990s, there was the largest expansion of trade and cross-border investment in the history of capitalism, with the US and European capitalism spreading its wings further and China entering global manufacturing and trading markets.
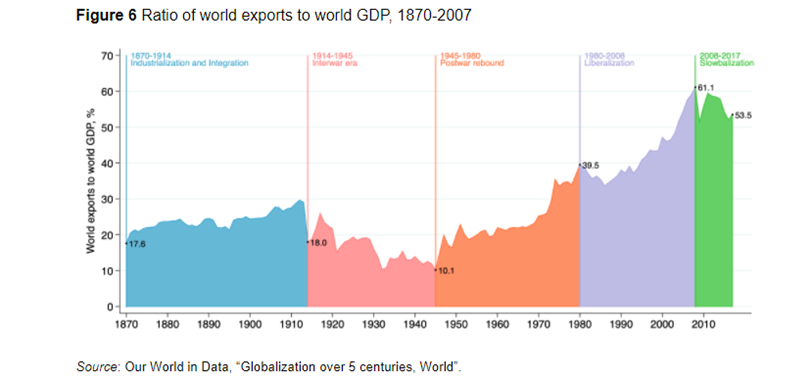
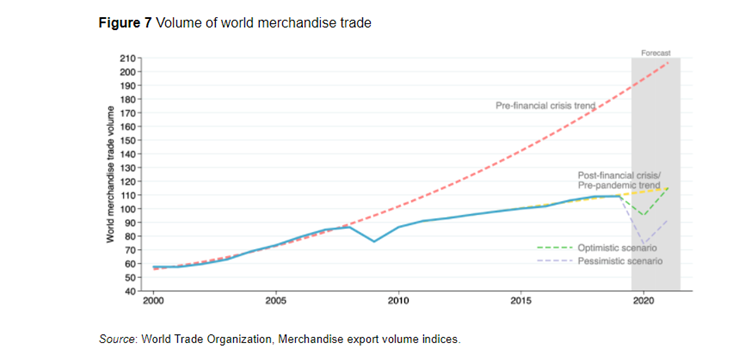
Indeed, according to the World Trade Organisation, a key indicator of ‘globalisation’, the ratio of world exports to world GDP, was broadly flat between 1870 and WW1, fell by nearly 40% in the interwar period; rose 50% from 1950-70; then stagnated until the 1990s, taking off until the Great Recession of 2009; after which, in the Long Depression of the 2010s, the ratio fell by about 12%, a decline not seen since the 1970s.
The latest globalisation wave started to wane as early as the beginning of the 2000s when global profitability slipped back.
 Penn World Table 10.0, author calculations
In the 1990s, world trade rose by 6.2% annually, cross-border investment (FDI) by 15.3% a year and GDP globally by 3.8%. But in the long depression of the 2010s, trade rose only 2.7% a year, slower than GDP at 3.1% while FDI rose only 0.8% a year.
Flows of cross-border investment in physical productive assets also stopped growing in the 2010s, while the global ‘value chain’ trade (ie internal multi-national company transfers) also flattened.
Global value chain trade
 World Trade Organisation
Of course, Marxist economics could have revealed this outcome of globalisation. David Ricardo’s ‘thought theory’ of comparative advantage has always been demonstrably untrue. Under capitalism, with open markets, more efficient economies will take trade share from the less efficient. So trade and capital imbalances do not tend towards equilibrium and balance over time. On the contrary, countries run huge trade deficits and surpluses for long periods, have recurring currency crises and workers lose jobs to competition from abroad without getting new ones from more competitive sectors (see Carchedi, Frontiers of Political Economy p282). It is not comparative advantage or costs that drive trade gains, but absolute costs (in other words relative profitability). If Chinese labour costs are much lower than American companies’ labour costs, then China will gain market share, even if America has some so-called “comparative advantage” in design or innovation. What really decides is the productivity level and growth in an economy and the cost of labour.
Contrary to the views of the mainstream, capitalism cannot expand in a harmonious and even development across the globe. On the contrary, capitalism is a system ridden with contradictions generated by the law of value and the profit motive. One of those contradictions is the law of uneven development under capitalism – some competing national economies do better than others. And when the going gets tough, the stronger start to eat the weaker. As Marx once said, “capitalists are like hostile brothers who divide among themselves the loot of other people’s labour.” (Theories of Surplus Value Vol 2. p29). Sometimes brothers are fraternal and globalisation expands as in the late 20th century; sometimes they are hostile and globalisation wanes – as in the 21st century.
For Marxist theory, globalisation is really the mainstream word for expanding imperialism. The 20th century started with world capitalism increasingly divided between an imperialist bloc and the rest, with the latter unable (with very few exceptions) to bridge the gap to the top table over the next 100 years. In the 21st century the grip of imperialism remains and if the imperialist economies start to struggle for profitability as they are now, then they start to fight and not cooperate, laying the basis for conflict and division.
Even the mainstream is now aware that free trade and free movement of capital that accelerated globally over the last 30 years has not led to gains for all – contrary to the mainstream economic theory of comparative advantage and competition. Far from globalisation and free trade leading to a rise in incomes for all, under the free movement of capital owned by the trans-nationals and free trade without tariff and restrictions, the big efficient capitals have triumphed at the expense of the weaker and inefficient – and workers in those sectors take the hit. Instead of harmonious and equal development, globalisation has increased inequality of wealth and income, both between nations and also within economies as trans-national corporations move their activities to cheaper labour areas and bring in new technology that requires less labour.
These outcomes are down partly to globalisation by multinational capital taking factories and jobs into what used to be called the Third World; and partly due to neo-liberal policies in the advanced economies (i.e. reducing trade union power and labour rights; casualization of labour and holding down wages; privatisation and a reduction in public services, pensions and social benefits). But it is also down to regular and recurrent collapses or slumps in capitalist production, which led to a loss of household incomes for the majority that can never be restored in any ‘recovery’, particularly since 2009. The capitalist world was never flat even in the late 20th century – and it is certainly mountainous now.
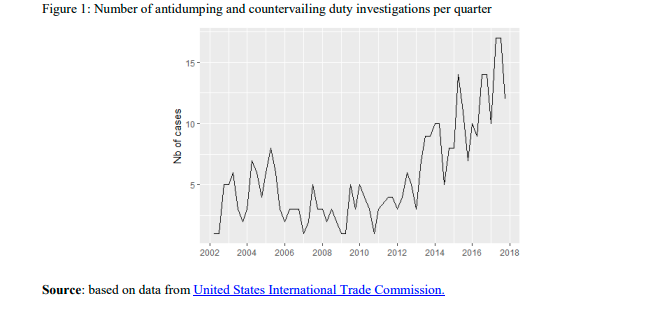
Take tariffs and protectionist measures – the anathema of globalisation theorists. There has been an upward trend in antidumping and countervailing duty investigations in the last ten years (see figure below).
The Great Recession, the weak recovery afterwards in the Long Depression, the COVID pandemic and now the Russia-Ukraine conflict, has blown away global supply chains, stymied global trade and stopped capital movements.
During the 1990s and 2000s, mainstream economics (with few exceptions) lined up with Ricardo and the unblemished merits of globalisation. Just read this piece for the list of the usual suspects (https://www.theguardian.com/world/2017/jul/14/globalisation-the-rise-and-fall-of-an-idea-that-swept-the-world). In the teeth of current trends, some mainstream experts still stick to the view that globalisation will return. “It was inflation that helped create a new policy environment in the mid-19thcentury and in the 1970s. As the economic and political costs of inflation became more obvious and more damaging, it appeared more attractive to look for ways to calm inflationary pressures. For sure, the disinflationary cure — more globalisation as well as more effective government — was temporarily uncomfortable. But it drove the world to seize technical and geographical opportunities once ignored or neglected. There is, in short, a post-conflict future to which we might look forward with some degree of hope.”
One expert claimed that “Finally, call this blind faith, but the last rites for globalisation have been read several times, and on each occasion, it’s bounced up from its sickbed looking quite sprightly. Companies have been resourceful, technology supportive, and even actively destructive governments haven’t crashed it.” Sure, world trade and cross-border investment is not going to disappear and will continue a grow (somewhat) despite pandemics, wars and collapsed supply chains. But that is hardly an argument for saying the previous globalisation wave is not over.
The argument is that the profitability and inflation crisis of the 1970s was followed by the globalisation wave of the 1980s and 1990s. and this could happen again. It’s not a very convincing scenario. The 2020s looks more like the period leading up to WW1, with rival economic powers struggling to gain a chunk of profits (‘hostile brothers’). Writing in the late 1880s, Engels forecast, not harmonious global expansion as German Social-Democrat leader and theorist Karl Kautsky thought, but increased rivalry among competing economic powers resulting in a new European war: “the depredations of the Thirty Years war (of the 17th century) would be compressed into three to four years and extended over the entire continent… with an irretrievable relocation of our artificial system of trade, industry and credit.”, (see my book Engels 200 p129). No return to the global expansion of 1850-70.
The Keynesians seek to return to the days of Bretton Woods with its fixed exchange rates, government fiscal stimulus and gradually reduced tariffs. The Keynesians claim that this would a revival of ‘multilateralism’ and global cooperation. This apparently can restore a world order of peace and harmony. But this is just a denial of history and the reality of the 2020s. The multilateral organisations of the post-war era like the IMF, World Bank and the UN were all under the kind ‘guidance’ of US capitalism. But now US hegemony is no longer secure; but more significant, the high profitability for the major economies post-1945 no longer exists. The brothers are no longer fraternal, but hostile. The current US attempt to maintain its hegemony is more like to trying herd cats into a bag.
It’s perfectly possible to argue that for capital, “Deglobalisation would decrease the efficiency of companies by raising prices and lowering competition and that “with any reversal predicted to slow growth, a deglobalized world would be “vastly inferior” to the past 30 years of open trade.” A recent study by the World Trade Organisation, based on measuring the dynamic impact of lost trade and technology diffusion, found that “a potential decoupling of the global trading system into two blocs – a US-centric and a China-centric bloc – would reduce global welfare in 2040 compared to a baseline by about 5%. Losses would be largest (more than 10%) in low-income regions that benefit most from positive technology spillovers from trade”. Indeed, the collapse of globalisation could turn, not just into a battle between two blocs, but instead into a melange of competing economic units.
But globalisation will only return if and when capitalism gains a new lease of life based on enhanced and sustained profitability. That seems unlikely to happen this side of another slump and maybe more war.
April 25, 2022
Fragmented France
The second round of the French presidential election returned the incumbent President Emmanuel Macron to a second term of office. Macron won with 58.5% of the vote against the opponent, Marine Le Pen of the right-wing nationalist National Rally, who got 41.5%. Sounds comfortable – but the voter turnout of 72% was the lowest since 1969. Moreover, Le Pen did better than in 2017, showing that Macron’s neoliberal policies of cutting pensions, reducing the health service and ‘liberalising’ the labour market have not been received well by a sizeable body of the electorate. In the first round, Macron polled only 28% of those voting, or about 21% of those eligible to vote, while Le Pen took 23%. Left-wing candidate Jean-Luc Melenchon polled 22% and nearly made the run-off, despite the ecology and other socialist candidates splitting the vote. Melenchon’s supporters abstained in large numbers in the second round, some voted for Macron, but few for Le Pen.
Basically, France is split three ways politically. One-third backs a pro-EU, pro-capitalist France as represented by Macron; one-third backs a nationalist, anti-EU ‘Frexit’, anti-immigration France as represented by Le Pen; and one-third backs a socialist pro-labour France as represented by Melenchon. This fragmentation is likely to be further exposed in the upcoming parliamentary elections. It’s possible that Macron’s party will lose its majority in the National Assembly and Macron will have to appoint a prime minister and cabinet that is in opposition to his policies – a further fragmentation of French politics at a time when France is taking on a senior position in EU policy over the Ukraine conflict and sanctions against Russia.
France is a key G7 economy, the fifth largest in the world and represents around one-fifth of the Euro area GDP. In manufacturing, France is one of the global leaders in the automotive, aerospace and railway sectors as well as in cosmetics and luxury goods. It has a highly educated labour force and the highest number of science graduates per thousand workers in Europe. Its services sector is large, led by tourism and financial services. Additionally, France is one of the world’s largest exporters of farm and agricultural products and is renowned for its wine, spirits and cheeses. The French government provides significant subsidies to this sector and France is the largest exporter of farm products in Europe. France is linked closely to its largest trading partner, Germany, which accounts for more than 17% of France’s exports and 19% of total imports.
After the failure of the Mitterrand government’s attempt to sustain Keynesian policies in the teeth of a global slump in the early 1980s, successive governments have applied neo-liberal policies of privatisation, tax and welfare cuts to boost profitability – despite opposition by working-class movements and the trade unions. Governments either partially or fully privatized many national industries, including Air France, France Telecom and Renault, and today, France’s leaders remain committed to capitalism. However, the French government still plays a role in certain key national sectors, such as agriculture, and will intervene in the market to sustain certain ‘national interests’. For example, the energy companies are publicly owned and since the oil and gas price rises, were directed to hold price increases to just 4% this year, while the privatised UK companies have been allowed to raise tariffs by nearly 60%.
In recent years, France, similar to many western European nations, has experienced poor real GDP growth. France’s real GDP grew just 1.27% a year from 2011 to 2019, just before COVID and the unemployment rate remains high. The French economy performed better than expected after the calamitous effects of the Covid crisis, with 6% growth in 2021 – higher than Germany, Italy and Spain. Unemployment sank to 7.4% in the fourth quarter of 2021, its lowest rate since 2008. But slowing global growth and the war in Ukraine will deliver a much weaker recovery this year.
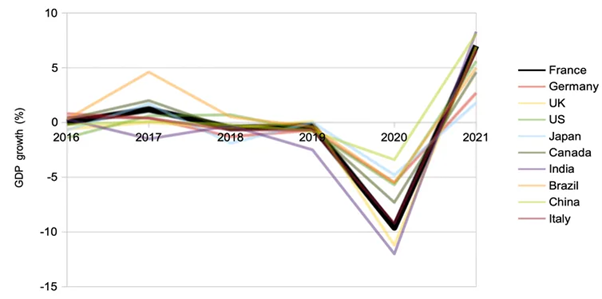 Real GDP growth
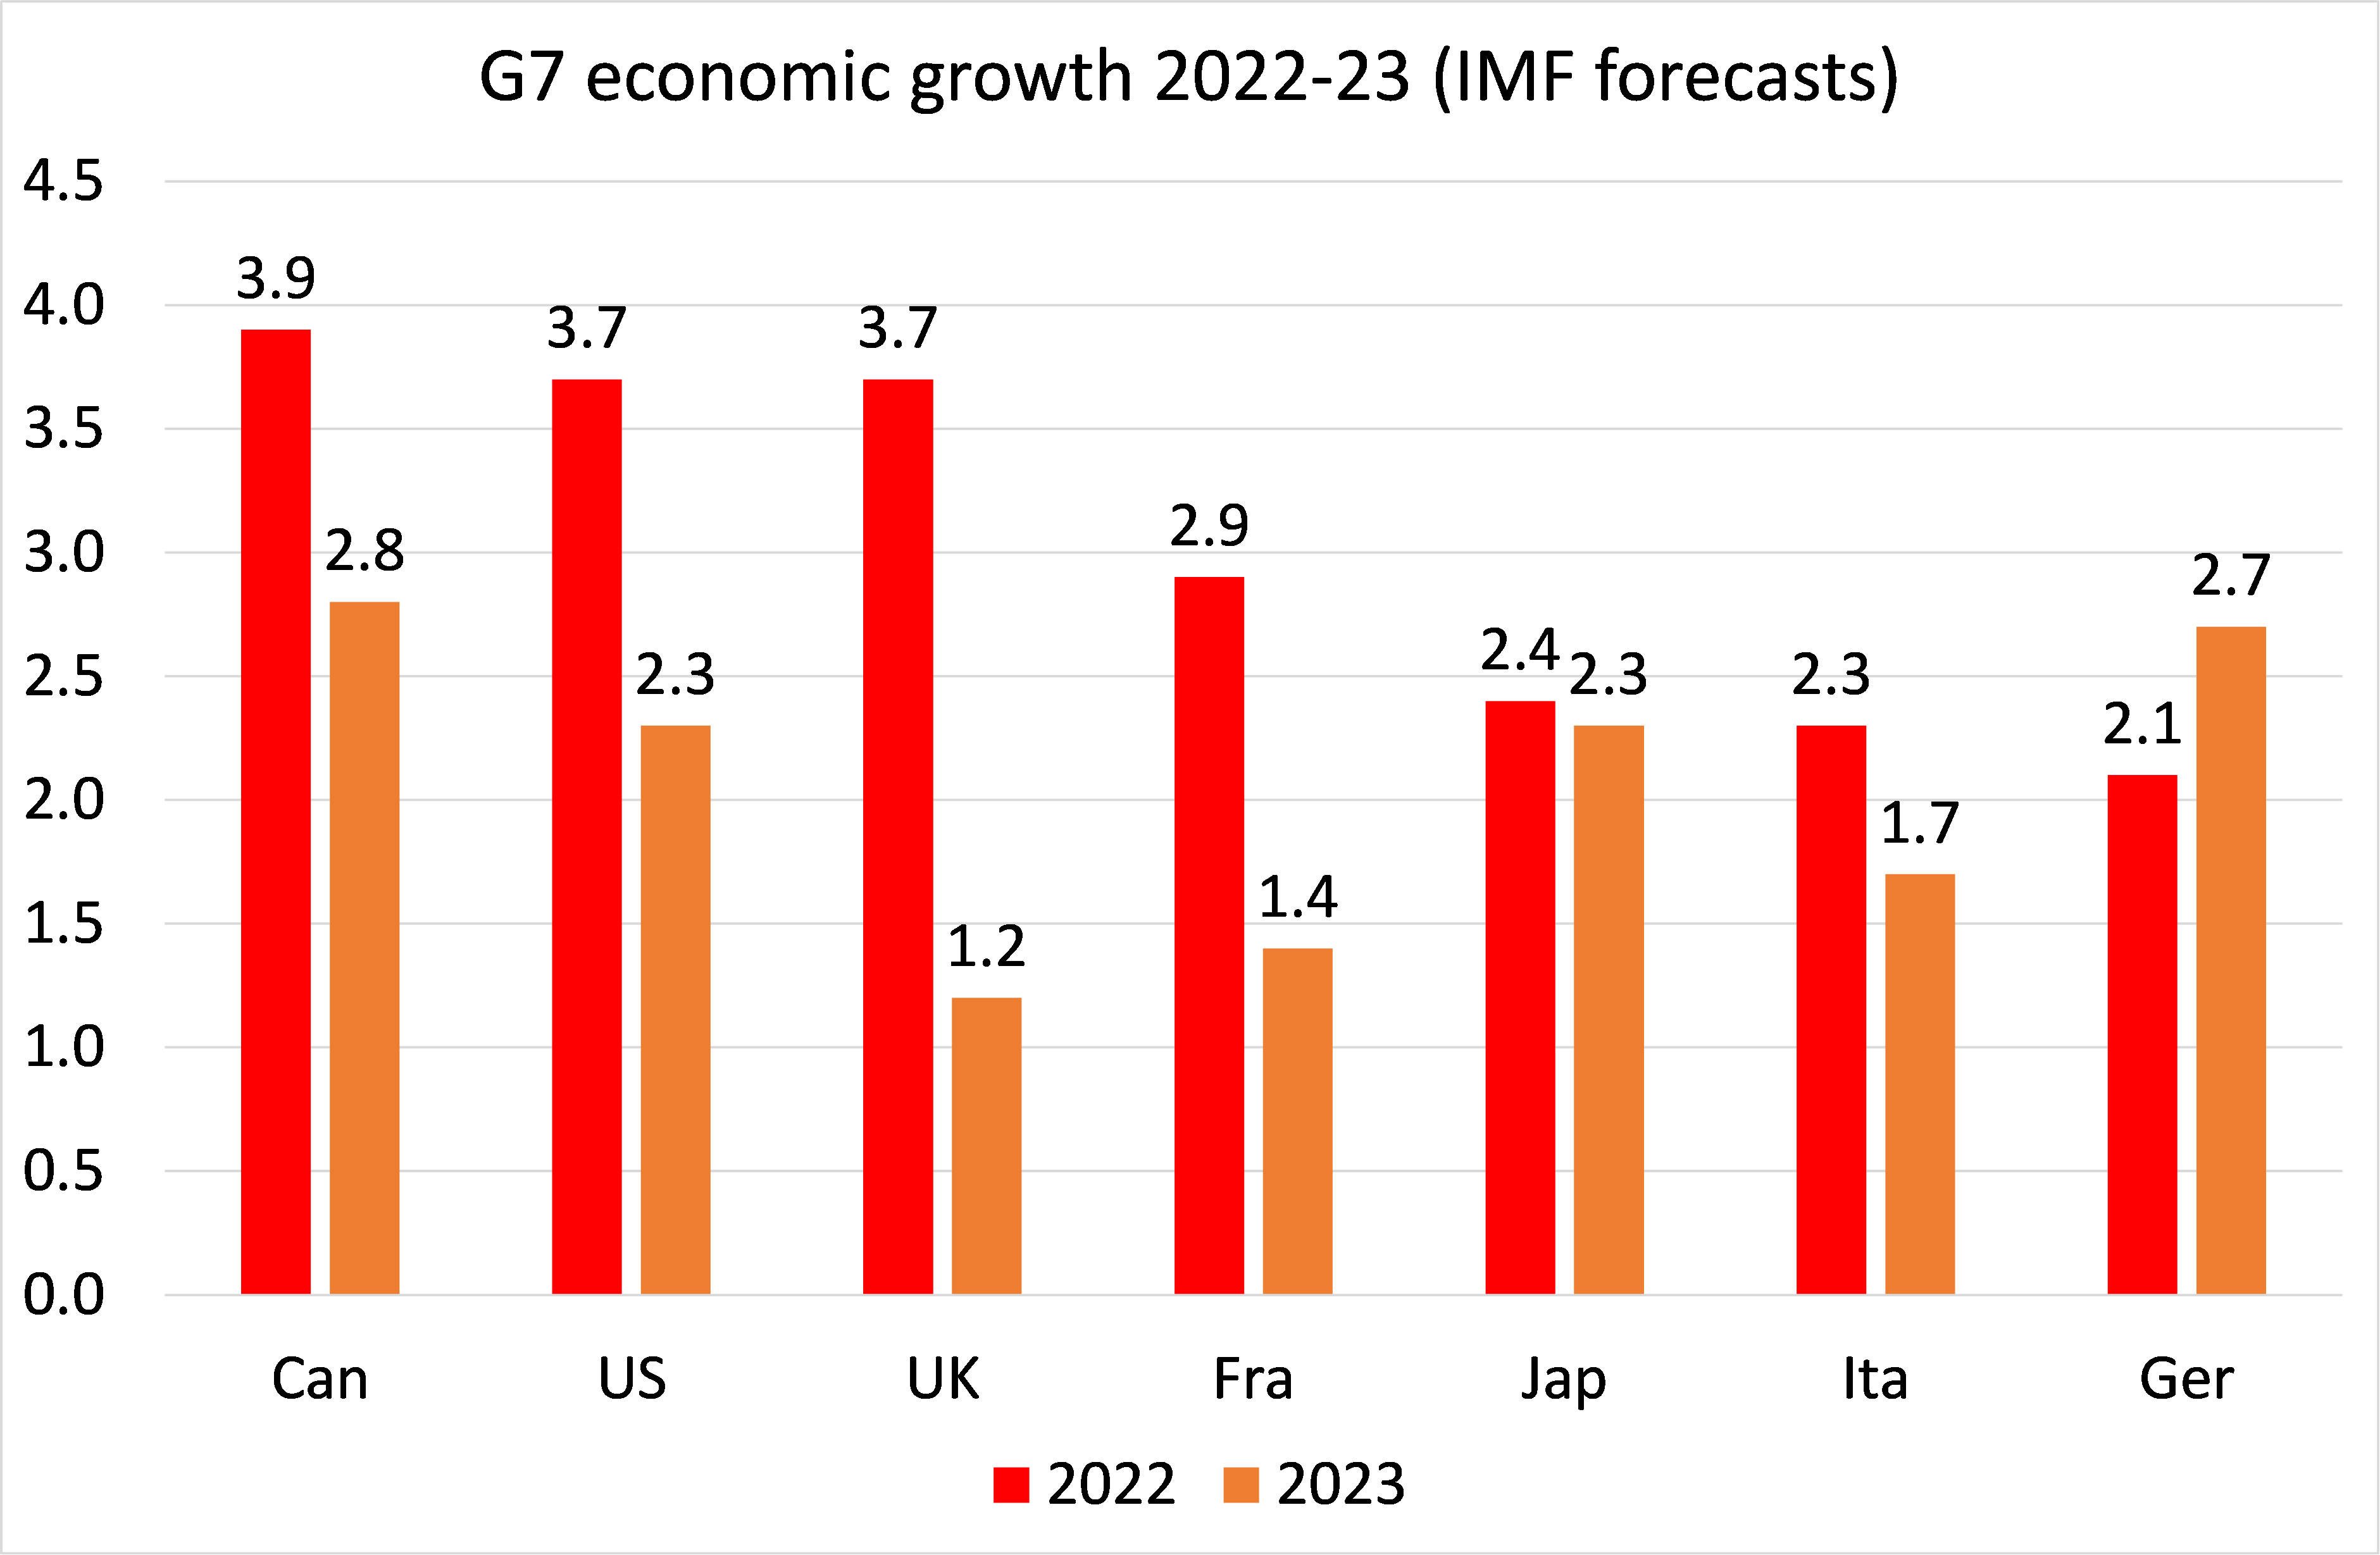
Like other G7 economies, the French economy is suffering from the global supply chain breakdown, rising energy and food prices and the Ukraine war. The IMF forecasts real GDP growth this year of just 2.9% and only 1.4% next year. Over those two years, only Italy is expected to grow more slowly in the G7.
Indeed, the French capitalist economy has followed the same pattern as the other G7 economies in the 21st century: slowing economic growth, then the Great Recession, followed by even weaker growth and investment,…

… and stagnating productivity.

As always, behind this relative stagnation lies the falling profitability of capital. French capital’s profitability peaked at the beginning of the 21st century and has trended down since. There was a sharp fall in the Great Recession and no recovery in the last decade, culminating in another sharp drop in the COVID 2020 slump.
 AMECO
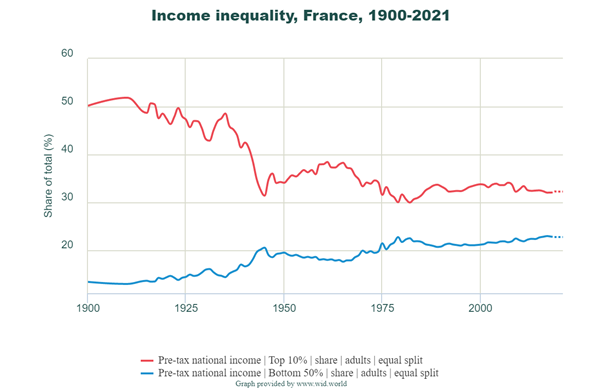
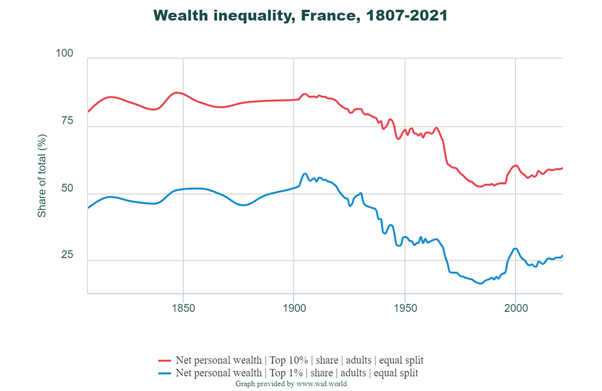
AMECO Inequality of incomes and wealth, while lower than in the US or the UK, remain relatively high and unchanged for the last 40 years.
Successive governments, whether of the centre-left or centre-right, have failed to deliver increased prosperity, full employment and a reduction in inequality. As the global capitalist economy deteriorates, with the rising prospect of a new recession, a Macron government will change nothing, except probably for the worse.
April 18, 2022
The inflation debate
The inflation debate among mainstream economists rages on. Is the accelerating and high inflation rate of commodities here to stay for some time and or is ‘transitory’ and will soon subside? Do central banks need to act fast and firmly to ‘tighten’ monetary policy (ie cut back on injection credit into banks through purchases of government bonds (QE) and start hiking policy interest rates sharply? Or is such tightening an overkill and will cause a slump?
I have covered these issues in several previous posts in some detail. But it is worth going over some of the arguments and the evidence again because high and rising inflation is severely damaging to the livelihoods and prosperity of most households in the advanced capitalist economies and even a matter of life and death for hundreds of millions in the so-called Global South of poor countries. Being made unemployed is devastating for those who lose their jobs and for their families. But unemployment affects usually only a minority of working people at any one time. Inflation, on the other hand, affects the majority, particularly those on low incomes where basic commodities like energy, food, transport and housing matter even more.
In a recent book, Rupert Russell pointed out that the price of food has often been decisive historically. Currently the global food price index is at its highest ever recorded. The hits people living in the Middle East and North Africa, a region which imports more wheat than any other, with Egypt the world’s largest importer. The price of these imports is set by the international commodity exchanges in Chicago, Atlanta and London. Even with the government subsidies, people in Egypt, Tunisia, Syria, Algeria and Morocco spend between 35 and 55 per cent of their income on food. They’re living on the edge: small price rises bring poverty and hunger. Russell reminds us that grain was key to almost every stage of World War I. Fearing the threat to its grain exports, imperial Russia helped provoke that global conflict. As the conflict dragged on, Germany, also suffered from a dearth of cheap bread and looked to seize Russia’s bountiful harvest. “Peace, Land, and Bread” was the Bolshevik slogan, and success had much to do with bread and the control of the new grain pathways inside Russia. Now the Russian invasion of Ukraine puts the harvest of these two leading grain exporters in jeopardy.

Indeed, when you consider food prices, one of the key contributors, along with energy prices, to the current inflationary spiral, it exposes the inadequacies of mainstream explanations of inflation and their policy remedies. Current inflation is not the product of ‘excessive demand’ (Keynesian) or ‘excessive monetary injections’ (monetarist). It is the result of a ‘supply shock’ – a dearth of production and supply chain breakdown, induced by the COVID pandemic and then by the Russia-Ukraine conflict. The recovery after the COVID slump in the major economies has been faltering – every major international agency and analytical research consultancy has been lowering its forecast of economic growth and industrial production for 2022. At the same time, these agencies and central banks have revised up their forecasts for inflation and for the length of time it will stay high.
Central banks have little control over the ‘real economy’ in capitalist economies and that includes any inflation of prices in goods or services. For the 30 years of general price disinflation (where price rises slow or even deflate), central banks struggled to meet their usual 2% annual inflation target with their usual weapons of interest rates and monetary injections. And it will be the same story in trying this time to reduce inflation rates. As I have argued before, all the central banks were caught napping as inflation rates soared. And why was this? In general, because the capitalist mode of production does not move in a steady, harmonious and planned way but instead in a jerky, uneven and anarchic manner, of booms and slumps. But also, they misread the nature of the inflationary spiral, relying as they do on the incorrect theories of inflation.
I would argue that this supply-side ‘shock’ is really a continuation of the slowdown in industrial output, international trade, business investment and real GDP growth that had already happened in 2019 before the pandemic broke. That was happening because the profitability of capitalist investment in the major economies had dropped to near historic lows, and as readers of this blog know, it is profitability that ultimately drives investment and growth in capitalist economies. If rising inflation is being driven by a weak supply-side rather than an excessively strong demand side, monetary policy won’t work.
The hardline monetarists call for sharp rises in interest rates to curb demand while the Keynesians worry about wage-push inflation as rising wages ‘force’ companies to raise prices. But inflation rates did not rise when central banks pumped trillions into the banking system to avoid a meltdown during the global financial crash of 2008-9 or during the COVID pandemic. All that money credit from ‘quantitative easing’ ended up as near-zero cost funding for financial and property speculation. ‘Inflation’ took place in stock and housing markets, not in the shops. What that means is that US Federal Reserve’s ‘pivot’ towards interest rate rises and reverse QE will not control inflation rates.
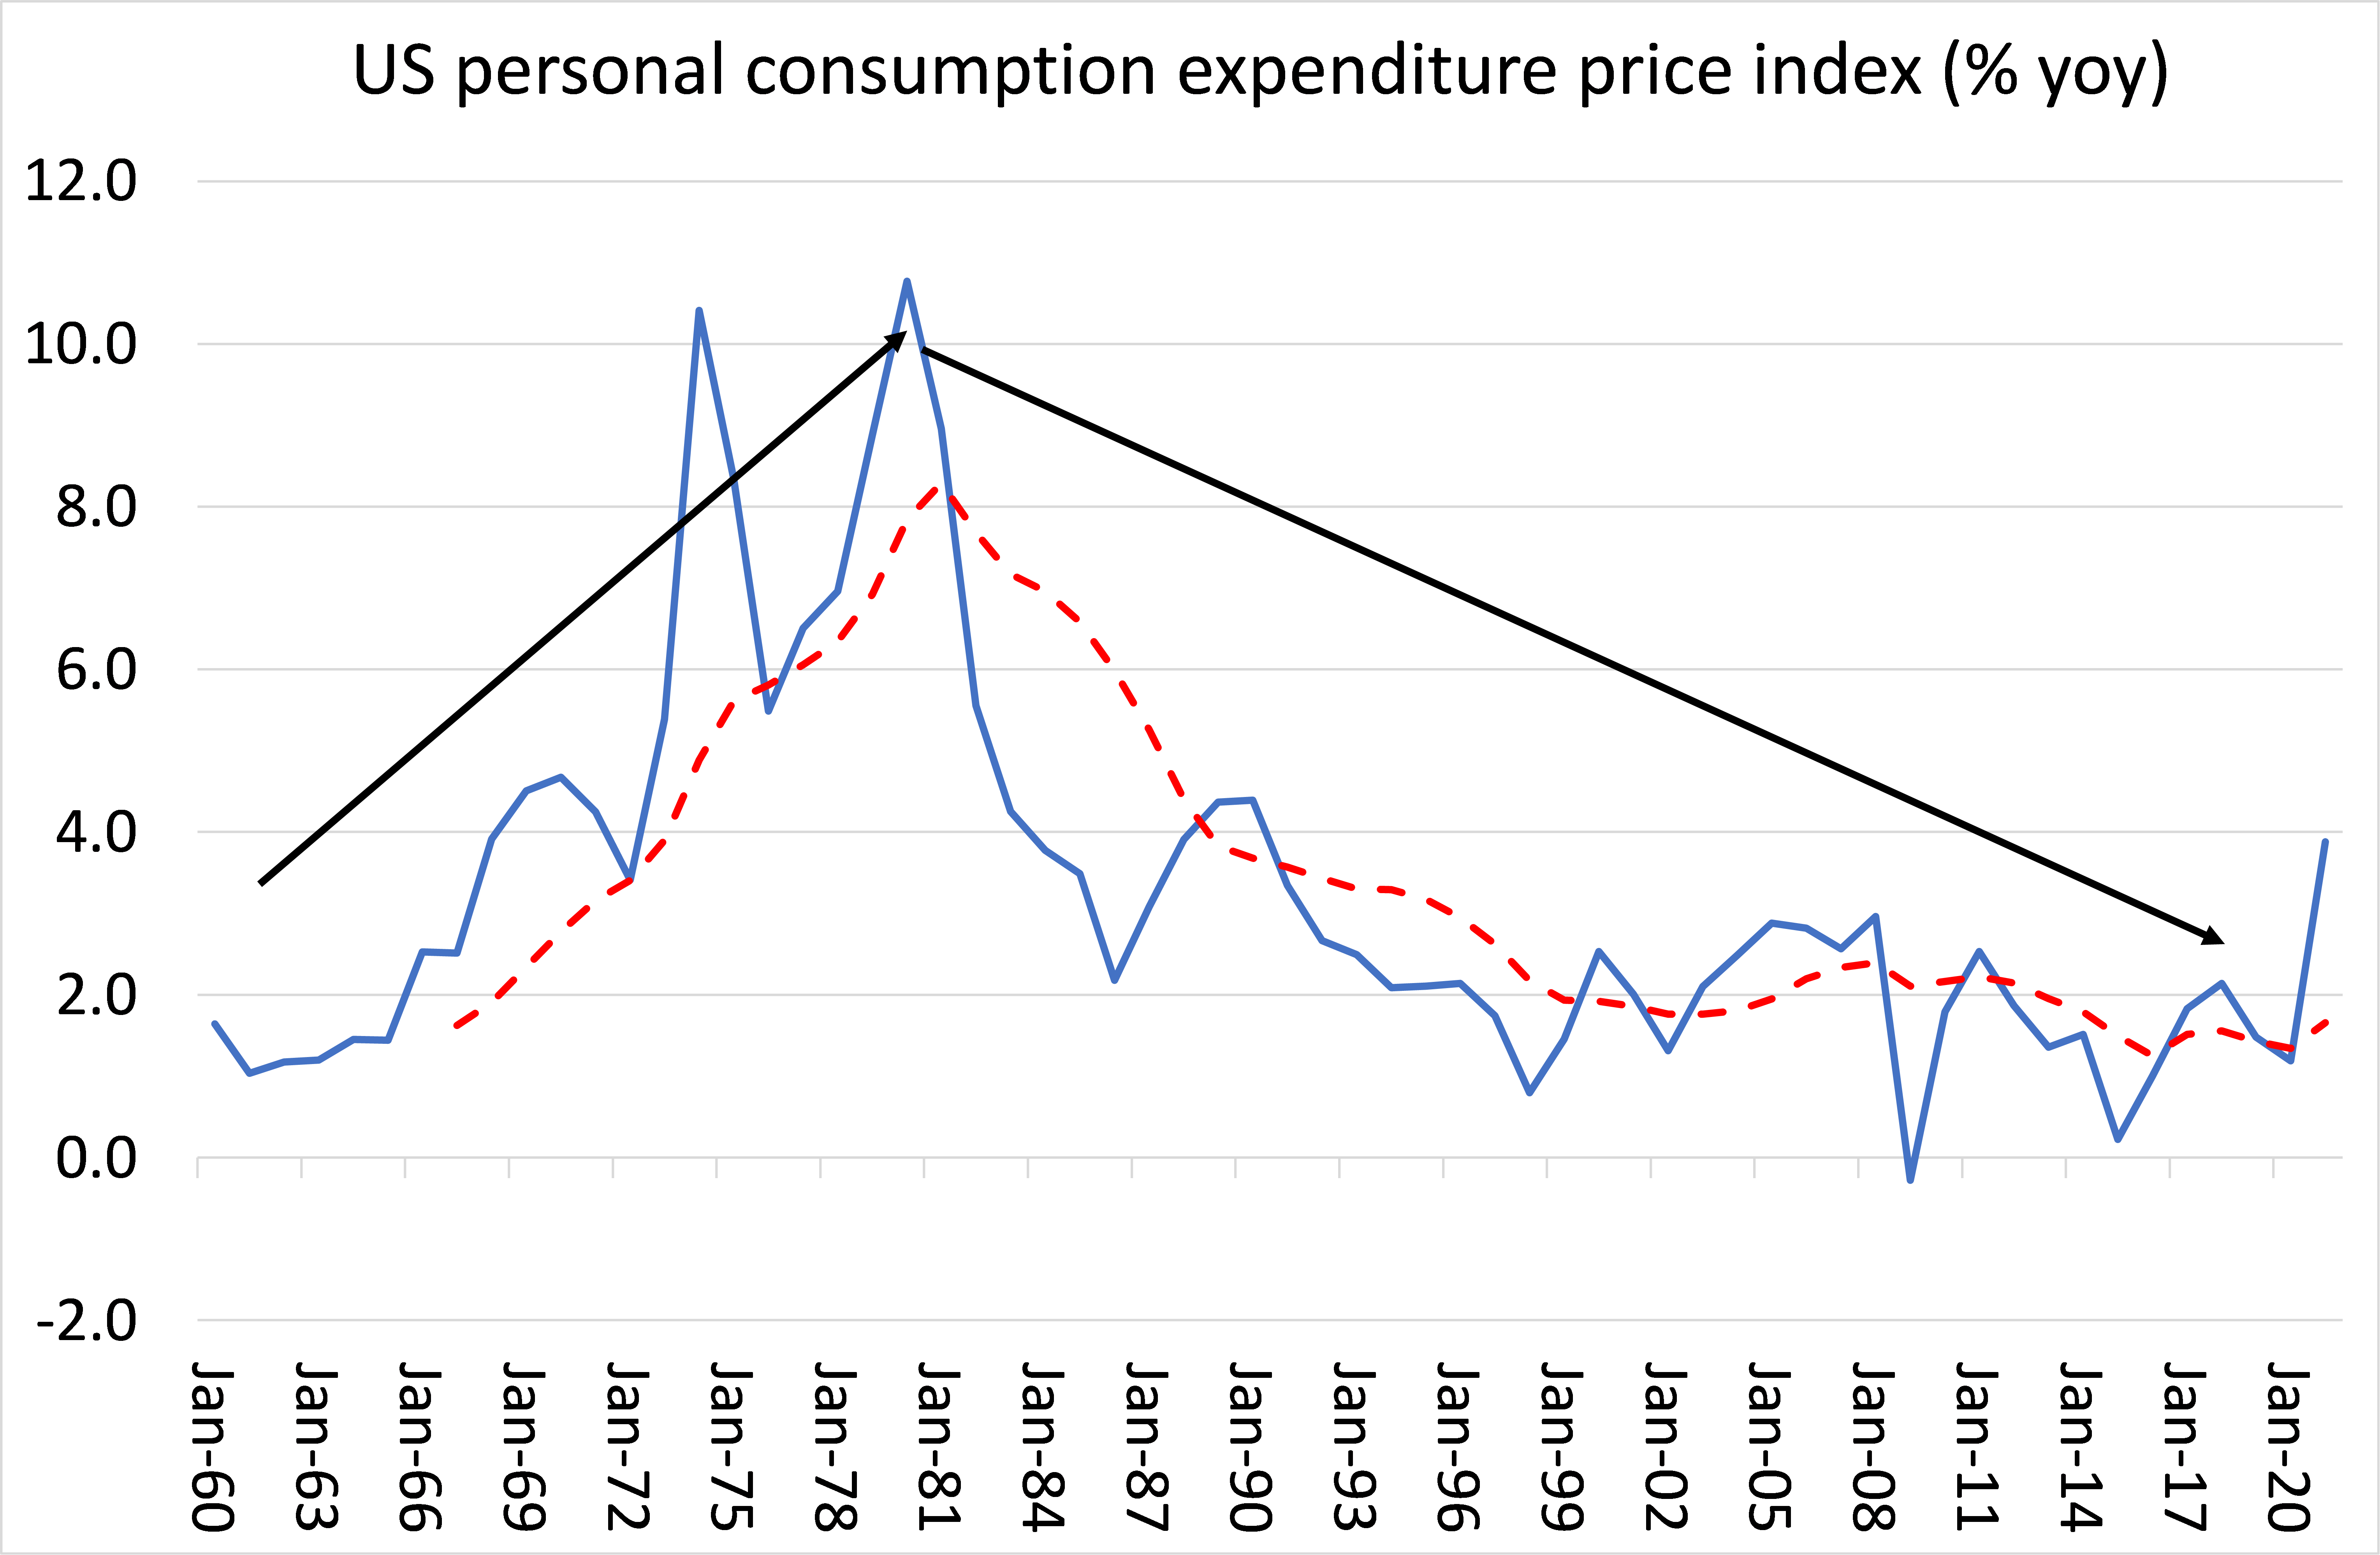
The other mainstream theory is that of the Keynesians. They argue that inflation arises from ‘full employment’ driving up wages and from ‘excessive demand’ when governments spend ‘too much’ in trying to revive the economy. If there is full employment, then supply cannot be increased and workers can drive up wages, forcing companies to raise prices in a wage-price spiral. So there is trade-off between the level of unemployment and prices. This trade-off can be characterised in a graphic curve, named after AW Phillips.
But the evidence of history runs against the Phillips curve as an explanation of the degree of inflation. In the 1970s, price inflation reached post-war highs, but economic growth slowed and unemployment rose. Most major economies experienced ‘stagflation’. And since the end of the Great Recession, unemployment rates in the major economies have dropped to post-war lows, but inflation has also slowed to lows.
Keynesian Larry Summers takes the ‘excessive demand’ approach. His view of inflation is that government spending is driving price hikes by giving Americans too much purchasing power. So it’s the Biden administration’s fault; the answer being to re-impose ‘austerity’ ie cutting government spending and raising taxes. Again, you could ask Summers why there was no high inflation when governments spent huge amounts to avoid a banking collapse in the Great Recession, but only now.
Following the Keynesian cost-push inflation theory inevitably comes the policy call for ‘wage restraint’ and even higher unemployment. For example, Keynesian guru, Paul Krugman now advocates raising unemployment to tame inflation in his New York Times column. So much for the claim that capitalism can sustain ‘full employment’ with judicious macro-management of the economy, Keynesian-style. It seems that the capitalist economy is caught between the Scylla of unemployment and the Charybdis of inflation after all.
As for wage restraint, both Keynesians and central bankers have been quick to launch into such calls. Keynesian FT columnist call for monetary policy to be “tight enough to … create/preserve some slack in the labour market.” In other words, the task must be to create unemployment to reduce the bargaining power of workers. Bank of England governor Bailey made the same call in order, he said, to stop runaway inflation. But there is no evidence that wage rises lead to higher inflation. We are back to the chicken and the egg. Rising inflation (chicken) forces workers to seek higher wages (egg). Indeed, over the last 20 years until the year of the COVID, US real weekly wages rose just 0.4% a year on average, less even that the average annual real GDP growth of around 2%+. It’s the share of GDP growth going to profits that rose (as Marx argued way back in 1865).
US inflation is much higher than wages which are only growing at between 3-4%, that means real wages are going down for most Americans. Financial assets are rising even faster. Housing prices are up by roughly 20% on an annualized basis. Just before the pandemic, in 2019, American non-financial corporations made about a trillion dollars a year in profit, give or take. This amount had remained constant since 2012. But in 2021, these same firms made about $1.73 trillion a year. That means that for every American man, woman and child in the US, corporate America used to make about $3,081, but today makes about $5,207. That’s an increase of $2,126 per person. It means that increased profits from corporate America comprise 44% of the inflationary increase in costs. Corporate profits alone are contributing to a 3% inflation rate on all goods and services in America.
Then there is the ‘psychological’ explanation of inflation. Inflation gets ‘out of control’ when ‘expectations’ of rising prices by consumers takes hold and inflation becomes self-fulfilling. But this theory removes any objective analysis of price formation. Why should ‘expectations’ rise or fall in the first place? And as I mentioned before, the evidence supporting the role of ‘expectations’ is weak. As a paper by Jeremy Rudd at the Federal Reserve concludes; “Economists and economic policymakers believe that households’ and firms’ expectations of future inflation are a key determinant of actual inflation. A review of the relevant theoretical and empirical literature suggests that this belief rests on extremely shaky foundations, and a case is made that adhering to it uncritically could easily lead to serious policy errors.”
All these mainstream theories deny that it is the failure of capitalist production to supply enough that is causing accelerating and high inflation. And yet, evidence for the ‘supply shock‘ story remains convincing. Take used car prices. They rocketed over the last year and were a major contributor to US and UK inflation rises. Used car prices rose because new car production and delivery was stymied by COVID and the loss of key components. Global auto production and sales slumped. But production is now recovering and used car prices have dropped back. Indeed, prices of home electronics are now falling.

A Marxist theory of inflation looks first to what is happening to supply and, in particular, whether there is sufficient value creation (exploitation of labour) to stimulate investment and production. Guglielmo Carchedi and I have been working on a Marxist inflation model, which we hope to publish soon. But the key points are that the rate of price inflation first depends on the growth rate of value creation. Employing human labour creates new value and using technology reduces the labour time involved in the production of goods and services. So more output can be produced in less labour time. Therefore prices over time will tend to fall, other things being equal. Capitalist production is based on a rise in investment in fixed assets and raw materials relative to investment in human labour, and this rising organic composition of capital, as Marx called it, will lead to a fall in general profitability and an eventual slowdown in production itself. This contradiction also means price deflation is the tendency in capitalist production, other things being equal.
But other things are not always equal. There is the role of money in inflation. When money was a (universal) physical commodity like gold, the value of commodities depended partly on the value of gold production. In modern ‘fiat’ economies, where money is a unit of account (without value) created by governments and central banks, money becomes a counteracting factor to the tendency for falling prices in value creating production. The combination of new value production and money supply creation will ultimately affect the inflation rate in the prices of commodities.
In our initial research, we showed that when money growth was moderate, but value creation was strong, inflation rates were high and rising (1963-81); but when value creation weakened, money creation avoided deflation but was not enough to stop price inflation from subsiding (1981-2019). This tells you that if the major economies slow down sharply or even enter a slump by the end of this year, inflation too will eventually subside – to be replaced by rising unemployment and falling real wages.
There is an alternative to monetary or wage restraint, these policy proposals of the mainstream, acting in the interests of bankers and corporations to preserve profitability. It is to boost investment and production through public investment. That would solve the supply shock. But sufficient public investment to do that would require significant control of the major sectors of the economy, particularly energy and agriculture; and coordinated action globally. That is currently a pipedream. Instead, ‘Western’ governments are looking to cut back investment in productive sectors and boost military spending to fight the war against Russia (and China next).
April 9, 2022
Climate change and wars
As the ugly war in Ukraine drags on, with more lives lost and atrocities (apparently) committed, energy and food prices hit yet more highs. The Food and Agricultural Organisation (FAO) of the UN publishes a monthly global price index. The FAO Food Price Index reached yet another record high of 159.3 points in March, up 12.6% from February.
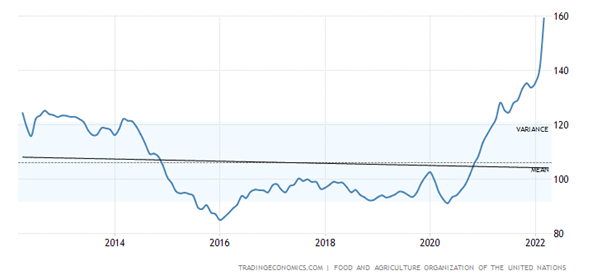 FAO Food price index
Oil and gas prices are also near all-time high levels. In Europe, gas prices hit a record €335 per megawatt hours, and at that level, it is now cheaper for some power stations to burn coal rather than gas even when the cost of carbon permits is taken into consideration. Europe wants to follow NATO’s bidding and cut back on Russian energy imports. The irony is that some countries, like Italy, say that will need to burn more coal, in order to burn less Russian gas. The International Energy Agency (IEA) posed the dilemma in relation to global warming and energy needs, given the Ukraine war and the sanctions against Russia. “The faster EU policy makers seek to move away from Russian gas supplies, the greater the potential implication, in terms of economic costs and near-term emissions,” the IEA said, in a report.
Can the circle be squared: ie getting more energy supply to reduce prices, while still trying to reduce fossil fuel production to lower greenhouse gas emissions? “We are determined to limit [Vladimir] Putin’s capacity to finance his atrocious war,” Ursula von der Leyen, president of the European Commission, wrote on Twitter. And then went on to say: “The EU must get rid of its dependency on fossil fuels”. At first sight, these two aims might be compatible. Cutting back on fossil fuel energy from Russia will reduce energy use and lower carbon emissions, no? After all, clean energy, says Christian Lindner, finance minister of Germany, should be considered the “energy of freedom”. So the German government plans to cut its dependence on Russian energy imports by accelerating renewables and reaching 100% ‘clean power’ by 2035. But in the same breath German Chancellor Olaf Scholz accepted that, in the short term, it has little choice but to continue buying gas and oil from Russia!
COP26 in Glasgow contained an agreement to draw down fossil fuel production, even though there was a fierce argument that broke out over whether coal should be “phased down” or “phased out”. COP26 president Alok Sharma. “Countries are turning their back on coal,” he said. “The end of coal is in sight.” And yet, even before the Russian invasion of Ukraine , far from declining, coal use globally surged to record levels this last winter, causing emissions to rise, while clean energy installations fell below the levels needed to reach climate targets. In the US, coal-fired power generation was higher in 2021 under President Joe Biden than it was in 2019 under then president Donald Trump, who had positioned himself as the would-be saviour of America’s coal industry. In Europe, coal power rose 18 per cent in 2021, its first increase in almost a decade. Economist Dieter Helm, professor of energy policy at Oxford university, says the shift away from fossil fuels has rarely looked more complicated. “The energy transition was already in trouble — 80 per cent of the world’s energy is still from fossil fuels,” he said. “I expect that in the short term, the US will increase oil and gas output and EU coal consumption could increase”.
This conflict of aims by ‘the West’ comes at a time when global warming and climate change are reaching a ‘now or never’ tipping point, where the Paris target to limit the global temperature increase to 1.5C cannot be met. In presenting the latest IPCC report on climate change (which supposedly outlines ‘solutions’ to mitigate global warming and meet targets), UN secretary-general Antonio Guterres commented: “The facts are undeniable. This abdication of leadership (by governments) is criminal.” By this he meant that the 198 countries which had gathered in Glasgow for the COP26 Climate Change Conference last November were failing to hit any of their (already inadequate) targets for emission reductions. So global temperatures look set to barrel past 1.5ºC degrees limit above 1850 industrial levels. Instead, the world faces a 2.7C temperature rise on current climate plans, the UN warned. Current pledges would reduce carbon emissions by only about 7.5% by 2030, far less than the 45% cut that scientists say is needed to limit global temperature rises to 1.5C.
And it’s not just reducing current emissions that is necessary, but also cutting back on the already accrued levels of carbon in the atmosphere. It’s a stock problem because many gases are long-lived. Nitrous oxide can stay in the atmosphere for 121 years, methane for 12 years. Carbon dioxide’s lifetime cannot be represented with a single value because the gas is not destroyed over time, but cycles through the ocean–atmosphere–land system. Some carbon dioxide will remain in the atmosphere for thousands of years and the melting of the glaciers could release into the atmosphere previously trapped carbon.
Hoesung Lee, chair of the IPCC, bluntly explained that: “human-induced climate change, including more frequent and intense extreme events, has caused widespread adverse impacts and related losses and damages to nature and people, beyond natural climate variability.” While “some development and adaptation efforts have reduced vulnerability,” he continued, “the rise in weather and climate extremes has led to some irreversible impacts as natural and human systems are pushed beyond their ability to adapt.” Co-chair of the IPCC working group, Hans-Otto Portner, spelt it out: “The scientific evidence is unequivocal: climate change is a threat to human well being and the health of the planet. Any further delay in concerted global action will miss a brief and rapidly closing window to secure a liveable future.”
Lee made it clear what he thought should be done immediately. “The time to stop the exploration of fossil fuels, which are destroying our planet, is now. Half measures are no longer an option,” But just stopping fossil fuel exploration is precisely that – a half measure. That’s because to meet the Paris agreement, the world would have to eliminate 53.5 billion metric tonnes of carbon dioxide each year for the next 30 years.
The problem is that it is ‘the West’: the mature capitalist economies, that have built up the stock of dangerous carbon and other gases in the atmosphere over the last 100 years which are doing the least to solve the climate crisis. About one-third of the current stock of greenhouse gases has been created by Europe and one-quarter by the US. Yes, China and India are the first- and third-largest emitters today. But measured in terms of emissions per head of population, they are around 40th and 140th, and measured in terms of their stock per capita, they are one-tenth of the level of Europe. And ironically, the main contributors to carbon emissions stock benefit from global warming as these mature capitalist (imperialist) economies are mainly in cold climates.
The countries of the ‘global North’ (Europe, the United States, Canada, Australia, New Zealand, Israel and Japan) are responsible for 92% of total emissions that are causing climate breakdown. Meanwhile, the Global South – the entire continents of Asia, Africa and Latin America – are responsible for only 8% of ‘excess emissions’. And the majority of these countries are still well within their fair shares of the emissions boundary, including India, Indonesia and Nigeria. To make matters worse, the impacts of climate breakdown fall disproportionately on the countries of the global South, which suffer the vast majority of climate change-induced damages and mortality within their borders.
 ŵLancet report
But a recent research paper in the journal Nature found that G20 countries spent$14tn on economic stimulus measures during 2020 and 2021 — but only 6 per cent of this was allocated to areas that would cut emissions. Investment bank Morgan Stanley reckons to achieve sufficient emissions reduction would cost about $50trn. About $20 trillion of cumulative investments will be required to switch out of fossil fuels. Solar, wind,and hydro will require $14 trillion of investment to deliver 80% of global power by 2050 and electric vehicle take-up will require $11 trillion to build the factories and infrastructure and develop battery technology. Biofuels, like ethanol, could be important for future global transportation alongside hydrogen and could eventually spread to aircraft, but to develop this would require a further $2.7trillion of investment. Carbon capture and storage could play a critical part in the energy transition but a further $2.5 trillion is needed for development. Compare the $50 trillion price tag to the barely $100 billion that it has taken six years for countries to scrounge together.
Yes, greenhouse gas emissions have been reduced in some countries and there are technical solutions available. Alternative renewable energy costs have come down 85% over the last ten years. But coal production must be cut by 76% by 2030. And oil/gas infrastructure projects must be stopped. The current flow of finance is dramatically insufficient to boost renewables and manage fossil fuel reduction. Funding for all this change is miniscule compared to the task.
And a switch to ‘clean energy’ won’t be enough, especially as mining and refining alternative fuels and systems also require more fossil fuel energy. All the batteries, solar panels and windmills in the world won’t lower fossil fuel demand in the near term. Internal combustion vehicles – commercial and passenger – use plenty of steel, but electric vehicles use a wider variety of more expensive metals. For example, the average internal combustion passenger vehicle uses less than 50 pounds of copper, whereas a Tesla uses about 180 pounds of copper wound up in its electric motors. Additionally, the batteries essential to electric vehicles rely on materials like lithium and nickel, which require intense electric and chemical outlays to process. All this means more fossil fuel production to mine more metals.
I have discussed before why market solutions like carbon pricing and carbon taxes will not deliver the required reductions in emissions. Market solutions will not work because it is just not profitable for capital to invest in climate change mitigation: “Private investment in productive capital and infrastructure faces high upfront costs and significant uncertainties that cannot always be priced. Investments for the transition to a low-carbon economy are additionally exposed to important political risks, illiquidity and uncertain returns, depending on policy approaches to mitigation as well as unpredictable technological advances.” (IMF). To save the planet and all species who live on it cannot be achieved through market pricing mechanisms or even more clever technology. Remember clever science gave us vaccines and medicines to save lives in the COVID pandemic, but it was capitalism and pro-capitalist governments that still allowed the pandemic to happen and were unable to stop around 20m ‘excess deaths’ globally.
To stop global warming, we don’t need just clever new technology, we need to phase out old fossil fuel technology. And we need a global plan to steer investments into things society does need, like renewable energy, organic farming, public transportation, public water systems, ecological remediation, public health, quality schools and other currently unmet needs. Such a plan could also equalize development the world over by shifting resources out of useless and harmful production in the North and into developing the South, building basic infrastructure, sanitation systems, public schools, health care. At the same time, a global plan could aim to provide equivalent jobs for workers displaced by the retrenchment or closure of unnecessary or harmful industries. But such a plan requires public ownership and control of fossil fuel companies and other key energy and food sectors. Without that, there can be no plan.
As the war in Ukraine rages on, we should be reminded that the biggest emitters of greenhouse gases are the military. The US military is world’s single largest consumer of oil, and as a result, one of the world’s top greenhouse gas emitters. The Pentagon’s greenhouse gas emissions annually total over 59 million metric tons of carbon dioxide equivalent. If it were a nation state, the US military would be the 47th largest emitter in the world., with emissions larger than Portugal, Sweden or Denmark.

And the US military is expanding all the time to protect US interests in oil and fossil fuel resources around the world. The Cost of Wars Project found the total emissions from war-related activity in Iraq, Afghanistan, Pakistan and Syria to be estimated at more than 400 million metric tonnes of carbon dioxide alone. Thus global warming and fossil fuel exploration, production and refining are inextricably linked by military spending. Wars and increased spending on arms are not just killing people and destroying lives and homes, but also adding to the climate disaster that is engulfing humanity globally. World peace would not only save lives and livelihoods, but also contribute to saving the planet and nature.
April 3, 2022
The submerging market debt crisis
Last week, Ghana’s central bank announced its biggest ever interest-rate hike as it sought to slow rampant inflation that threatens to create a debt crisis in one of West Africa’s largest economies. The Bank of Ghana raised its main lending rate by 250 basis points to 17% as consumer inflation reached 15.7% year-on-year in February, the highest since 2016. The war in Ukraine will likely make things worse. Ghana imports nearly a quarter of its wheat from Russia and around 60% of its iron ore from Ukraine.
Ghana is just one example of the economic stress being placed on small, low-income economies around the world from food and energy inflation, rising interest rates and a strong dollar. The island nation on the south east coast of India, Sri Lanka, has begun talks with the IMF for a ‘debt relief’ package after protests over a deepening economic crisis forced Gotabaya Rajapaksa’s government into a policy U-turn. Sri Lanka has for months faced mounting economic pain as its depleted foreign currency reserves triggered shortages of imports and fuel, power blackouts and double-digit inflation. It has debt and interest repayments worth about $7bn due this year against usable foreign currency reserves as low as $500mn.
Sri Lanka is Asia’s largest high-yield bond issuer, borrowing heavily in the years following the end of its 2009 civil war. It has never defaulted. But it looked set to do so before it turned to the IMF. About one-third of its debts are owed to international bondholders while other large creditors include countries such as China and India. It is expected to finalise a $1bn credit line with India. And even with IMF money, it will probably have to default and ‘restructure’ its debts with creditors.
In doing so, Sri Lanka will join countries such as Suriname, Belize, Zambia and Ecuador that have already defaulted on their debts during the pandemic. Pakistan too is on the brink of default, with its government under Imran Khan forced into calling elections.
Egypt has also asked for support from the IMF, as the country struggles to weather the economic impact of Russia’s invasion on Ukraine. Egypt is the Arab world’s most populous nation and has ‘benefited’ from previous IMF loans and programmes. In 2016 it secured a $12bn loan over three years after a crippling foreign currency crisis as it emerged from the political upheavals that followed its 2011 revolution. It also received $8bn in 2020 to deal with the impact of the pandemic, making it one of the biggest borrowers from the IMF after Argentina. At the time of the 2016 agreement, it devalued the currency, which lost half its value against the dollar. Foreign debt investors have also pulled billions of dollars from Egypt in recent months, adding to pressure on its currency.
I’ve raised this before, and both the IMF and the World Bank have warned, many countries are emerging from the COVID pandemic slump with a large debt overhang that could crippled their economies if they are forced by creditors, both private and public, to repay. And while many of these countries are small in GDP size, they are huge in population. The IMF’s debt database shows that the external debt stock of low- and middle income countries in 2020 rose, on average, 5.6 percent to $8.7 trillion. However, for many countries the increase was in double digits. The external debt stock of countries eligible for the Group of Twenty (G-20) Debt Service Suspension Initiative (DSSI) rose, on average, 12 percent to $860 billion and in some of them by 20 percent or more. And that debt initiative, which just suspends payments on debts for a few years, has now come to an end.
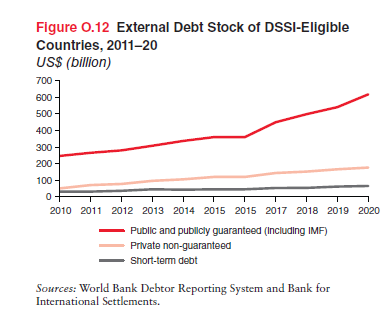
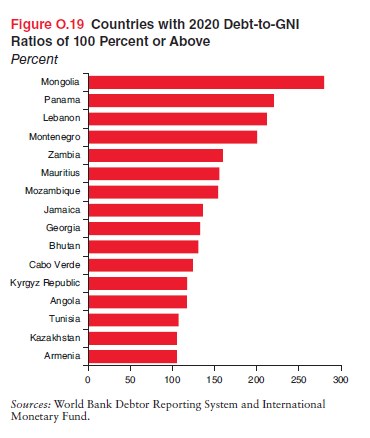
The combined debt service paid by DSSI-eligible countries in 2020 on external public and publicly guaranteed debt, including the IMF, totalled $45.2 billion, of which principal accounted for $31.1 billion and interest for $14.1 billion. The 2020 debt service comprised $26.4 billion (58 percent) paid to official bilateral and multilateral creditors and $18.8 billion (42 percent) to private creditors, that is, bondholders, commercial banks, and other private entities. Many small countries have external debt levels well above 100% of annual GDP.
Prior to the start of the Russian invasion of Ukraine, the impact of the pandemic on low-income countries’ public spending and revenues had produced an increase in their gross sovereign borrowing equivalent to about 25 per cent of their GDP.

Capital flows to the poorer countries of the world by the imperialist core has been falling since the end of the Great Recession, another indicator of the decline in globalisation. In 2011, $1.3trn went into the ‘Global South’ from the Global North. In 2020, that annual figure had fallen to $900bn, a 30% fall. And remember that over half of all financial flows to the Global South go to China. Excluding China, the fall in capital flows to the poorest countries is even greater. Over the past decade almost 60 percent of net aggregate financial flows to low- and middle-income countries from external creditors and investors went to China. Over this period China received inflows close to $4 trillion, of which 40 percent were debt-creating flows and 60 percent were foreign direct investment and portfolio equity flows. In 2020, aggregate financial flows to China rose 32 percent to $466 billion, driven by a 62 percent increase in net debt inflows to $233 billion and a 12 percent rise in net equity inflows also to $233 billion.
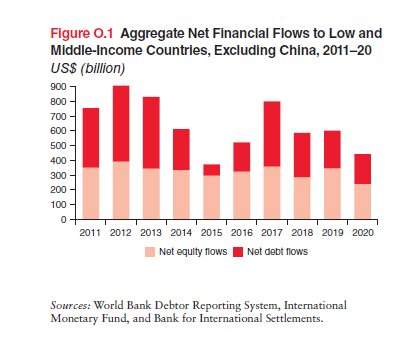
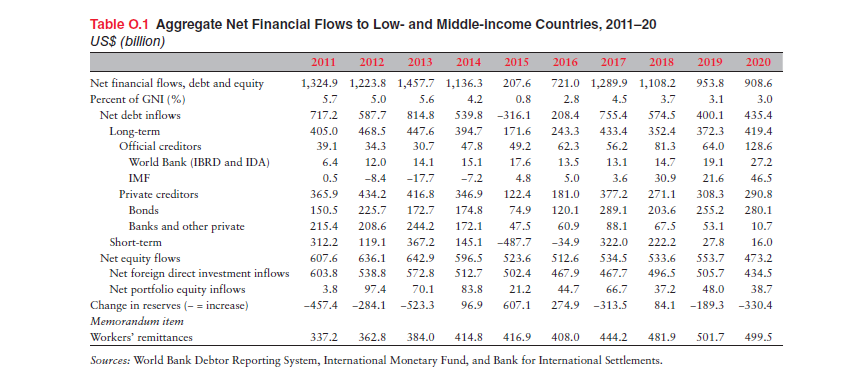
Private creditors (investment funds etc) have cut back on their investment in the government and corporate bonds of the poor countries and international banks have stopped lending. Much of the capital flows into these poor countries was not even for productive investment but merely to cover previous debts or for speculation by foreign investors in local financial markets. Foreign direct investment (FDI) has fallen from $600bn in 2011 (or about 40% of all capital flows) to $434bn in 2020. You might argue that financial investments by foreign multinationals and investment speculators is the last thing these countries need. But if foreign capitalists are reducing their investments, what is to replace it, either for productive investment in these poor economies or just to cover existing debt repayments? The answer is IMF-World Bank money with all sorts of conditions; and increased remittances by those who left their countries and got jobs and incomes working abroad. For all the data – see the table below.
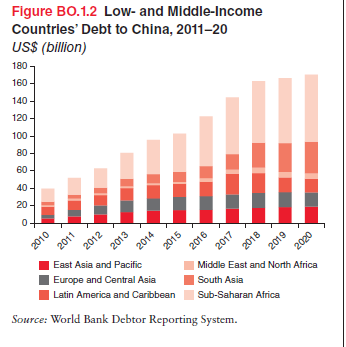
One controversial issue in capital flows to the Global South is the role of China. China has become an important creditor to many poor countries, starved of funds by the ‘West’ and desperate for credit to cover existing debts and to carry out infrastructure and productive projects. Low- and middle-income countries’ combined debt to China was $170 billion at end-2020, more than three times the comparable level in 2011. To put this figure in context, low- and middle-income countries’ combined obligations to the International Bank for Reconstruction and Development were $204 billion at end-2020 and to the International Development Association $177 billion. Most of the debt owed to China relates to large infrastructure projects and operations in the extractive industries. Countries in Sub-Saharan Africa, led by Angola, have seen one of the sharpest rises in debt to China although the pace of accumulation has slowed since 2018. The region accounted for 45 percent of end-2020 obligations to China. In South Asia, debt to China has risen, from $4.7 billion in 2011 to $36.3 billion in 2020, and China is now the largest bilateral creditor to the Maldives, Pakistan, and Sri Lanka.
Some argue that this shows China is just as ‘imperialist’ as the West and that China is putting poor countries into a permanent ‘debt trap’. But the evidence for this is weak. Most Chinese credits are on no worse terms than that offered by the IMF and other bilateral creditors, and in many cases are much better. China is supposed to use ‘debt diplomacy’ against the interests of debtor nations. But debt diplomacy is actually used by the West more, as the examples of Argentina and Ukraine show.
In sum, debts to foreign investors and financial institutions owed by the Global South have accelerated during the COVID pandemic and ‘debt relief’ has been no such thing. Now the Ukraine conflict is increasing the risk of defaults and economic recession for these countries as inflation spirals, interest rates rise and economic growth falls away.
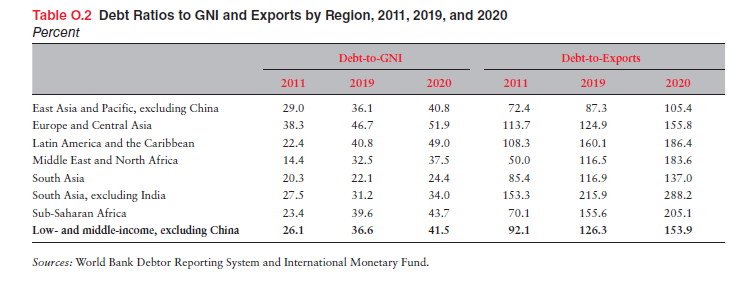
Net transfers of financial resources from developing to developed countries far exceed any compensation by net overseas development aid (ODA) flows to developing countries, which averaged less than $100bn a year In 2012, the last year of recorded data, developing countries received a total of $1.3tn, including all aid, investment, and income from abroad. But that same year some $3.3tn flowed out of them. In other words, developing countries sent $2tn more to the rest of the world than they received. If we look at all years since 1980, these net outflows add up to an eye-popping total of $16.3tn.
What’s the answer? Well, the obvious global one is to cancel the debts owed by all these poor countries. Based on the amount their governments are spending on debt payments which leave the country, the Jubilee Debt Campaign estimates that people in 54 countries are currently living in debt crisis, up from 31 in 2018 and 22 in 2015. As well as the 54 countries in debt crisis, Jubilee Debt Campaign estimates that 14 countries are at risk of a public or private debt crisis, 22 at risk of just a private sector debt crisis, and 21 just a public sector debt crisis.
Then there are national solutions. First, governments need to put in place capital controls to stop the reckless flow of speculative capital that destroys national currencies and provokes financial crises. Capital controls are also needed to stamp out illicit and criminal capital flows. US-based Global Financial Integrity (GFI) calculates that developing countries have lost a total of $13.4tn through unrecorded capital flight since 1980.
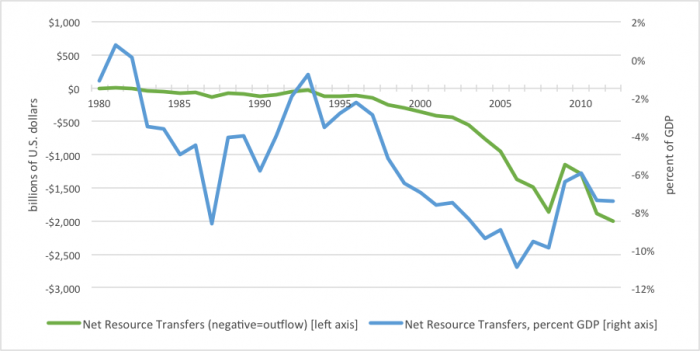 GFI
GFIEven the IMF has admitted that capital controls should be a weapon available to a national government to protect its financial assets and household savings from asset stripping and rich individual and corporation capital flight. The IMF now says that countries should have “more flexibility to introduce measures that fall within the intersection of two categories of tools: capital flow management measures (CFMs) and macroprudential measures (MPMs)”. And controls could be “applied pre-emptively, even when there is no surge in capital inflows, to the policy toolkit.”
Ultimately, the only way poor countries can reduce their exploitation by multi-nationals and international finance is through state control of their banking and strategic sectors of their economies. That, of course, is anathema to international capital.
March 30, 2022
The end of dollar dominance?
Last summer when the US fled Afghanistan, I wrote a post on the history of US dollar dominance I argued then that the US dollar would remain the dominant world currency for the foreseeable future, but that it was in relative decline compared to other currencies, precisely because US imperialism has been in relative decline compared to other rival economies since the mid-1970s.
The Russian invasion of Ukraine has brought this discussion to the fore again among mainstream economists and strategists of global capital. The talk is that US dollar dominance will wane and that the world economy is set to divide into two blocs: west and east – with the west being the US, Europe and Japan; and the east being the ‘autocratic’ regimes of Russia and China, along with India. But is this the likely reconfiguration of currencies and capital flows?
In my previous post, I dealt in detail with the historic decline in the dominance of the US dollar in trade, capital flows and as a reserve currency. I won’t go over that again. Instead, in this post, I will try and look at the future and the consequences of new developments in the competitive struggles between the imperialist powers, the ‘emergent’ economies resisting ‘western’ dominance; and the wider world of peripheral and poor countries.
International competitors to US imperialism, such as Russia and China, have routinely called for a new international financial order and have worked to displace the dollar at the apex of the current global currency regime. The addition of the renminbi in 2016 to the basket of currencies that composes the IMF’s special drawing rights represented an important global acknowledgment of the increasing international use of the Chinese currency. And the aftermath of the Ukraine conflict will clearly accelerate that drive by Russia and China as they face severe and long-standing sanctions in trade and money markets that will reduce their access to the dollar and the euro.
But there is still no real alternative in international markets to the US dollar. First, there can be no return to gold as the international money commodity; and the role of international money as created by the IMF in Special Drawing Rights (SDRs) is minimal; while it’s a volatile future with other potential monetary assets like cryptocurrencies.
And the US dollar (and to a lesser extent the euro) remains dominant in international payments.
However, a recent IMF working paper does reveal an important trend. The US dollar is not being gradually replaced by the euro, or the yen, or even the Chinese renminbi, but by a batch of minor currencies. According to the IMF, the share of reserves held in U.S. dollars by central banks has dropped by 12 percentage points since the turn of the century, from 71 percent in 1999 to 59 percent in 2021. But this fall has been matched by a rise in the share of what the IMF calls ‘non-traditional reserve currencies’, defined as currencies other than the ‘big four’ of the US dollar, euro, Japanese yen and British pound sterling, namely such as the Australian dollar, Canadian dollar, Chinese renminbi, Korean won, Singapore dollar, and Swedish krona.
The IMF found that this shift to ‘non-traditional currencies was broad based: “we identify 46 active diversifiers that have shifted their portfolios in this direction, such that they now hold at least 5 percent of their reserves in non-traditional currencies.” Countries that build up what the IMF calls ‘excess’ FX reserves, ie over and above that necessary to deal with any trade or currency crisis, are increasingly diverting that excess away from the ‘big four’ currencies of dollars, euros, sterling and yen and into other smaller currencies. The IMF reckons that excess FX reserves now add up to $1.5trn (including China), or 25-30% of total reserves in the non-imperialist economies.
Then there are the countries that do not have ‘excess’ reserves but on the contrary, have scarce dollar FX reserves. Some of these have also resorted to alternative currency assets like cryptocurrencies (El Salvador and Nigeria). For example, a year ago, El Salvador adopted bitcoin as legal tender and has now announced the issuance of a government bond to be paid in bitcoin. These so-called ‘volcano’ bonds (El Salvador is volcanic), are designed to raise funds for the government and investors by eventually selling the bonds for dollars in five years. Of course, all depends on the dollar value of bitcoin rising by then. But look at the volatility in bitcoin’s dollar rate in the last year.
All this suggests is that the shift in international currency strength after the Ukraine war will not into some West-East bloc, as most argue, but instead towards a fragmentation of currency reserves; to quote the IMF: “if dollar dominance comes to an end (a scenario, not a prediction), then the greenback could be felled not by the dollar’s main rivals but by a broad group of alternative currencies”. That may have even worse consequences for world peace and for the smooth expansion of the world capitalist economy than a major split between west and east. Indeed, it implies almost an anarchic currency situation where the imperialist economies, particularly the US, could lose control over world currency markets.
It also implies that Keynesian hopes for a new coordinated world order in global money, trade and finance is ruled out. Kevin Gallagher and Richard Kozil-Wright, leftist economists in UNCTAD (United Nations Conference for Trade and Development), in a new book, The Case for a New Bretton Woods, argue that in the aftermath of COVID, governments have the opportunity to implement sweeping reforms to “(boldly) rewrite the rules to promote a prosperous, just, and sustainable post-Covid world economic order – a Bretton Woods moment for the 21st century,” or “we risk being engulfed by climate chaos and political dysfunction.”
The authors hark back to the Keynesian-inspired Bretton Woods agreement that set international rules for harmonious trade and capital flows that countries would follow. Bretton Woods was apparently a great success in the first two post-1945 decades of prosperity and growth. The authors reckon that big finance capital was not involved in the agreement, which instead was an international follow-up to the very successful New Deal programme for employment and growth instituted by US President Roosevelt to end the Great Depression of the 1930s – “Washington’s attempt to internationalise the New Deal”. Gallagher and Kozul-Wright note: “The New Deal programme not only abandoned the gold standard, but also broke with the wider liberal international agenda by taking on the financial elite both at home and abroad and opened the door to an alternative narrative in support of an activist public policy agenda.” The authors claim that this is the model that we must return to bring about harmonious and even expansion of the world economy from hereon. “It provides a blueprint for change that no one interested in the future of our planet can afford to miss.”
Unfortunately, this ‘blueprint’ is not going to happen in the 21st century – on the contrary. The Bretton Woods agreement was only possible because, in 1944, the US ruled the world and could dictate the terms for international trade, payments and currency controls. And the first two decades after 1944 were a period of high profitability of capital in the major economies that allowed all participants to gain (if unevenly) from the spoils of cheap labour globally (at the expense of the so-called Third World, which had no say in Bretton Woods) and from the introduction of new technologies developed during the war.
But as Marxist theory has proven, this ‘golden age’ could not last once the profitability of capital started to fall and when US dominance in trade and capital flows began to wane. The end of Bretton Woods was a product of changing conditions for global capital. it was not because of a change of economic ideology from Keynesian international macro management to ‘neoliberal’ free markets in currencies and trade. It was the change in economic conditions that forced a change in the ideology of economics and politicians to ‘free markets’, floating currencies and deregulation of trade and capital flows (globalisation).
A revival of a new ‘Bretton Woods’ is not possible in the 21st century. There is increasingly no dominant economic power that can dictate terms to others; and this is no ‘golden age’ of high profitability that all the major economies can share in. On the contrary, the profitability of capital in the major economies is near 50-year lows and the dominance of the big four currencies in world capitalist markets is fragmenting into a myriad of small currency regimes (as the IMF suggests).
Don’t’ get me wrong, the dollar still sits in the driving seat in world markets. Indeed, in global slumps and in geopolitical crises, the dollar becomes the strongest among fiat currencies, alongside gold as the world’s commodity currency. And that’s especially the case when interest rates look set to rise more in the US than in other major economies.
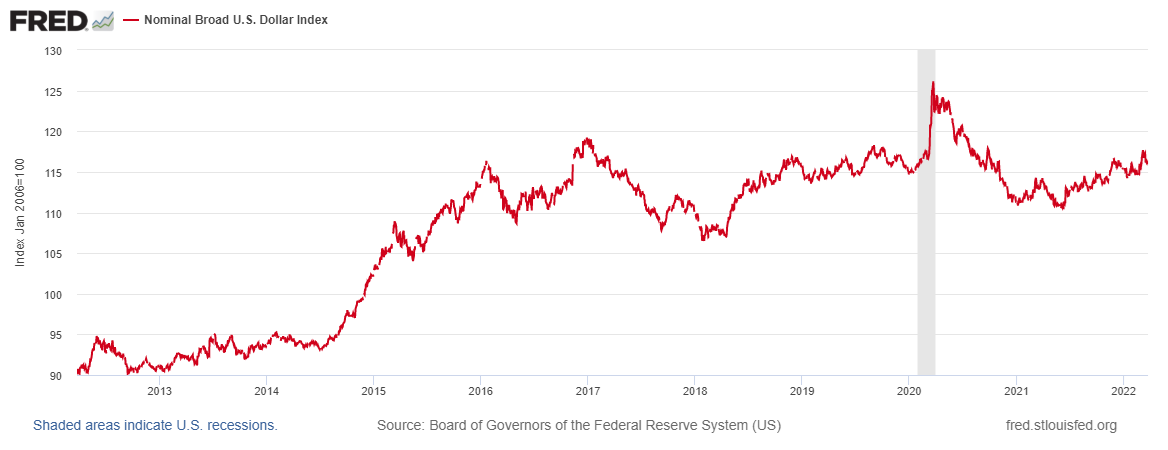
The difference now is that rising interest rates and a strong dollar do not herald a more harmonious world capitalist economy, but instead disaster for the weaker and poorest countries globally. A recent study by the World Trade Organisation, based on measuring the dynamic impact of lost trade and technology diffusion, found that “a potential decoupling of the global trading system into two blocs – a US-centric and a China-centric bloc – would reduce global welfare in 2040 compared to a baseline by about 5%. Losses would be largest (more than 10%) in low-income regions that benefit most from positive technology spillovers from trade”. I suspect the damage to the poorest economies would be even greater in more fragmented currency world. This is something I shall take up in my next post.
March 26, 2022
The war on inflation
The Russian invasion of Ukraine grinds agonisingly on with more dying and displaced and with further destruction of Ukrainian cities, farms and homes. Back in the major economies, there is another war brewing: the war on inflation.
Inflation of consumer prices are now at 30-40 year highs with more to come. The COVID pandemic slump and now the Ukraine conflict has driven energy and food prices up to record highs. The war in Ukraine has gone global. Spiking commodity prices are on track to see their sharpest rises since 1970, sending a shock wave of suffering across the world as the prices of essential goods every human needs to survive are surging upwards. Wheat prices are up 60% since February. Food prices are now higher than during the global food crisis of 2008, which pushed 155 million people into extreme poverty.
And the price inflation in these key areas has migrated into general price increase. Annual consumer price inflation (CPI) now stands at 7.9% in the US, 5.9% in the Eurozone; 6.2% in the UK and even Japan, long a deflating economy, now has an inflation rate of 1%. In the so-called emerging economies, inflation is even worse: India 6.1%; Russia 9.2%; Brazil 10.5%;, Argentina 52%; Turkey 54%.
 Federal Reserve Powell Speech
The battle is now to reduce and control inflation and it is being led by the central banks of the major economies: the Federal Reserve, the European Central Bank, the Bank of England and the Bank of Japan. It is the primary job of central banks to control price inflation; not to help to sustain employment and economic growth – they are secondary. (“The ultimate responsibility for price stability rests with the Federal Reserve” – Jay Powell). That’s because inflation is the main enemy of the banking system. Creditors and lenders of money lose out if inflation rises, while debtors and borrowers gain. And central banks were created to support the financial sector and its profitability and not much else.
And indeed, there is not much else they can do. I have shown in many previous posts the evidence that central banks have little control over the ‘real economy’ in capitalist economies and that includes any inflation of prices in goods or services. For the 30 years of general price disinflation (where price rises slow or even deflate), central banks have struggled to meet their usual 2% annual inflation target with their usual weapons of interest rates and monetary injections. And it will be the same story in trying this time to reduce inflation rates.
All the central banks were caught napping as inflation rates soared. And why was this? In general, because the capitalist mode of production does not move in a steady, harmonious and planned way but instead in a jerky, uneven and anarchic manner, of booms and slumps. But specifically now, because as Fed Chair Jerome Powell put it in a keynote speech to the National Association of Business Economists last week, “Why have forecasts been so far off? In my view, an important part of the explanation is that forecasters widely underestimated the severity and persistence of supply-side frictions, which, when combined with strong demand, especially for durable goods, produced surprisingly high inflation.” Indeed, I have argued in previous posts that, contrary to the view of the Keynesians, the current inflation burst is not due to ‘excessive demand’ or ‘excessive wage increases’ (cost push), but due to the failure of supply/production.
As Powell put it: “contrary to expectations, COVID has not gone away with the arrival of vaccines. In fact, we are now headed once again into more COVID-related supply disruptions from China. It continues to seem likely that hoped-for supply-side healing will come over time as the world ultimately settles into some new normal, but the timing and scope of that relief are highly uncertain.” And this poses an intractable problem for the central bankers in their quest to protect bank profits. Their monetary weapons will prove useless in this war on inflation. Powell said that “We have the necessary tools, and we will use them to restore price stability.” But does he? As Andrew Bailey, governor of the Bank of England, said: “Monetary policy will not increase the supply of semiconductor chips, it will not increase the amount of wind (no, really), and nor will it produce more HGV drivers.” And Jean Boivin, a former Bank of Canada deputy governor now at the BlackRock Investment Institute, commented: “We are not dealing with demand-push inflation. What we are really going through right now is a massive supply shock and the way to deal with this is not as straightforward as just dealing with inflation.”
If rising inflation is being driven by a weak supply-side rather than an excessively strong demand side, monetary policy won’t work. Monetary policy supposedly works by trying to raise or lower ‘aggregate demand’, to use the Keynesian category. If spending is growing too fast for production to meet it and so generating inflation, higher interest rates supposedly dampen the willingness of companies and households to consume or invest by increasing the cost of borrowing. But even if this theory were correct (and the evidence does not support it much), it does not apply when prices are rising because supply chains have broken, energy prices are increasing or there are labour shortages.
Nevertheless, central banks have only the monetary weapon to apply to accelerating inflation. So the Fed plans a sharp rise in its ‘policy rate’ of interest (the Fed Funds rate), which sets the floor for all borrowing in capitalist markets. And so do other central banks.
 Powell Speech
Powell aims to hike the Federal funds rate to 1.9 percent by the end of this year and thus rising above its estimated longer-run normal value by 2023.
 Powell Speech
At the same time, the Fed is ‘pivoting’ on its previous programme of ‘quantitative easing’ (QE) ie buying government and government-backed bonds through an increase in money supply. During the 21st century, the Fed has bought so much government paper that its balance sheet has jumped from $1 trillion to nearly $9 trillion, more than doubling during the COVID pandemic.
 FRED St Louis series
Now the Fed is going to reduce the total amount of the balance sheet. Powell claims that “these policy actions and those to come will help bring inflation down near 2 percent over the next 3 years.” Indeed, there is optimism in mainstream economics that increased interest rates and a reverse of monetary injections by the Fed and other central banks will not only kill inflation but also avoid a slump in investment and consumption as a result, as long the Fed gets on with the war on inflation and ends its policy of appeasement. Powell commented that “the historical record provides some grounds for optimism: Soft, or at least soft-ish, landings have been relatively common in U.S. monetary history.5 In three episodes—in 1965, 1984, and 1994—the Fed raised the federal funds rate significantly in response to perceived overheating without precipitating a recession.”
 Powell speech
Powell also made much of the current mainstream explanation of inflation: that it is mainly caused by ‘expectations’ of price rises gaining traction among consumers and businesses – self-fulfilling if you like. “In the recent period, short-term inflation expectations have, of course, risen with inflation, but longer-run expectations remain well anchored in their historical ranges.”
 Powell Speech
This ‘psychological’ explanation of inflation removes any objective analysis of price formation. Why should ‘expectations’ rise or fall in the first place? And as I mentioned before, the evidence supporting the role of ‘expectations’ is weak. As a new paper by Jeremy Rudd at the Federal Reserve concludes; “Economists and economic policymakers believe that households’ and firms’ expectations of future inflation are a key determinant of actual inflation. A review of the relevant theoretical and empirical literature suggests that this belief rests on extremely shaky foundations, and a case is made that adhering to it uncritically could easily lead to serious policy errors.”
Powell significantly left out of his ‘soft recessions’ the two deepest and widest slumps in the major capitalist economies since 1945, namely 1980-82 and the Great Recession of 2008-9, when interest rates rose sharply prior to the start of recession. In doing so, he cannot offer an explanation of why tighter monetary policy can have ‘soft’ landings sometimes and slumps other times.
What is missing from any explanation are two things that Marxist theory offers. First, what is happening to the profitability of capital; and second, what is happening to the real rate of interest (after taking into account the inflation rate). In periods where average profitability is high and/or rising, then interest rates can and will rise too but without crushing investment (both productive and unproductive (real estate and finance). That was the case in all the ‘soft’ landing cases cited by Powell.
It was also the case in another optimistic argument for the likely success of monetary policy in controlling inflation. One analyst claims that 1946-48 period is the best historical parallel to now. There were serious supply shortages then leading to sharp rises in price inflation. But eventually price increases slowed as supply came on board as manufacturing switched from military to civil production. The Fed did not have to hike interest rates but just applied a relatively mild reduction in credit growth to shrink its balance sheet. In other words, the market’s “invisible hand” worked. But this explanation again fails to note that average profitability of capital in this period was at 20th century highs, with labour cheap and unused technology to be applied. No wonder supply came on board quickly to douse the flames of inflation.
But that was not the situation in 1980, after the huge profitability crisis that began from the mid-1960s and was exacerbated by the international slump of 1974-5. And it was not that case in 2008-9, where the profitability of productive capital was not much higher than in the early 1980s and much lower than in the 1946-64 ‘golden age’ of capitalist production or even the ‘neo-liberal’ recovery period of the 1980s and 1990s.
 Basu-Wasner database and EWPT 7.0 series
Then there is the second factor, the real rate of interest. Paul Volcker became head of the Federal Reserve in 1979 when inflation rates, triggered by high oil prices and tight labour markets capping supply adjustment (unlike 1948), had reached 20th century highs. Volcker, a convinced ‘monetarist’ and strong advocate of the interests of bankers, immediately hiked interest rates to such levels that real Fed fund interest rate jumped from -3% to +5%. You can see that jump in the graph below, where the red line in the US CPI inflation rate, the black line is the Fed Funds nominal rate and the real rate is the blue line.
 Fred St Louis
This shock hit to borrowing costs in real terms coupled with the very low profitability of capital caused the deepest post-war slump for the major capitalist economies, in two bouts over three years. It was the end of manufacturing jobs in the US, Western Europe and the UK. Productive capital moved to Eastern Europe, Latin America and Asia. Indeed, it was this slump that killed inflation and brought down oil prices, not rising interest rates.
What is the current situation for the real rate of interest? It is even lower than when Volcker took over in 1979. Two things flow from that: to do a ‘Volcker’ and take the Fed real rate into positive territory in order to curb inflation would require a series of Fed hikes not matched in 100 years; and if that were to be applied, given the near post-war low in profitability, it would almost certainly deliver a new slump in investment and production in the major economies – let alone its impact on the so-called emerging economies of the Global South.. All this tells you that monetary policy is a crude weapon to control inflation and is not going to succeed without causing a major slump – no ‘soft’ landing.
One useful indicator of a recession in the past, which I have mentioned before, is an inverted yield curve. That’s when, in the bond market, the rate of interest or yield on a short-term loan (3m or 2yr) rises above the rate of interest or yield on a longer-term loan or bond (10yr). Normally, if you borrow (issue a bond) for a longer period you must pay a higher rate of interest to the lender or purchaser of the bond because the length of time for the credit is longer and so the loan is subject to more inflation or default risk. But when the ‘yield curve’ flattens or even inverts, a recession usually follows. Why? Because it tells you that purchasers of bonds are getting worried that interest rate hikes will cause a possible slump and so are buying more safe long-term government bonds to protect their cash.
Well, currently the US government bond yield curve is fast heading towards inversion. Jay Powell’s hawkish speech declaring war on inflation led to a sharp drop in the curve. The blue line in the graph below, the 10-year/2-year curve, is barrelling straight towards zero. In the past 40 years, every time that has happened, a recession has followed (as the shaded bits of the chart show). In fact, it’s worse than that: inverted 10/2 curves have preceded the last eight recessions and 10 out of the last 13 recessions, according to Bank of America.
Powell tried to dismiss the yield curve indicator in his speech to the NAB, arguing that only the short end of the curve was an indicator of recession and that is when it is falling, not rising: “there is good research by staff in the Federal Reserve system that really says to look at the short — the first 18 months — of the yield curve. That’s really what has 100 per cent of the explanatory power of the yield curve. It makes sense. Because if it’s inverted, that means the Fed’s going to cut, which means the economy is weak.”
Whatever the predictive value of the bond yield curve, the point is that the US economy, the best performer among the G7, is set to slow as the year progresses. There is little room for any further growth through employing more workers, while productivity and business investment is slowing. Year-on-year nonfarm business sector labour productivity advanced only 1% at the end of 2021, down compared with 2.4% in 2020. And business investment was only just 2.4% above pre-pandemic levels at end-2021. Several forecasts now suggest a significant slowdown in economic growth in the US and the UK, and probably an outright recession in the Eurozone before the year is out.
And it is not just the productive sectors of the economy that are at risk. It was the collapse in the housing sector in 2008 that triggered the Great Recession. And after a massive real estate spree during the COVID pandemic, if mortgage rates rise sharply, house prices could turn down, weakening consumer spending. US bond investor Bill Gross commented “I suspect you can’t get above 2.5 to 3 per cent before you crack the economy again. We’ve just gotten used to lower and lower rates and anything much higher will break the housing market.” Mortgage debt as a share of real GDP has already risen 6 percentage points to 55 per cent since the last rate-hiking cycle peaked in late 2015.
Instead of a ‘soft landing’ as Jay Powell hopes for, Goldman Sachs analyst Philipp Hilderbrand reckons: “Stagflation risk is a real concern today… We are looking at a supply shock layered on top of a supply shock. And the nature of the new supply shock-centred on energy—suggests not only that inflation will move even higher and likely prove more persistent moving forward, but also that growth will take a hit.”
There is an alternative to monetary policy. It is to boost investment and production through public investment. That would solve the supply shock. But sufficient public investment to do that would require significant control of the major sectors of the economy, particularly energy and agriculture; and coordinated action globally. That is currently a pipedream. Instead, governments are looking to cut back investment in productive sectors and boost military spending to fight the war against Russia (and China next).
Which way will it go? Will Powell, Lagarde and Bailey be mini-Volckers or will they step back from the conflict and opt for fewer rate hikes and be forced to live with higher inflation? Either way, it suggests that inflation globally will not subside until a new slump emerges, signalling that the central bank war on inflation has been lost.
Michael Roberts's Blog

- Michael Roberts's profile
- 35 followers

