
Michael Roberts's Blog, page 31
March 20, 2022
Ukraine-Russia: like an earthquake
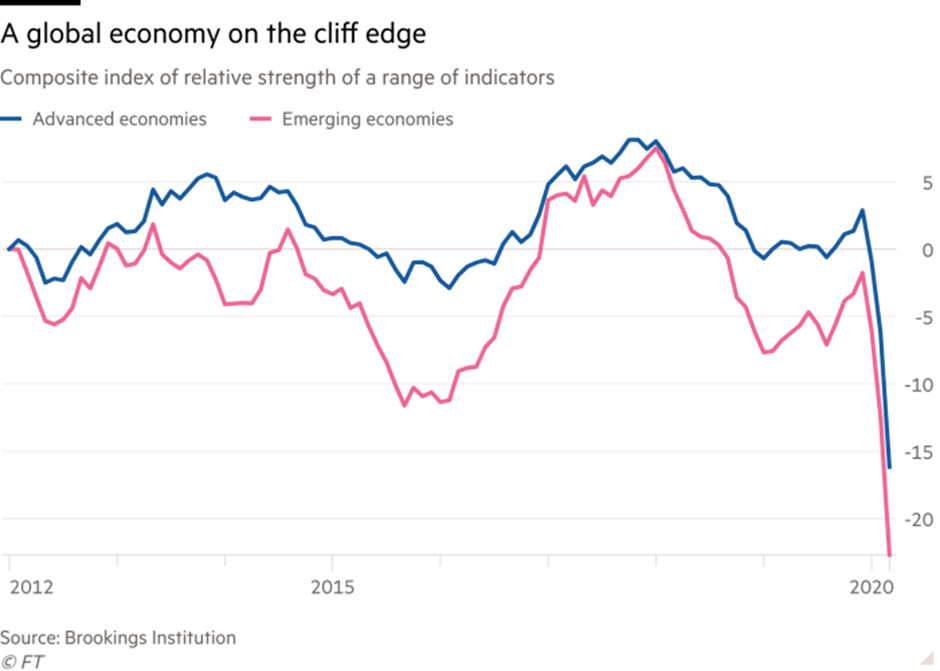
“The war in Ukraine is like a powerful earthquake that will have ripple effects throughout the global economy, especially in poor countries”. That’s how IMF chief Kristalina Georgieva described the impact of the war on the world economy. Nobody can be sure of the magnitude of this quake but even on the most optimistic view, it is going to damage significantly the economies and livelihoods of not just the people of Ukraine and Russia, but also the rest of the 7bn people globally. And it is happening just as the world economy was supposedly recovering from the plunge in output, incomes and living standards suffered from the COVID pandemic slump in 2020 – which was the widest and deepest global contraction (if relatively short) in over 100 years.
But let us start with Ukraine itself. Already 3m people have fled the country from the bombs and destruction of their homes and another 6m have been displaced within the country. As with all wars, people’s lives and livelihoods have been lost. Economically, an IMF staff report, completed on March 7, concluded that the country was paralysed. “With millions of Ukrainians fleeing their homes and many cities under bombardment, ordinary economic activity must, to a large extent, be suspended.” Then there is the physical damage. A week ago, the Ukrainian president’s economic adviser put the damage at $100bn already. Half of the country’s exports rely on the port of Mariupol, which is now suffering the most savage siege.
The IMF’s tentative projection is for output to fall 10 per cent in 2022 — if the war does not last long. And that is beginning to look optimistic, as the IMF comments, “Downside risks are exceedingly high.” This 10% compares with a decline of output of 6.6 percent in 2014, which was followed by a decline of just under 10 percent in 2015, during the earlier Russia-Ukraine conflict in Eastern Ukraine. However, the IMF warned that “data on wartime real GDP contraction (Iraq, Lebanon, Syria, Yemen) suggests that annual output contraction could eventually be much higher, in the range of 25-35%.”
Then there is Russia. Putin’s invasion has provoked an unprecedented response in the form of economic and other sanctions against Putin’s friends and supporters and against its banks and institutions, even leading to the seizing of the country’s foreign exchange reserves – and increasing attempts to block or boycott Russian exports (including oil and gas). Preventing the Russian central bank from deploying its international reserves and making it impossible for it to liquidate its assets, is part of an economic war designed to undermine Russia’s economy and war effort. The French finance minister said that “[w]e are waging total economic and financial war against Russia, Putin, and his government”
The Russian economy is not large compared to the G7 economies. In total, the economic forces against Russia amount to an annual GDP of $50trn compared to the puny $4trn from Russia and Belarus.
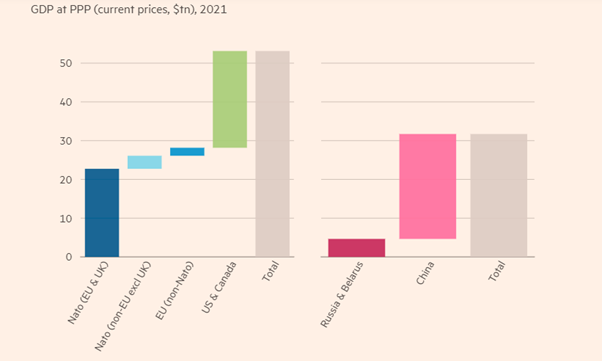
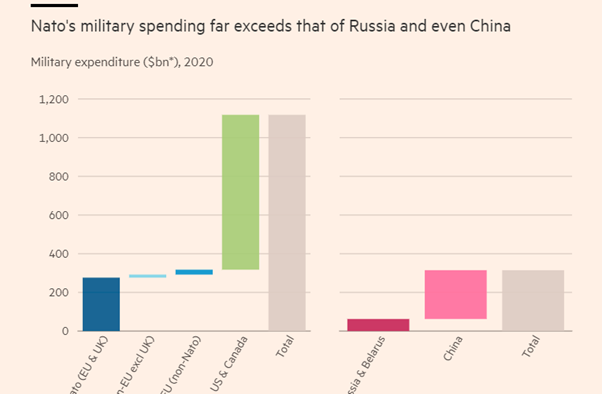
And when it comes to military firepower, Russia is heavily outspent by the NATO countries.
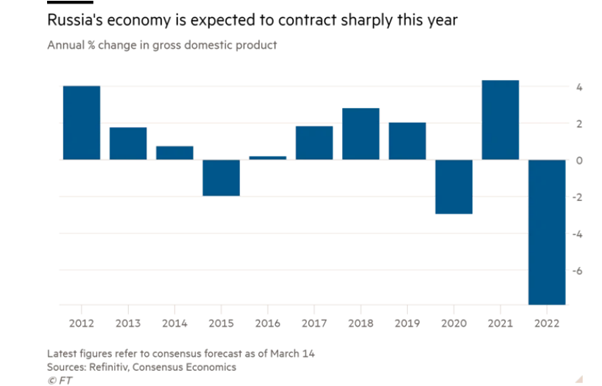
So a combination of economic disruption, NATO country sanctions and spiralling inflation is going to drive the Russian economy over a cliff. Forecasts of the output contraction vary. The consensus puts it at about an 8% fall this year.
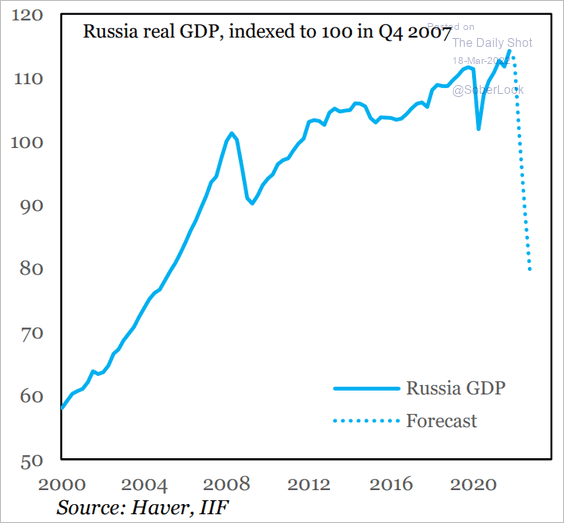
But the International Institute of Finance (IIF), which looks closely at Russian export and import flows, as well as capital flows, is much more pessimistic and expects a 15% fall – something not experienced in Russia since the collapse of the Soviet Union in the 1990s , taking the Russian economy back to levels of more than 20 years ago.
The use of economic sanctions against a G20 country like Russia is unprecedented. It shows the role that ‘sanctions’ can play as an alternative to military action against governments which do not follow the wishes and dictates of imperialism in the 21st century.
Topically, economic historian Nicholas Mulder had just published a book entitled, The Economic Weapon: the rise of sanctions as a tool of modern war. Mulder points out that economic sanctions started to be used by imperialist powers when the League of Nations was set up after the First World War. The leading powers in the League “believed they had equipped the organization with a new and powerful kind of coercive instrument for the modern world.” The then US president Woodrow Wilson described economic sanctions as “something more tremendous than war” that could bring “a nation to its senses just as suffocation removes from the individual all inclinations to fight.” There would be no need for force. “It is a terrible remedy. It does not cost a life outside of the nation boycotted, but it brings a pressure upon that nation which, in my judgment, no modern nation could resist.” In that sense, sanctions remind me of medieval sieges, where cities were starved into submission, without military action. Economic sanctions were a new 20th century weapon along with chemical weapons and nuclear bombs.
Mulder argues that economic sanctions were used first by European imperialists against peoples who lived outside the ‘civilized world’. Then the US rise to global power in the 20th century saw both negative sanctions (oil embargoes) and positive sanctions (Lend-Lease). “America’s sanctionism has been shaped by three factors: its unique military dominance, the ideological inflection of Cold War politics, and the role of US financial markets in the world economy.”
John Maynard Keynes saw ‘positive’ sanctions as beneficial, ie through aid and subsidy to the good guys, while applying bans, blockades and punishments to the bad guys. And he reckoned the financial system sanction was the most powerful – and that is now being put into practice against Russia. Of course, the larger and more powerful a country, and the weaker and less firmly it is applied by an alliance of countries, the less its impact will be.
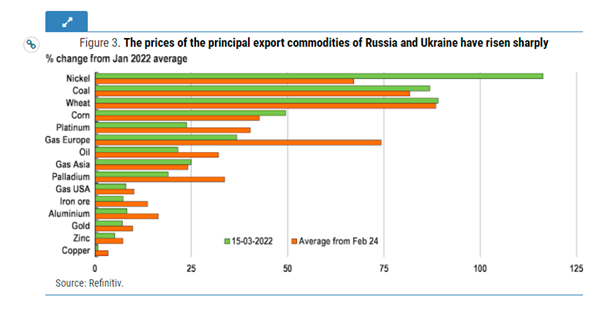
But what about the global impact of the conflict? Although Russia and Ukraine are relatively small in output terms, they are large producers and exporters of key food items, minerals and energy. Ukraine and Russia together account for more than a quarter of the global trade in wheat and a fifth of corn sales. The longer Russian forces remain in Ukraine, the longer tractors and combines to harvest the nation’s crops stay idle, it threatens food security far beyond the region, the IMF has warned.

For example, Egypt imports 80 per cent of its wheat from Russia and Ukraine. With many countries in Africa and the Middle East being similarly exposed, Europe could soon have another migration crisis on its hands, on top of millions of Ukrainian refugees. Then there is Ukraine’s role in supplying many of the rare gases needed in industrial processes — such as neon, krypton and xenon — including already beleaguered semiconductor production.
Energy is the main spillover channel for Europe as Russia is a critical source of natural gas imports.
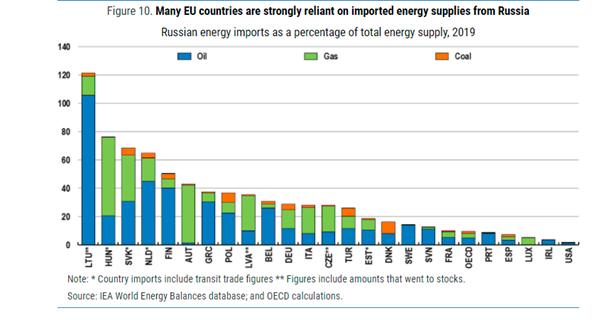
This is going to hit output across Europe.
The IMF reckoned that “the prolongation of Russia’s aggression towards Ukraine, in addition to the humanitarian and economic losses, will also lead to significant spillover effects throughout the world: deterioration of food security, surging of energy and commodity process, rising inflationary pressures, disruption of supply chains, increasing social spending for refugees, and increasing poverty. The global economic damage of this war will be devastating.”
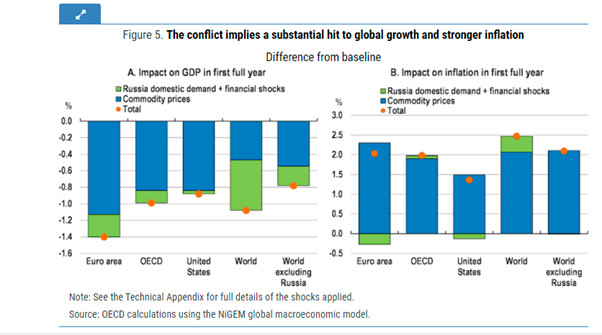
In its report, the OECD also presented a dismal picture if the war continues for much longer: “global growth could be reduced by over 1 percentage point, and global inflation raised by close to 2½ percentage points in the first full year after the start of the conflict. These estimates are based on the assumption that the commodity and financial market shocks seen in the first two weeks of the conflict persist for at least one year, and include a deep recession in Russia, with output declining by over 10% and inflation rising by close to 15 percentage points.”
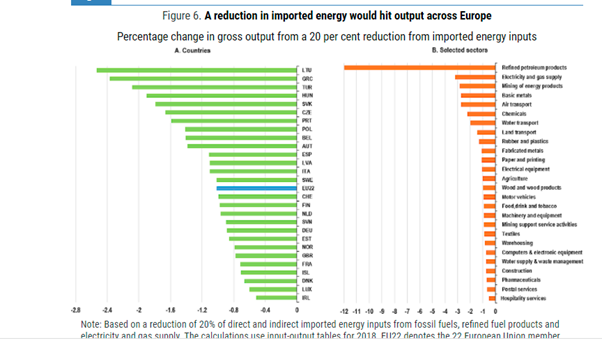
And if energy imports from Russia fall by 20%, either through sanctions or counter-sanctions, it would reduce gross output in the European economies by over 1 percentage point, with significant differences across countries.
Management consultants McKinsey also predicted nasty outcomes for Europe’s economies, in particular. In McKinsey’s hoped-for scenario, where the end of hostilities is in sight by the second half of 2022 and sanctions do not extend into the energy sector (so that energy exports from Russia to Europe keep flowing), McKinsey reckons that GDP growth in the eurozone and Germany would stagnate in 2022, but then recover to 2.1 percent in 2023 and 4.8 percent in 2024. That’s bad enough, but if there is a protracted conflict that intensifies the refugee crisis in Central Europe and where Western countries and Russia further extend sanctions, leading to the shutdown of oil and gas exports from Russia to Europe; then the eurozone would tip into recession in 2022 and 2023, led by Germany.
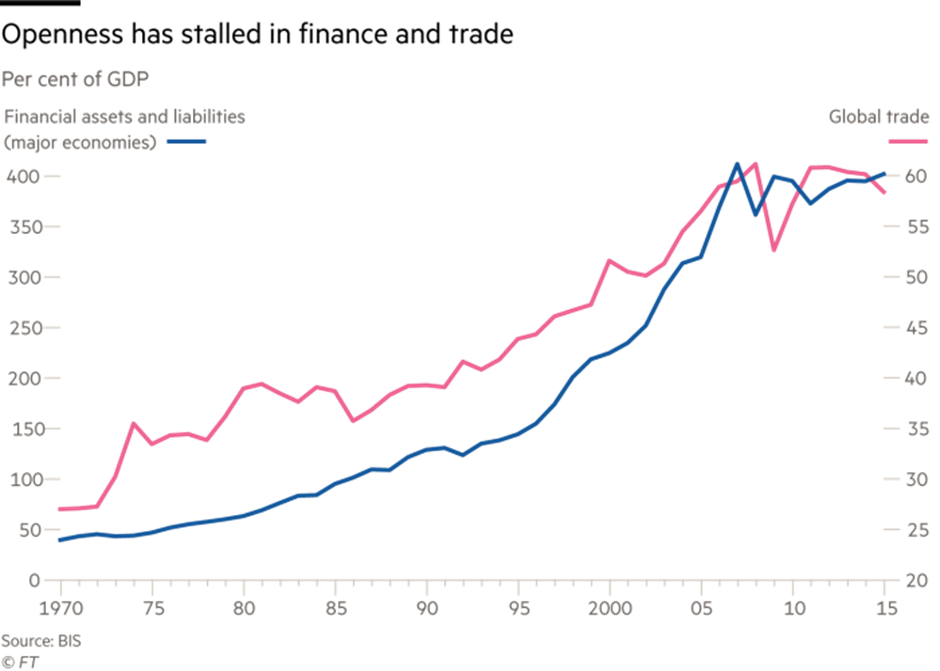
And just as there was long-term ‘scarring’ of capitalist economies from the Great Recession of 2008-and the COVID pandemic slump of 2020, the Ukraine-Russia conflict is adding more damage. ‘Globalisation’ (the extension of world trade and capital flows) was an important counter-tendency for imperialist economies to falling profitability of productive capital domestically in the last two decades of the 20th century. But globalisation, the expansion of untrammelled imperialist capital flows and trade, stuttered in the 21st century, and under the impact of the Great Recession, went into reverse. World profitability fell to near all-time lows. This is the underlying cause of intensifying economic crises and geopolitical conflicts in the last two decades.
And now that this apparently ‘regional’ war that has been revved into a world issue, it could fundamentally alter the global economic and geopolitical order as energy trade shifts, supply chains reconfigure, payment networks fragment, and countries rethink reserve currency holdings. After the Trump period US protectionist tariffs against China, Mexico and Europe, now there is this increased geopolitical tension, which further raises risks of economic fragmentation, especially for trade and technology.
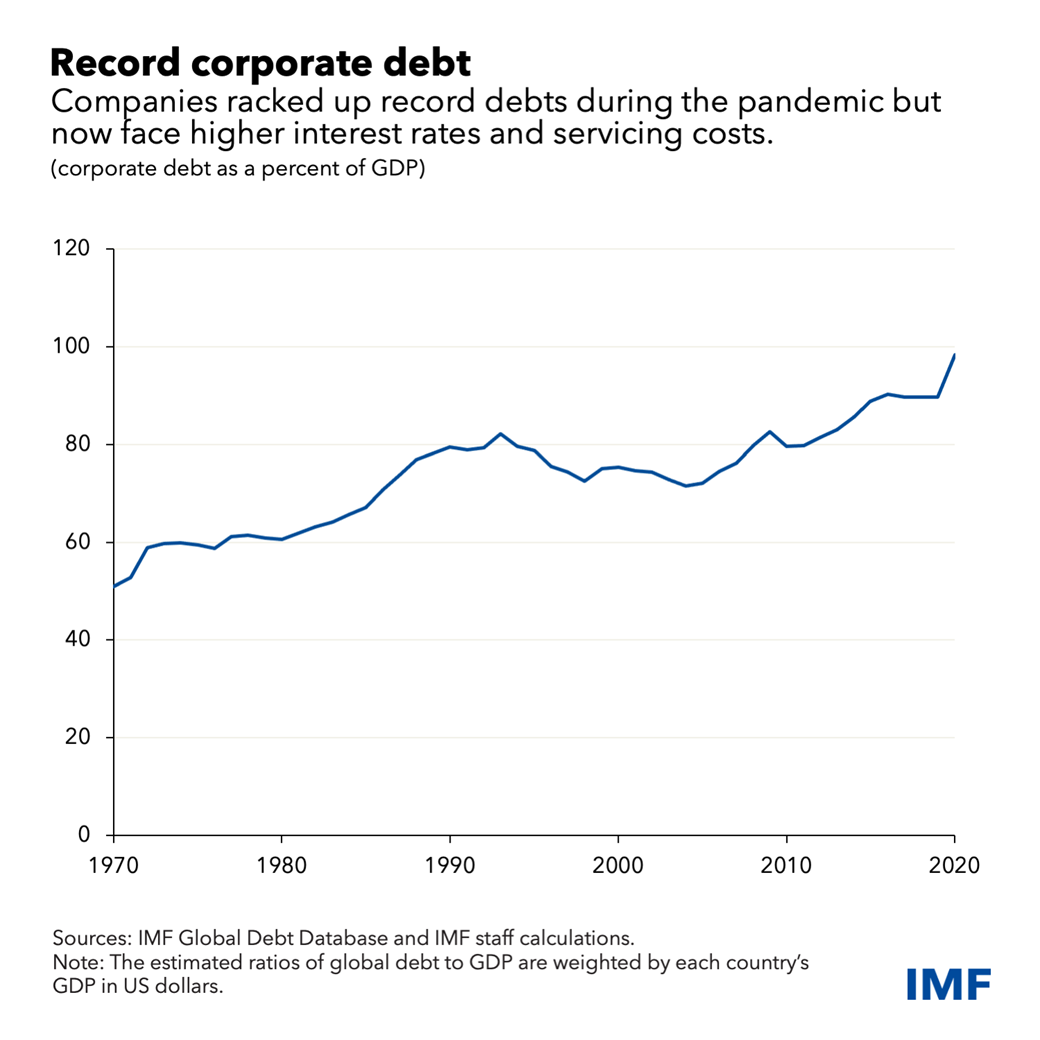
Then there is debt. The COVID-19 pandemic coincided with a further rapid increase in corporate indebtedness. Corporate debt had already been increasing globally since 2007, but the pandemic crisis has led to a further sharp increase. US corporate indebtedness rose by 12.5% between 2018 and 2020, much more than the increase in the entire decade leading up to COVID-19. Graph below shows debt as % of GDP.
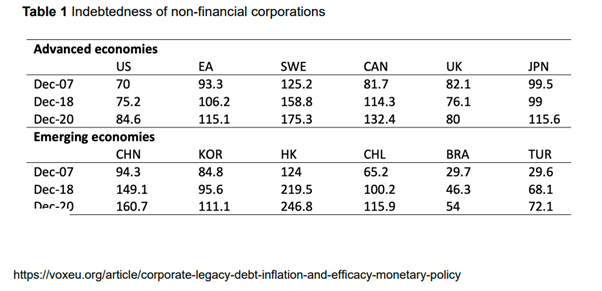
Now falling growth in output, even recession, weaker investment and lower corporate profitability, alongside rising inflation, threaten to deliver widespread bankruptcies among corporate ‘zombies’ and ‘fallen angels’. This makes the plans of central banks to hike interest rates to control accelerating inflation difficult at least, and impossible at most. One recent empirical analysis reckons that “when the level of corporate debt is sufficiently high, a contractionary monetary policy even increases inflation”, reminiscent of the stagflation episode in the 1970s after the oil ‘shocks’ then. The paper concludes that “our work suggests that monetary policy will not be effective in reducing inflation gently towards a soft landing. This means that central banks ultimately have to choose between generating a recession, with significant bankruptcies, or accepting continuing stagflation.”
‘Liberal’ economist Wolf, is deeply worried. “A new world is being born. The hope for peaceful relations is fading…. No one knows what will happen. But we do know this looks to be a disaster…....The combination of war, supply shocks and high inflation is destabilising, as the world learnt in the 1970s. Financial instability now seems very likely, too. A prolonged bout of stagflation seems certain, with large potential effects on financial markets.” In the long term, the emergence of two blocs with deep splits between them is likely, as is an accelerating reversal of globalisation and sacrifice of business interests to geopolitics. Even nuclear war is, alas, conceivable.”
Wolf claims that this war is a battle between the forces of ‘democracy’ (as represented by NATO) and the forces of ‘autocracy’ (as represented by Russia and China). This is nonsense – where does NATO ally Saudi Arabia, or the military dictatorship in Egypt, or the autocracy of NATO member Turkey, fit into this categorisation? Instead, the Russia-Ukraine conflict has exposed the increasing contradictions in the world capitalist economy between the imperialist powers on the one hand and those countries which try to resist the policies and will of imperialism.
IMF chief Georgieva pronounced that “We live in a more shock-prone world.” Yes, the shocks have been coming thick and fast in the 21st century. Georgieva continued: “And we need the strength of the collective to deal with shocks to come.” Indeed! But it is not the collective will of the capitalist powers that can deal with these shocks: they have failed over climate change; over preventing and stopping the COVID pandemic; and over ending poverty and keeping world peace. Instead, all will depend on the collective will of organised working people.


March 17, 2022
Eastern Europe’s demographic deficit
There has been a huge exodus of Ukrainians into neighbouring countries fleeing the war in their country- three million and counting. Just as in Syria and in other countries engulfed by war, there has been a refugee disaster.
But this latest exodus from Ukraine adds to the millions who have already left in the last 30 years. Even before the Ukraine-Russia conflict, there was a rising demographic deficit in Ukraine and most of Eastern Europe, including Russia. Eastern Europe’s population has been shrinking like no other regional population in modern history.
Many war ridden countries like Syria have suffered significant population loss but a population drop throughout a whole region and over decades has never been observed in the world since the 1950s. The UN estimates that there are about 292 million people in Eastern Europe, and that’s 18 million less than in the early 1990s, or more than the population of the Netherlands disappearing from the region.

The population of Eastern Europe has been shrinking since the collapse of the Soviet Union in the early 1990s. Why? Mainly because many people in the Baltic states, Bulgaria, Romania, Ukraine and other states bordering Russia have emigrated towards the ‘West’, into the European Union. They have done so in order to get work and a more prosperous life.
At least eleven countries have shrunk by more than 10% in terms of their population size since 1989, including Bulgaria, Romania and Ukraine. Latvia has lost over a quarter of its population (27%), Lithuania 23% and Bosnia and Herzegovina 21%. The Bulgarian population contracted from 9 million in 1989 to 7.1 million in 2017.
Looking forwards, the top ten countries with the fastest shrinking populations are all in Eastern Europe according to UN projections. Bulgaria, Latvia, Moldova, Ukraine, Croatia, Lithuania, Romania, Serbia, Poland, Hungary, are estimated to see their population shrink by 15% or more by 2050. For Ukraine, that forecast will now be increased.
 UN
UNBulgaria is the world’s fastest shrinking country, with its population is expected to drop from 7 million in 2017 to 5.4 million in 2050. In Latvia, the population is estimated to drop from 1.9 million in 2017 to 1.5 million, whilst in Moldova, the population is estimated to shrink from 4 million to 3.2 million.
Emigration has been the safety valve for very weak capitalist economies, which otherwise could not deliver employment or better living conditions. Indeed, the main reason that per capita income has risen in these weak economies in the 21st century is through a reduction in the number of people living there.
Emigration is a traditional solution for weak capitalist economies often driven into poverty by imperialism. Such was the case for Ireland for over 150 years: whenever the economy slumped, Irish people emigrated. Similarly, Italians, Greeks, Portuguese and Spanish emigrated in the post-1945 period. And in the euro-debt crisis of 2012-15, emigration in all these EU countries saw sharp rises in emigration to the richer northern EU economies – about one million moved from south to north.
On the flipside, any growth in Europe’s population was largely as a result of immigration). While the number of births and deaths were equal at 5.1 million each, net migration boosted the population by 1.5 million to 511.8 million. But emigration will not be enough to reverse the decline in population in the ageing economies of northern Europe like Germany, as I have shown before in a previous post.
And that is even more the case for southern Europe. According to the UN, Portugal, Italy, Greece, and Spain will all see their working age populations decline by more than 25% These four countries are all in the top six globally on this measure, behind only South Korea and Japan. All four countries will see more dependents than working age people by 2050.
Figure 1. 2020-2050 working age population decline and 2050 worker gap
 UN
UNPoland, Romania, and Ukraine will also see working age populations fall by 25% or more between 2020 and 2050. They will also see rising old-age dependency ratios to 60% in the case of Poland, 52% in Romania and 46% in Ukraine. This “worker gap” is 50% or above in Poland, Portugal, Italy, and Greece and 30-40% in Russia, Ukraine, Romania, and Czechia.
Economies grow in GDP terms if employment rises and/or the productivity per worker rises. Most advanced capitalist economies are facing a fall in the working-age population and employment, but that is compensated by a rise in productivity per worker to achieve at least some real GDP growth. Increased productivity depends on rising productive investment per worker. Eastern Europe faces a demographic deficit ie a fall in its productive workforce more than any other region in the world. Can capitalism in that region deliver faster growth in the productivity of labour to compensate over the next decade or so? If not, the poorer parts of the region to the west of Ukraine will offer no economic security for Ukrainians now fleeing their homeland.
March 13, 2022
The three contradictions of the Long Depression
One of my basic theses about modern capitalism is that since 2008, the major capitalist economies have been in what I call a Long Depression. In my book of 2016 of the same name, I distinguish between what economists call recessions or slumps in production, investment and employment; and depressions. Under the capitalist mode of production (ie production for profit appropriated from human labour (power) by a small group of owners of the means of production), there have been regular and recurring slumps every 8-10 years since the early 19th century. After each slump, capitalist production revives and expands for several years, before slipping back into a new slump.
However, depressions are different. Instead of coming out of a slump, capitalist economies stay depressed with lower output, investment and employment growth than before for a longish period.
 From the Long Depression introduction
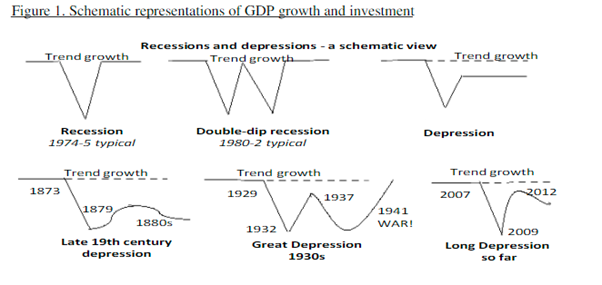
There have been three such depressions in capitalism: the first was in the late 19th century in the US and Europe, lasting more or less from about 1873 to 1897, depending on the country. During that long depression, there were short periods of upswing but also a succession of slumps. Overall, output and investment growth remained much weaker than in the previous expansion period of 1850-73.
The second depression was the so-called Great Depression lasting from 1929-1941 up to WW2, mainly in the US and Europe, but also in Asia and South America.
The third depression began after the Global Financial Crash of 2007-8 and the ensuing Great Recession of 2008-9. This depression (as defined) lasted for a decade up to 2019 until it seemed that the major economies were not only growing much more slowly than before 2007, but were heading into an outright slump.
Then the COVID pandemic slump happened and the world economy suffered a severe contraction.
Now, just as the major economies were staggering out of the pandemic, the world has been hit again by the Russia-Ukraine conflict and its ramifications for economic growth, trade, inflation and the environment.
The contradictions in the capitalist mode of production have intensified in the 21st century. Now there are three components. There is the economic: with the Global Financial Crash of unprecedented proportions occurring in 2007-8, followed by the Great Recession of the 2008-9 (the biggest economic slump since the 1930s).
Then there is the environmental, with the COVID pandemic as capitalism’s rapacious drive for profit led to uncontrolled urbanisation, energy and minerals exploitation, along with industrial farming. This eventually led to the release of dangerous pathogens previously locked into animals in remote regions for thousands of years. These pathogens have now escaped across farm animals and from (possibly) laboratories into humans with devastating results.
And don’t forget the impending global warming nightmare descending on the poor and vulnerable globally.

Third, there is the geopolitical contradiction amid the struggle for profit among capitalists in this depressed economic period. Competition has intensified between the imperialist powers (G7-plus) and some economies which have resisted the bidding of the imperialist bloc, like Russia and China. So, in the 21st century; from Iraq to Afghanistan and onto Yemen and Ukraine, geopolitical conflicts are increasingly being conducted through war. And the big battle between the US and China/Taiwan is coming closer.
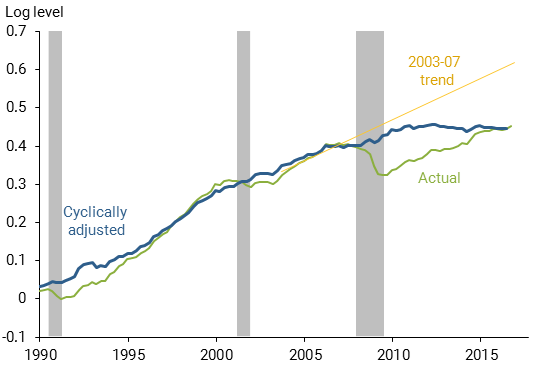
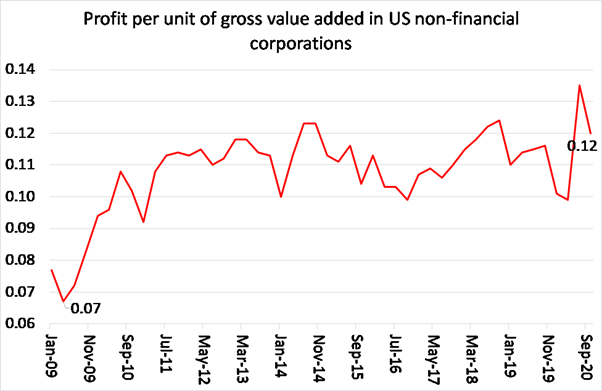
The Long Depression of the 21st century may have begun in 2009, but the economic forces that caused it were underway as early as 1997 onwards. It was then that the average rate of profit on capital in the major capitalist economies began to fall and, despite some small bursts of recovery (mainly driven by economic slumps and huge credit injections), the profitability of capital remains near all-time lows.
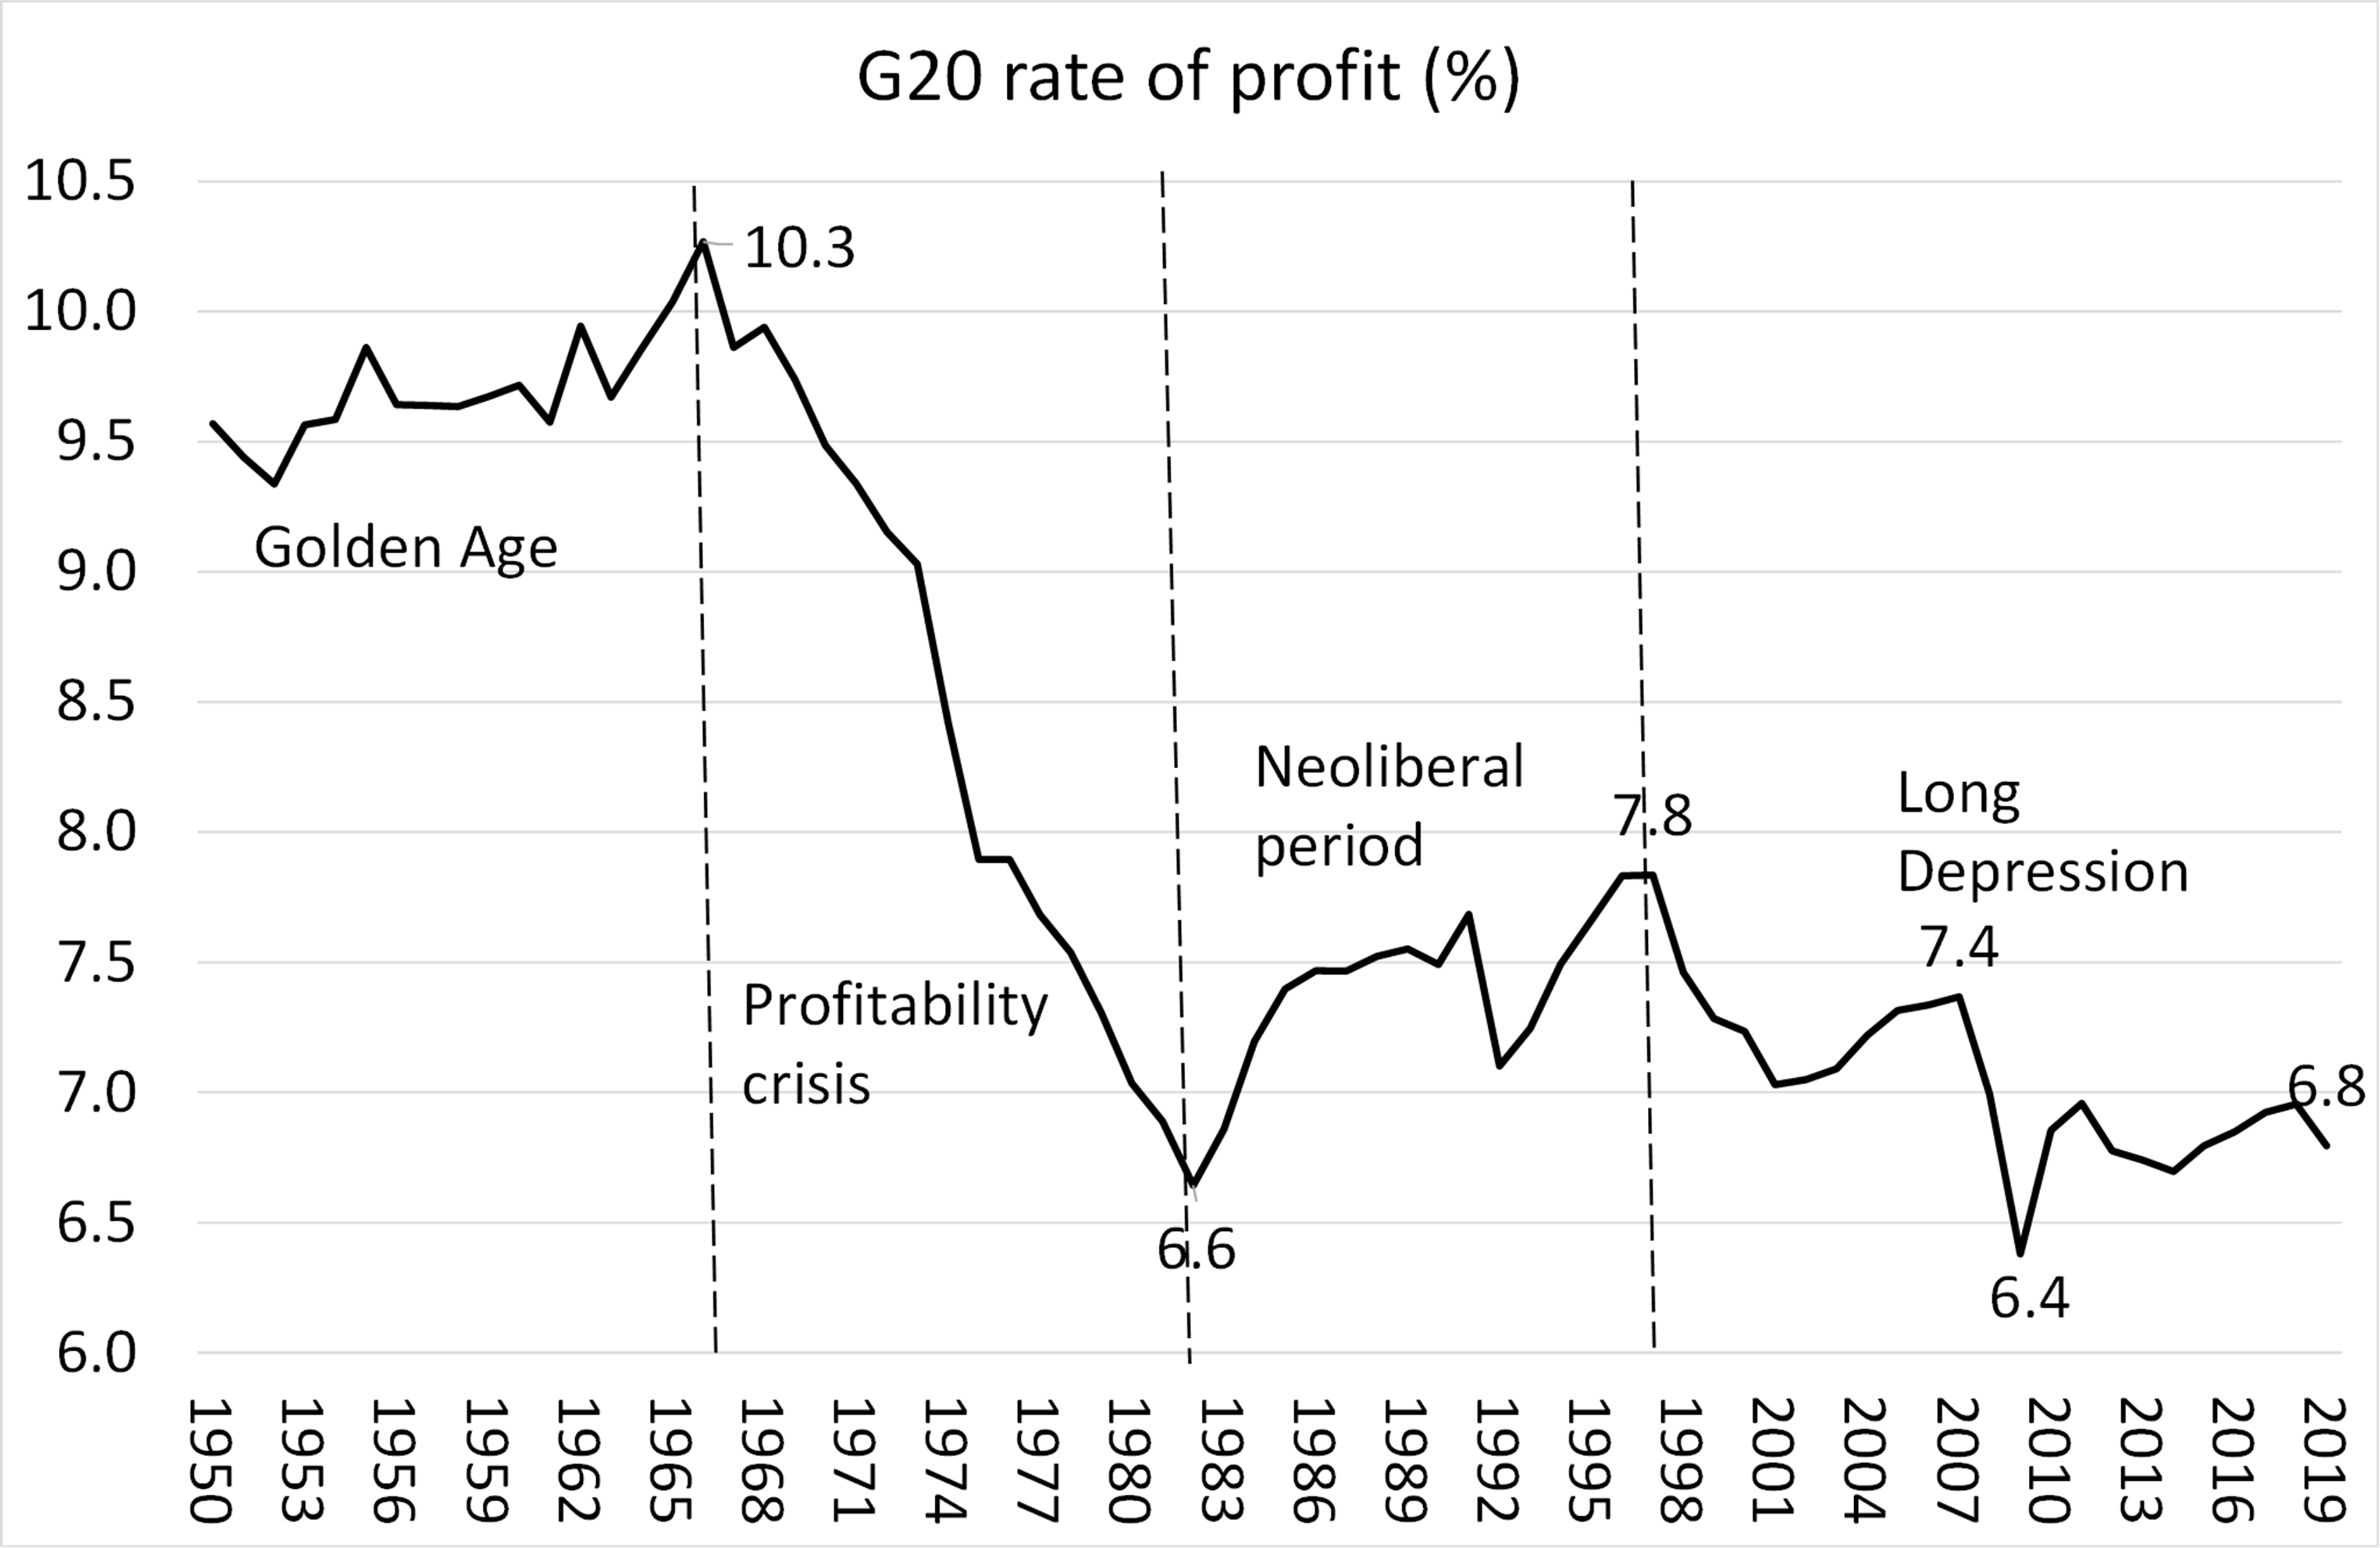 Penn World Tables, author calculation
Profit drives investment in capitalism; and so falling and low profitability has led to slow growth in productive investment. Instead, capitalist institutions have increasingly speculated in financial assets in the fantasy world of stock and bond markets and cryptocurrencies. And the imperialist bloc increasingly looks to compensate for weakness in the ‘global north’ by exploiting further the ‘global south’.
So far, there is little sign that capitalism can get out of this Long Depression, even if the current Ukraine disaster is resolved. To end the depression would require a cleansing of the economic system through a slump that liquidates the zombie companies that reduce profitability and productivity growth and increase debt burdens.

Also, it seems that recalcitrant economic powers like Russia and China must be tamed or crushed if the major capitalist economies can have a new lease of life. That’s a frightening prospect. The only hope of escape from the impact of the Long Depression and more wars is for the coming to power of democratic socialist governments based on working people, which can sponsor a real united nations to end economic crises; reverse environmental disasters for the planet; and achieve a peaceful development of human society.
March 9, 2022
Korea: from Moon to Yoon
In South Korea’s presidential election, held every five years, the conservative candidate, Yoon Suk-yeol of the People Power Party gained a narrow victory over the ‘progressive’ Lee Jae-myung of the ruling Democratic Party. The turnout at 77.1%, high by international standards, was pretty much in line with previous elections. The older the voter, the more they voted for Yoon over Lee, although previous enthusiasm among younger voters for the Democratic party had also waned after five years of President Moon Jae-in’s presidency. This explains the switch of parties in office in Korea.
The difference between the two candidates for the Blue House in Korea is much like the difference between a Republican and Democrat for the White House in the US. On foreign policy, Yoon championed a stronger alliance with the United States and even threatened “pre-emptive strikes” against North Korea, while Lee called for a diplomatic balance between the United States, South Korea’s security ally, and China, its biggest trading partner.
But foreign policy was not the issue for younger voters. Young Koreans are frustrated over housing prices, a lack of job opportunities and a widening income gap. Many have adopted a saying: “isaenggeul,” or “We can’t make it in this life.” “In the past, young South Koreans tended to vote progressive, but now they have become swing voters,” said Prof. Kim Hyung-joon, an election expert at Myongji University in Seoul. “To them, nothing matters as much as fairness and equal opportunity and which candidate will provide it. “We will be the first generation whose standard of living will be lower than our parents’,” said Kim Dong-min, 24, a student at Konkuk University Law School. In a survey last year, nearly 65 percent of the respondents in South Korea said they were sceptical that their children’s economic future would be better than their own.
Yoon’s economic program is classically neo-liberal. He supports ‘market-led approaches’, including job creation led by the private sector rather than government projects. He says he plans to cut ‘red tape’ for companies and to deregulate the virtual asset industry. He will lower capital gains and property ownership taxes to increase housing transactions. And he has proposed raising the tax threshold for cryptocurrency investments from the current 2.5 million won to 50 million won.
On the vexed housing issue, Yoon could not be more helpful to the rich and to property companies. He would abolish a planned new tax for people who earned 50 million won from stock investments, to be effective next year, and cut real estate holding taxes to increase housing transactions. Yoon says current property regulations must be eased and guided by “market principles.” And he vowed to create at least 2.5 million homes in the next five years, including 500,000 in the capital Seoul, presumably through private developments.
In contrast, Lee called for an expansionary fiscal policy and universal basic income of 1 million won ($800) per year to every individual. Lee initially said he would pay for his universal income plans by levying taxes on carbon emissions and impose a new, nationwide land ownership tax, under which homeowners would pay taxes on the land their homes occupy. Recently, however, he reneged on this and promised not to raise any taxes and instead proposed a temporary easing of property-related taxes for multiple home owners, saying he may reduce his universal income plans accordingly. Backing down on his original policies did not help.
But will anything really change in the Korean economy with Yoon in office? A G20 economy, Korea is supposedly an economic success story for capitalism, with economic growth averaging 5.5% since 1988, led by annual export growth of 9.3% a year. Korea’s GDP per person has risen from just US$67 in the early 1950s to $34,000 in 2019. But the slowdown in investment and productivity since the Great Recession has been visible. Labour productivity rose at an average annual rate of 5.5% in 1990-2011, but it has stagnated since then and remains only 40% of the three most productive OECD countries. Labour productivity is particularly low in the service sector—much lower than in peer economies and only half that of manufacturing and much lower in smaller companies.
Korea weathered the COVID-19 pandemic comparatively well, supported by a reasonably effective public health response. As a result, Korea’s economic contraction in 2020 was smaller than in most other advanced economies, with real GDP declining only by 1%. But the economy under Moon, as in many other G20 economies, slowed to an average of just 2.8 percent over the last five years, reaching only 2.0 percent in 2019. And the IMF reckons that Korea’s real GDP will still be some 2-3% below the pre-pandemic path in 2025.
 IMF
IMFThe pandemic has left economic scarring through weakened corporate balance sheets weighing on investment and job creation; subdued employment due to the high number of labour force exits; and poor productivity growth. Korea was already lagging in high-skill sectors.
 IMF
IMFIn my post on the last elections in 2017, I highlighted the scandals of corruption and links to the shady activities of Korea’s huge private corporations called chaebols. Korea’s past economic success depended on a state-directed industrialisation and export strategy; but that also meant close connections between its chaebols (Samsung etc) and government. In that post, I discussed Korea’s over dependence on heavy industry; the horrendously long hours for its workers; the poverty of its elderly; and rising inequalities of wealth and incomes.
The World Inequality Database shows that the top 10% of Koreans by income have increased their share of income and sharply raised their share of household wealth (property and financial assets). In the last five years, that story has not really altered – indeed things have got worse.

With nearly three-quarters of household wealth concentrated in real estate, no index illustrates widening inequality quite like housing prices. Young couples whose wealthy parents helped them buy apartments — a tradition in South Korea — saw their property value in Seoul nearly double under Moon. But the average household, on the other hand, must save its entire income for 18.5 years in order to afford an apartment in the city, according to estimates by KB Kookmin Bank.
South Korea’s poverty rate and its income inequality are among the worst among wealthy countries, with youths facing some of the steepest challenges. Nearly one in every five South Koreans between the ages of 15 and 29 was effectively jobless as of January, according to government data.
Behind the productivity and investment growth slowdown in the 21st century is the secular fall in the profitability of capital. A study by Marxist economist Seongjin Jeong of Gyeongsang National University exposed a downward trend in the profitability of the productive sectors, particularly since the mid-1980s.
 Seeog Jeong
We can now supplement Jeong’s study with data from the Penn World Tables going up to 2019. This shows a steady decline in profitability (the internal rate of return on capital) after a short recovery from the slump of 1997-8. The end of the dictatorship appears to have been the turning point in the profitability of Korean capital.
 Penn World Tables 10.0
The future of Korean capitalism is tied up with the future of global capital. No national economy can escape that. But there are specific challenges for Korean capital too; for example, what will happen with North Korea?
If and when the regime falls there, Korean capital is no position to integrate the people of the north into the capitalist system of the south. The cost to West German capital when the Berlin Wall fell and Germany was united again was significant and held back one of the most successful capitalist economies for a decade. The disruption to Korean capital would be very much greater, especially if this should happen in this period of economic stagnation and political turmoil as the world is experiencing now. North Korea remains the elephant in the room for the South.
March 6, 2022
Fallen angels
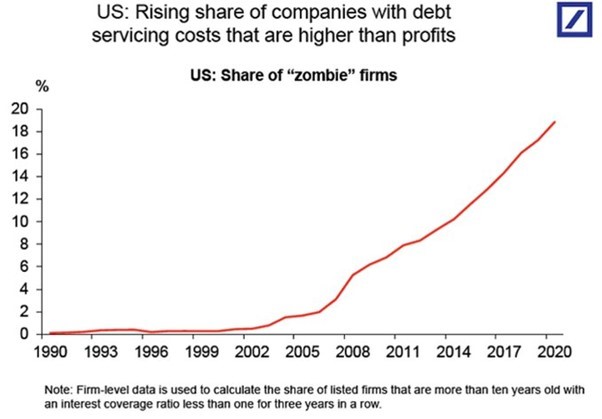
In several previous posts, I have highlighted what are called ‘zombie’ companies (companies whose regular profits do not even cover the cost of servicing their outstanding debts) and so must, to paraphrase former BoE governor Mark Carney, depend on the kindness of their creditors”. An OECD study found that such zombies take up a frighteningly large part of the economy. Across the nine European countries they studied, the share of the total private capital stock ‘sunk’ in zombie companies ranges from 5 to 20 per cent. The suggestion is that such businesses hog capital and crowd the market for newcomers, make it harder for more promising companies to expand and hold back the reallocation of labour and capital to more productive and faster-growing companies.
The OECD concludes that “the prevalence of, and resources sunk in, zombie firms have risen since the mid-2000s, which is significant given that recessions typically provide opportunities for restructuring and productivity-enhancing allocation” and that “a higher share of industry capital sunk in zombie firms tends to crowd out the growth—measured in terms of investment and employment—of the typical non-zombie firm.” All in all “a 3.5% rise in the share of zombie firms—roughly equivalent to that observed between 2005 and 2013 on average across the nine OECD countries in the sample—is associated with a 1.2% decline in the level of labour productivity across industries.”
The ECB also did a report on zombies and found that (whatever-it-takes ) “industries with a prevalence of zombie firms suffered significantly from the credit misallocation, which slowed down the economic recovery.”

These are somewhat old reports, but the incidence of zombies has not receded since 2017, on the contrary. Since the Great Recession of 2009-9 there has been no clearing out of corporate ‘deadwood’. Indeed, the so-called zombie companies were growing in numbers before the COVID pandemic slump hit. And during that slump, all the zombies were put on life support by fiscal and monetary largesse from the governments of the advanced capitalist economies. Here is the estimate from the Bank for International Settlements (BIS).
Now in a new study, BIS economists have discerned a new category of vulnerable companies in the major economies, which they have designated as ‘fallen angels’. These are companies that have run up large debts at very low rates of interest (based on the injection of credit by central banks in their ‘quantitative easing’ programmes. These firms used cheap credit not to invest in productive capital but to fund risky acquisitions and increase market share. They issued bonds to do so. Between 2008 and 2020, the amounts outstanding of BBB-rated bonds (these are lower grade bonds) have more than tripled in size to $3.5 trillion, representing 55% of all investment-grade debt, up from 33% in 2008. But the profitability of BBB-rated firms did not keep up with their increased indebtedness (se right hand panel in figure below).
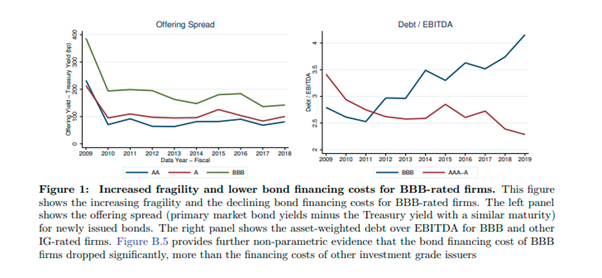
Prospective ‘fallen angels’ are firms on the cusp of losing their ‘investment-grade’ credit status because they have accumulated more debt than they can handle. So they are vulnerable to ‘downgrades’ in their credit status which would sharply raise their debt servicing costs. Indeed, these prospective fallen angels have been able to obtain cheaper funding than even their safer counterparts. The BIS estimates that the credit subsidy accruing to prospective fallen angels amounted to $307 billion between 2009 and 2019.
The steady increase of non-financial business debt over the past 10 years has made it the largest private debt category today, equivalent to 82% of GDP in 2020. The last credit cycle has been entirely driven by non-financial business debt, which increased from $10 trillion in 2008 to $17 trillion in 2020. The increase in non-financial corporate debt has been mostly driven by corporate bonds, with the stock outstanding increasing from around $3 trillion in 2009 to around $6 trillion in 2020. This increase, in turn, is almost entirely driven by bonds issued by BBB-rated firms, the potential ‘fallen angels’, the lowest rated segment of the investment-grade bond market. This segment has tripled in size from around $0.7 trillion in 2009 to more than $2 trillion in 2018 and represents around 52% of all IG bonds outstanding, up from 33%. Since 2009, their stock of bonds outstanding tripled in size to $1.5 trillion in 2018. During the same period, the safer corporate debt increased only from $0.2 to $0.5 trillion.
Why does this matter? It matters if interest rates on corporate debt were to rise sharply at the same time as the profitability of these companies were to fall. That would create the conditions for bankruptcies and debt defaults ricocheting across the corporate sector and provoking financial market crash and an economic recession. The identification of fallen angels as well as zombie companies reveals that risk is now much higher than previously thought.
Rising debt will not be enough to cause a slump; it also requires falling profitability of capital invested. In a recent paper, Argentine economists Grana and Aquina show that 1) these zombie firms have increased in number since the 1980s and 2) the cause is not the rising cost or the size of their debt but because these firms have much lower rates of profit from production, forcing them to borrow more. So zombies and fallen angels have a Marxist, not a Minskyean cause.
And as we review the current state of the major economies amid the Russia-Ukraine conflict, the conditions for this corporate meltdown are rising significantly. First, there is accelerating inflation. Global commodity prices hit the highest level since 2008 this week as the Ukraine crisis intensified worries about global supplies of raw materials. West Texas Intermediate, the US oil benchmark, rose as high as $115 a barrel, a level it last struck 14 years ago.
Wheat, corn, and sunflower are all at risk in Russia and Ukraine. Beyond that, however, the surge in natural gas prices is making it cost-prohibitive to produce ammonia while potash exports from Russia and Belarus (together comprising one-third of global traded product) are at risk. Both are essential ingredients to fertilizers. This could disrupt agriculture broadly throughout this year and into next year.

Raw material, food and energy price rises are feeding through to prices in the shops and in utility tariffs in the major economies.

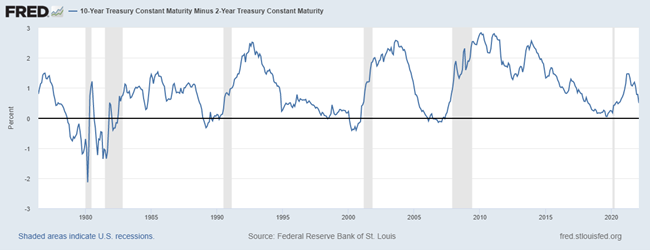
Before the Ukraine crisis, central banks were talking tough about hiking interest rates. They had no choice even though the debt risk from vulnerable companies was rising. They had to control inflation. As a result, the US government bond yield curve has been flattening. The difference between 2-year and 10-year bond yields is now less than 0.3 percentage points. As I have pointed out before, a flat or ‘inverted’ yield curve (where interest rates are higher on 2yr bonds than on 10yr bonds) usually signals an oncoming slump. That’s because bond investors start to buy longer maturity bonds while central banks hike rates. A negative or inverted yield curve has presaged a slump (shaded areas) on several occasions.
So the Fed and other central banks are now even more of a dilemma. That’s because of the other blade in the scissors cutting into the major capitalist economies: slowing growth and even recession ahead. Several forecasts of the impact of the Russian invasion of Ukraine reckon that the world economy will lose about 1% pt on expected real GDP growth this year and next.

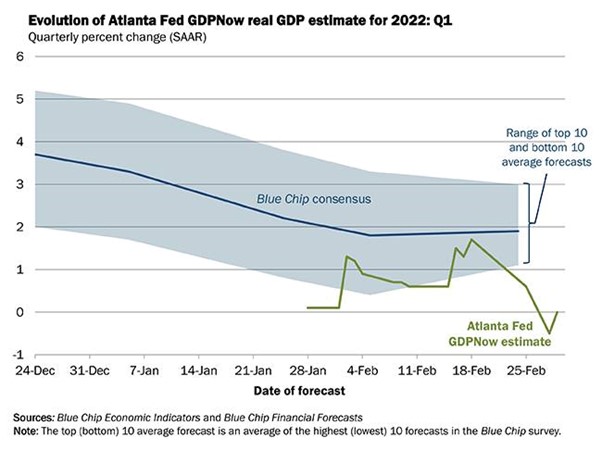
Even the US economy, the best performer of the G7 economies during the pandemic slump look like grinding to halt, notwithstanding the supposed jobs recovery towards ‘full employment’ claimed. The Atlanta Fed GDP Now estimate for this current quarter is for zero real GDP growth.
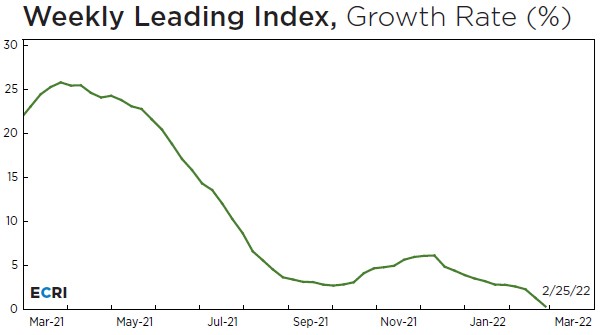
And another ‘leading’ measure of US economic activity, the ECLI also forecasts zero growth.
Much has been made of the strong jobs figures in the US as workers there get back to work now that restrictions on the COVID pandemic have been abandoned. But there are 3.5 million fewer jobs now compared to the number that would have been available without the pandemic slump. What’s happened is that many workers have left second jobs or have become self-employed (which always pays less than full-time employment).

Corporate profits globally have risen sharply during 2021 after being hugely negative in 2020. But the pace of profits recovery is waning and global profits are still 3% below the level achieved at the end of 2019 before the pandemic.
 Author
As the IMF commented before the Ukraine crisis broke: “Companies entered the COVID-19 crisis with record debts they racked up after the global financial crisis when interest rates were low. Corporate debt stood at $83 trillion, or 98 percent of the world’s gross domestic product, at the end of 2020. Advanced economies and China accounted for 90 percent of the $8.9 trillion increase in 2020. Now that central banks are raising rates to check inflation, firms’ debt servicing costs will increase. Corporate vulnerabilities will be exposed as governments scale back the fiscal support that they extended to stricken firms at the height of the crisis.”
February 27, 2022
Russia: from sanctions to slump?
The economic war between the US-led NATO group and Russia is hotting up alongside the real war in Ukraine itself. In response to the invasion of Ukraine by Russia, the US and Europe have upped the ante in imposing economic sanctions. The first of these was the suspension of any dealings with several leading Russian banks, including the two largest, Sberbank and VTB. However, it was significant that the sanctions excluded Gazprombank, the major Russian lender to energy export companies. Clearly, the West does not want to disrupt oil and gas exports through sanctions, when Germany alone relies on 40% of its energy from Russian imports.
As a result, the NATO sanctions package has substantial exceptions. Most notably, while it sanctions major Russian financial institutions, it exempts certain transactions with those institutions related to energy and agricultural commodities, which account for nearly two-thirds of total exports. Significantly, Italy successfully lobbied to exempt the sale of Italian Gucci bags to Russia’s rich from the export ban!
So now EU leader Von der Leyen and Biden in the White House announced that “we will work to prohibit Russian oligarchs from using their financial assets on our markets.” Biden says that the US will “limit the sale of citizenship – so-called golden passports – that let wealthy Russians connected to the Russian government become citizens of our countries and gain access to our financial systems”. The EU and the US are launching a task force to “identify, hunt down and freeze the assets of sanctioned Russian companies and oligarchs, their yachts, their mansions, and any ill-gotten gains that we can find and freeze.”
The irony and hypocrisy of these proposed measures should not be missed. For decades, Western governments have been happy to take this ‘dirty money’ and even allow the oligarchs to gain citizenship and special privileges to exert influence in politics in their countries in order to bolster pro-capitalist parties. Now these privileges are to be withdrawn (although we shall see how far this goes).
Russia’s super-rich (including Putin) have massively increased their wealth during the COVID pandemic. Russia’s billionaires (we like to call them ‘oligarchs’ in the West) have the highest share of wealth to GDP of all the major capitalist economies, closely followed by ‘social democratic’ Sweden, and then the US.

Like other billionaires, Russia’s export and hide their wealth in tax havens, and in obliging Swiss and other banks and also buy property and assets abroad. Their ‘offshore’ wealth is way higher than other billionaire groups.
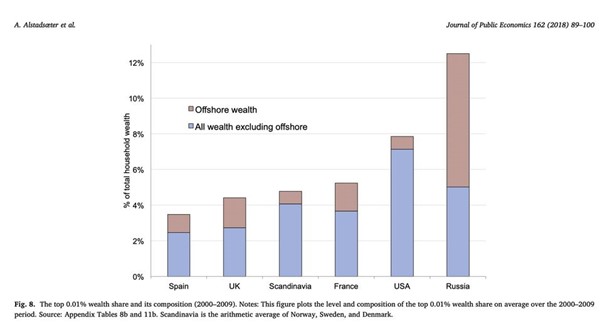 Source: Gabriel Zucman;
 Export and trade bans, the suspension of dealings with selected banks, and the withdrawal of some privileges for Russian oligarchs will have little effect on Russia. Energy trade is to continue, with Russia still providing 25-30% of European energy supplies. And Russia is no longer dependent on external financing. Russia’s current account surplus has risen from below 2% of GDP 2014 to around 9% of GDP in 2021, leaving substantial buffers of excess savings that can be tapped should the need arise. The wider public sector, including the Central Bank of Russia (CBR), the corporate sector, and the financial sector are net external creditors. The CBR has over $630bn in reserves, enough to back up three quarters of domestic money supply, so there would be no need to print rubles to fund economic activity. In addition, Russia has a $250bn sovereign wealth fund, which although relatively illiquid, could be run down to bolster funding.
Russian businesses and the government have prepared for potential future shocks like losing access to the dollar and the use of the USD in trade and financial transactions has already sharply declined. The Ministry of Finance no longer holds any USD-denominated assets in its oil fund and the CBR has also reduced the share of USD in its reserves by half, to around 20%; as the euro, and to a lesser extent the Chinese renminbi, have become preferred alternatives. Many Russian corporates and banks now routinely include clauses in contracts that stipulate the use of another currency for settlement in case the USD can’t be used. Russia has also accelerated the use of its own payment cards, like Mir, as well as its own SWIFT-like System for Transfer of Financial Messages (SPFS) messaging service. However, both currently only operate domestically, leaving vulnerability to cross-border transactions in other currencies.
That’s why the US and European governments have now decided to introduce much more serious sanctions. They now plan to kick Russian banks out of the SWIFT international transactions system and to freeze Russian central bank assets. The SWIFT measure will sharply complicate the ability of Russian banks to conduct international activities. They will be forced to use bilateral arrangements with ‘friendly‘ banks, or old technology like faxes.

But this could also damage banking and trade for Europe, in particular, if the Russian energy lender Gazprombank is also removed from SWIFT (not likely).
The most serious measure is the proposal to freeze the dollar assets of the Russian central bank. This has never happened to a G20 member state before. Only Venezuela, North Korea and Iran’s CBs have suffered this fate. If effective, it would mean that Russian FX reserves in dollars could not be used at all to support the ruble in international FX markets or sustain domestic commercial bank dollar financing. The government would have to rely on ruble financing (and the ruble is plunging in world currency markets) and non-fiat currencies like gold.
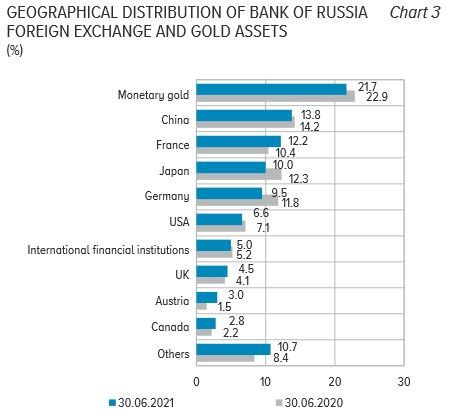
Most of Russia’s currency FX reserves are held in Western central banks. Russia has about 23% of its reserves in gold, but it is not clear where this is physically held. If this proposed sanction is applied, then it could seriously damage monetary flows and the Russian ruble, causing accelerated inflation and even runs on banks.
Then there are the ‘slow burn’ sanctions on Russia’s access to key technologies. The US aims to cut Russia off from global chip supplies. The move shuts off supply from leading US groups such as Intel and Nvidia. Taiwan Semiconductor Manufacturing Company, the world’s largest contract chipmaker, which controls more than half the global market for made-to-order chips, has also pledged full compliance with these new export controls. Russia is now effectively denied access to high-end semiconductors and other tech imports critical to its military advancement. However, it’s possible that Chinese companies, especially those that have themselves been the target of US sanctions, might help Russia circumvent the export controls. Huawei could step in to develop the Russian telecom equipment market.
All in all, Putin’s invasion of Ukraine is a huge gamble which if it does not succeed in ‘neutralising’ Ukraine and forcing NATO into an international agreement, will seriously weaken the Russian economy. And Russia is no super power, economically or politically. Its total wealth (including labour and natural resources) is way down the league compared to the US and the G7.
 World Bank Wealth Report
The collapse of the Soviet Union in 1990 was followed by Yeltsin and the pro-capitalist government accepting the ‘shock therapy’ policies of Western economists to privatise state assets and dismantle public services and the welfare system. A small elite, mainly former Soviet government officials, were able to buy massive state assets in energy and minerals on the cheap and through bribery and thuggery. Russia’s oligarchs emerged, along with an increasingly autocratic regime personified by Putin. Russia’s GDP plummeted and average living standards dropped sharply. The Russian capitalist economy eventually recovered with the global commodity price boom after 1998, but by 2014, Russia’s average annual GDP growth was still only 1.0%.
Life expectancy in capitalist Russia has now been surpassed by China.
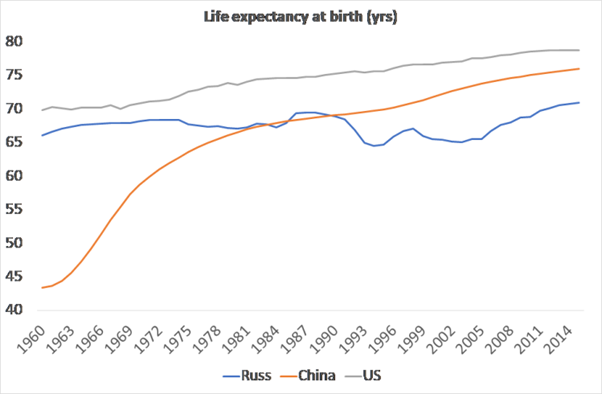 World Bank
And when we look at the World Bank’s Human Development Index, which measures key dimensions of human development (a long and healthy life, being knowledgeable and having a decent standard of living), we find that since 1990 Russia has performed worse among major emerging economies and compared to the world average.
 Human Development Index – World Bank
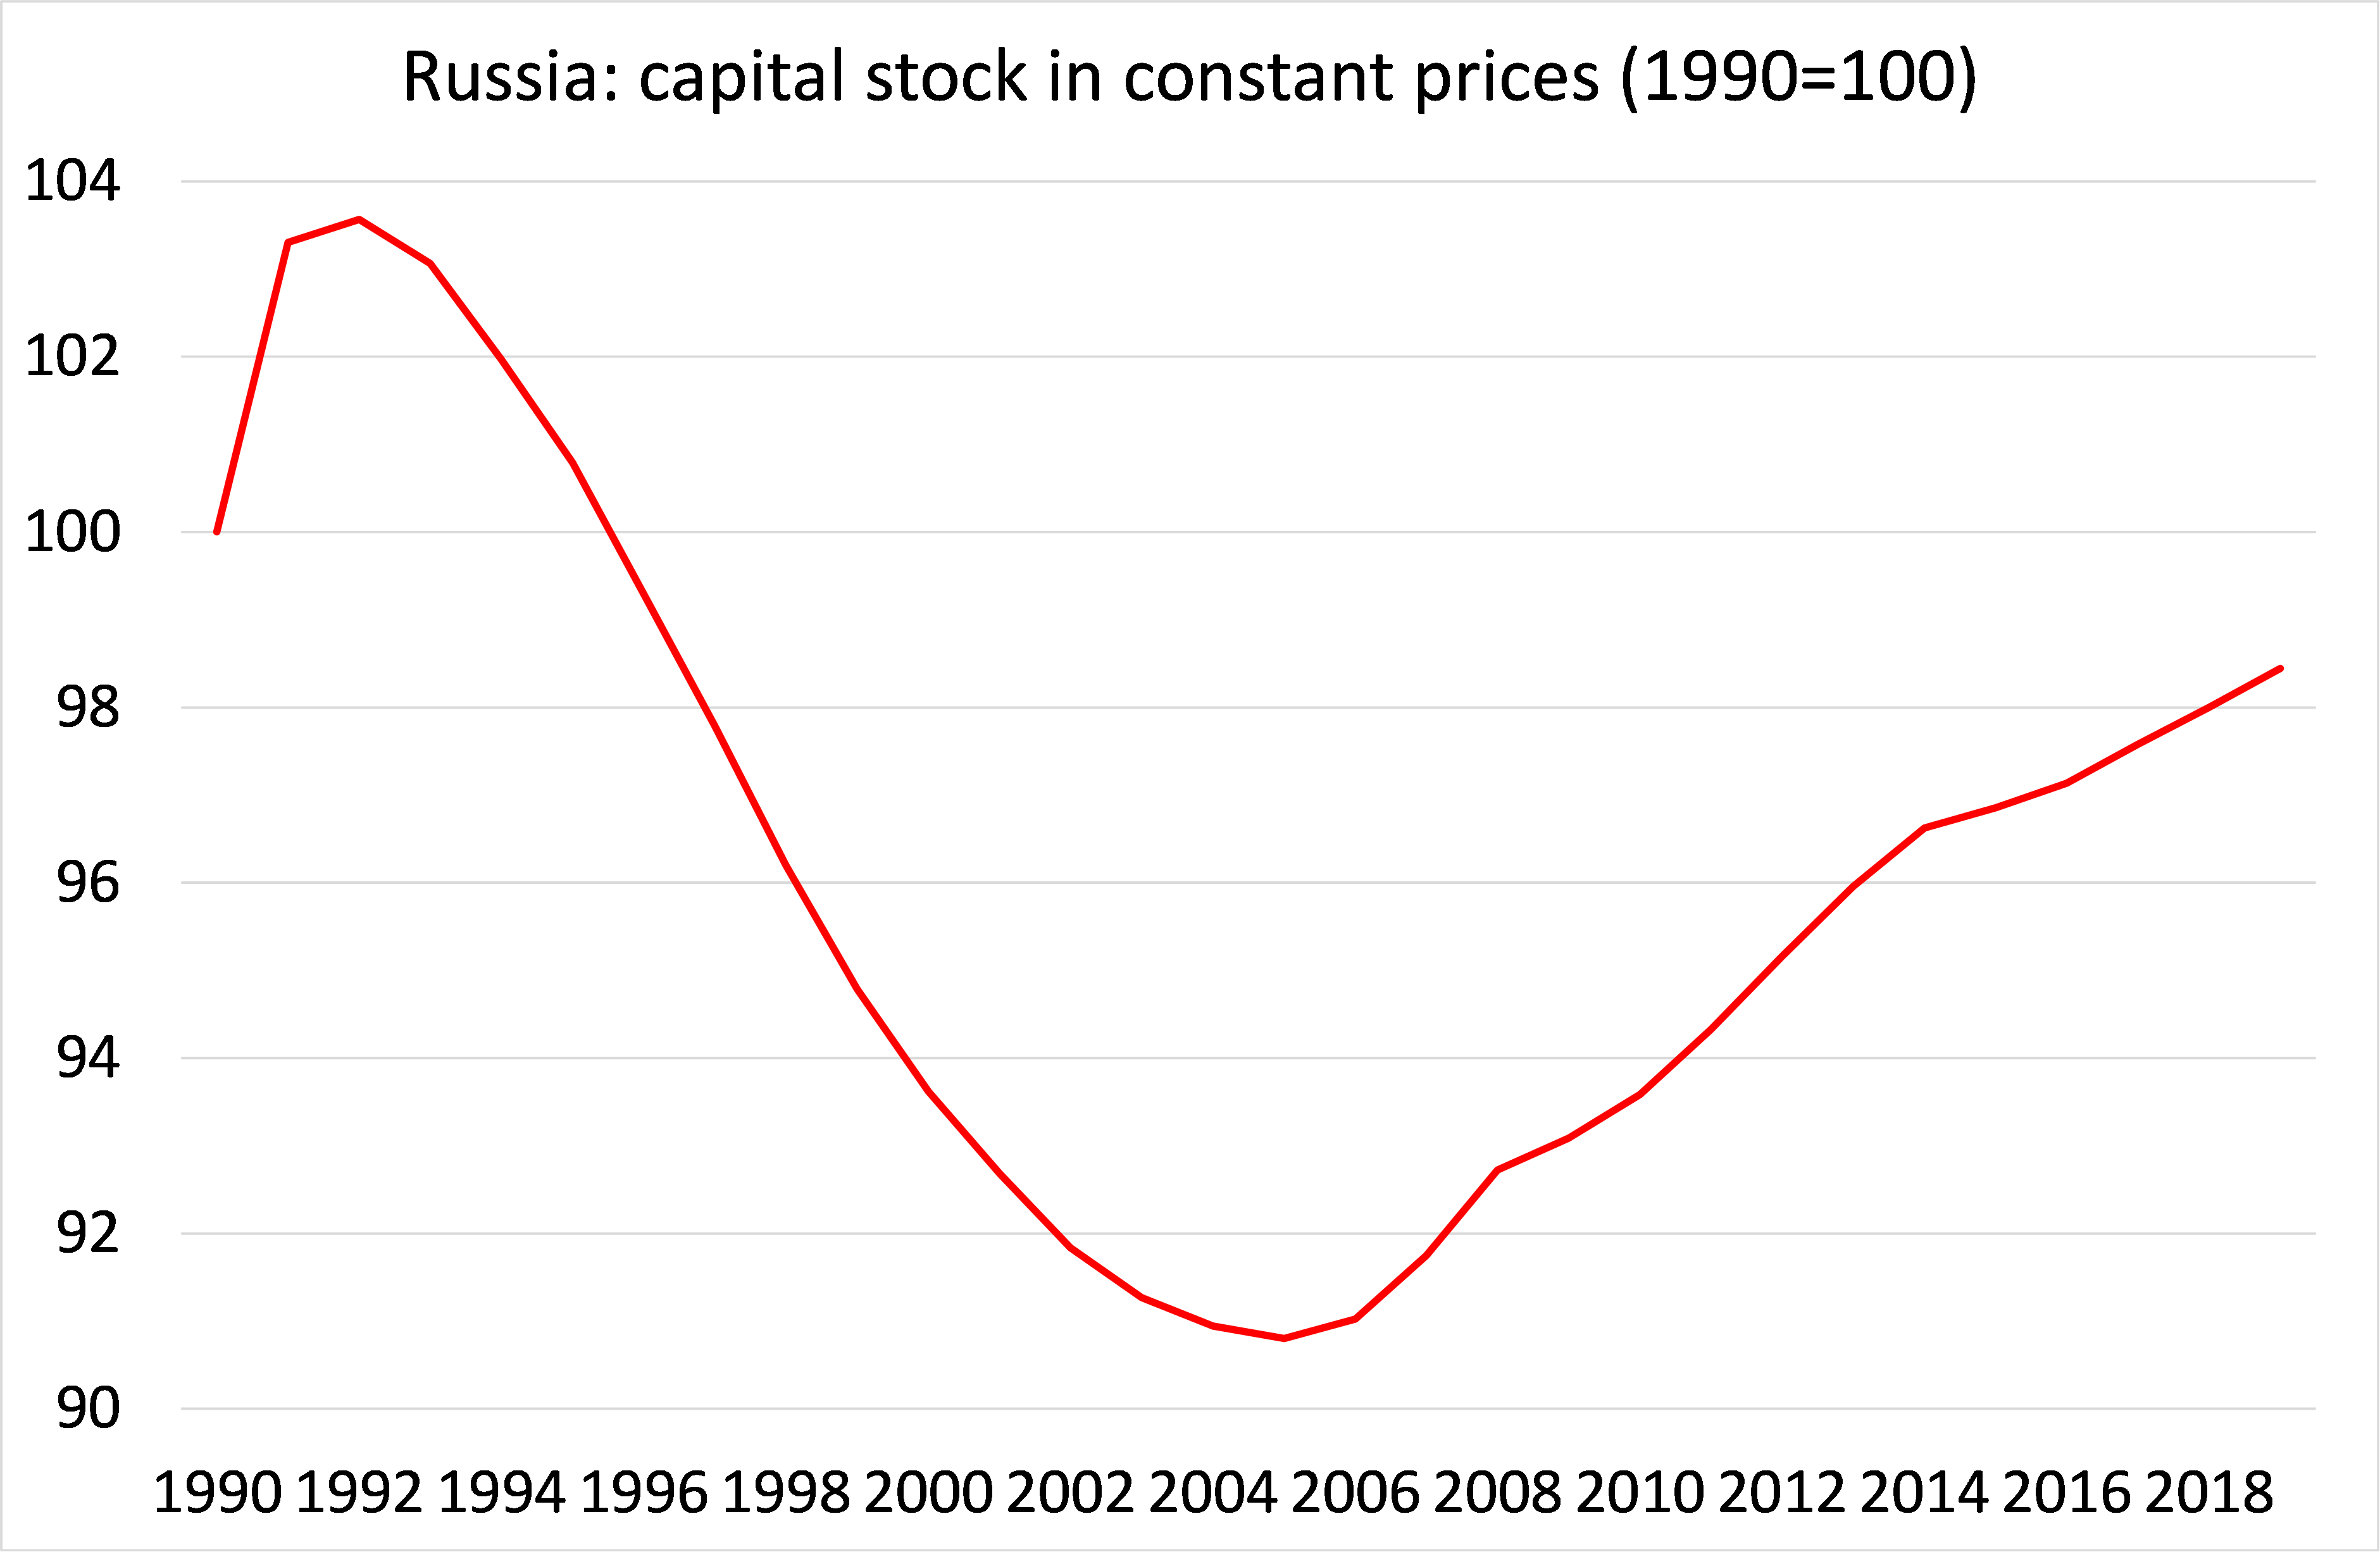
The Russian economy is a ‘one-trick’ pony, relying mostly on energy and natural resources exports. After a short boom from rising energy prices from 1998 to 2010, the economy has basically stagnated. Although Russia’s economy is larger than it was in 2014 in real terms, final domestic demand is still at its pre-2014 level. And cumulative GDP growth over this period was only positive because exports were 17% higher in real terms in 2019 than in 2014. Russia’s capital stock is still lower in real terms compared to 1990, while the average profitability of that capital remains very low.
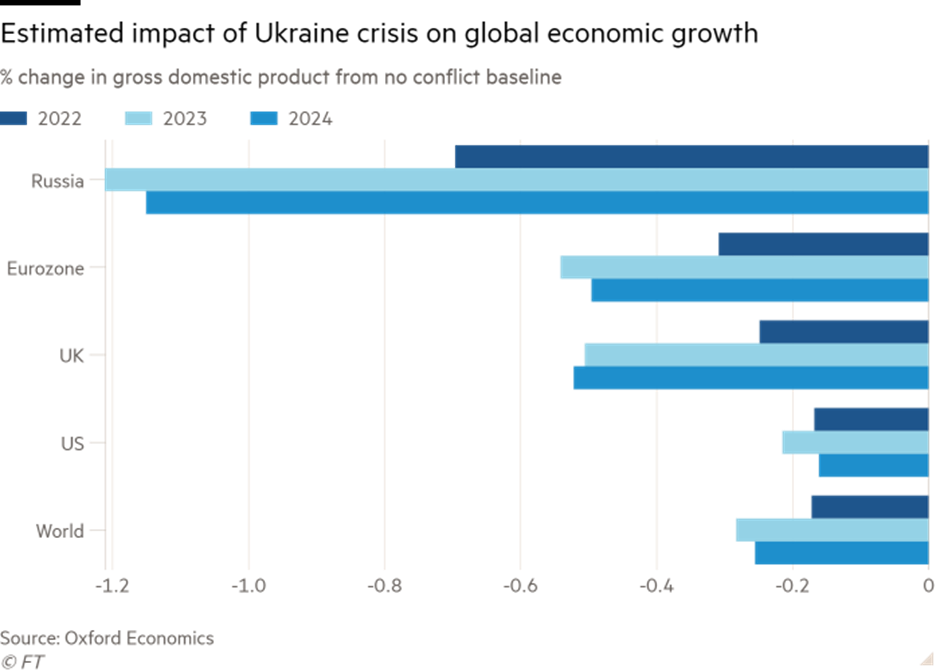
The World Bank reckons that the long-term potential real GDP growth rate for Russia is just 1.8% a year – and even that is faster than it has achieved in the last decade. This war is going to be costly for Russia and its people. Oxford Economics reckons it will knock at least 1% pt a year in real GDP growth over the next few years. If that happens, basically Russia will be in economic recession for several years.
Of course, much depends on how the war pans out. If Putin can gain control of Ukraine, that opens up significant riches to be exploited. Ukraine is rich in natural resources, particularly in mineral deposits. It possesses the world’s largest reserves of commercial-grade iron ore—30 billion tonnes of ore or around one-fifth of the global total. Ukraine ranks second in terms of known natural gas reserves in Europe, which today remain largely untapped. Ukraine’s mostly flat geography and high-quality soil composition make the country a big regional agricultural player. The country is the world’s fifth-largest exporter of wheat and the world’s largest exporter of seed oils like sunflower and rapeseed. Coal mining, chemicals, mechanical products (aircraft, turbines, locomotives and tractors) and shipbuilding are also important sectors of the Ukrainian economy.
All of this remains to be fully exploited. The EU and the US have also been drooling over the prospect of getting hold of these resources. As I showed in my last post, the Ukraine government plans to sell off huge tracts of land to foreign and domestic investors to develop. That could deliver huge dividends to whichever power controls the country. Either way, once the war is over and after thousands have been killed or injured, Ukraine’s people will see little of the benefit.
February 23, 2022
The wealth of nations
Marx’s first sentence in Capital Volume One is: “The wealth of those societies in which the capitalist mode of production prevails, presents itself as an “immense accumulation of commodities”, its unit being a single commodity.” (Moore and Aveling translation). So, from the beginning, Marx makes a distinction between wealth in societies and how it appears in the capitalist mode of production. And in Grundrisse, Marx explains what he means by ‘wealth’: “when the limited bourgeois form is stripped away, what is wealth other than the universality of human needs, capacities, pleasures, productive forces etc., created through universal exchange? The full development of human mastery over the forces of nature, those of so-called nature as well as of humanity’s own nature?” (p488).
For the pioneer of capitalist economics, Adam Smith, the wealth of nations is to be found in the accumulation of commodities. But for Marx, wealth is more than just a collection of commodities owned by capital and valued in money. That is the form that wealth takes under capitalism. Wealth is the accumulation of products and activities that meets human needs; ie the accumulation of use values. And those use values include natural resources as well as the products of human labour.
Under capitalism, the meaning and substance of wealth is restricted to the value of commodities produced for sale and profit, accumulated as capital and measured in money -the universal measure of human labour time involved in commodity production. This meaning of wealth excludes human social needs as well as the impact on wealth from environmental degradation, pollution, exploitation and inequalities. These are not accounted for the capitalist accumulation of private wealth. Because of that, capitalist economies are not only destructive and wasteful; capitalism is unfit for the purpose of delivering real wealth to humanity.
Global warming, climate change, environmental disasters have become so serious that the contradiction between capital and wealth accumulation has become obvious. This has forced even mainstream economics to consider ways of measuring ‘wealth’ as opposed to the production of value (GDP) and its accumulation into capital.
Recently, the World Bank has tried to measure wealth. In its latest report, The changing wealth of nations 2021, it provides an analysis of the world’s wealth accounts spanning 146 countries, with annual data from 1995 to 2018. It also contains the widest set of assets covered so far, including the value of human capital broken down by gender, as well as many different forms of natural capital, spanning minerals, fossil fuels, forests, mangroves, marine fisheries, and more. Even so, the Bank’s analysis remains inadequate, leaving out the impact of climate change, the social impact of carbon emissions from fossil fuels and, as the report adds, “economic sustainability is not the same as human well-being.”
The Bank defines global wealth as ‘produced capital’ (the means of production, machinery, computers etc), renewable and non-renewable natural capital (the land, forests, water, mineral resources etc);, ‘human capital’ (what Marx called human labour power), and net foreign assets held by each nation.

Wealth (as the Bank defines it – MR), like GDP, “is intended to represent material well-being, not broader human well-being.” The Bank considers the contradiction. While “wealth accounting—the balance sheet for a country—captures the value of all the assets that generate income and support human well-being. Gross domestic product (GDP) indicates how much monetary income or output a country creates in a year; wealth indicates the value of the underlying national assets and therefore the prospects for maintaining and increasing that income over the long term.” So the Bank considers GDP and wealth as “complementary indicators for measuring economic performance and provide a fuller picture when evaluated together. By monitoring trends in wealth, it is possible to see whether GDP growth is achieved by building capital assets, which is sustainable in the long run, or by liquidating assets, which is not. Wealth should be used alongside GDP to provide a means of monitoring the sustainability of economic development.” If rising GDP today comes at the expense of declining wealth per capita, then prosperity will be unsustainable. Economic growth will erode its own base. So the measure of the change in wealth per capita over time is perhaps the most important metric to consider in addition to GDP and, according to the Bank, it provides an actionable way to track sustainability.
And what does the Bank find on that? That “our material well-being is under threat: from unsustainable exploitation of nature, from mismanagement and mispricing of the assets that make up national wealth, and from a lack of collective action at local, national, and regional levels.” Despite a global expansion in total wealth per capita between 1995 and 2018, many countries are on an unsustainable development path because their natural, human, or produced capital is being run down. In countries where GDP growth is being achieved by consuming or degrading assets over time, for example by overfishing or soil degradation, total wealth is declining.
Global total wealth grew significantly between 1995 and 2018. Global wealth grew 91 percent from 1995, reaching US$1,152 trillion by 2018. All income groups saw increasing total wealth and per capita wealth over the period. The strongest performance was found among upper-middle-income countries, which had increases in wealth of over 200 percent between 1995 and 2018. Low-income countries saw per capita wealth growth by less than the global average, at 22 percent compared with 44 percent. Between 1995 and 2018, low-income countries’ share of global wealth increased only from 0.5 to 0.6 percent.
The performance of lower middle-income countries was better, increasing in share from 5 to 7 percent by 2018. But this cohort only achieved this because of one country: China. China’s share of global total wealth transformed from a modest 7 percent in 1995 to 21 percent by 2018. The Bank concludes “This means that low-income countries are falling further behind the rest of the world, creating a significant divergence in global wealth per person.” This further proof that there is no ‘convergence’ between rich and poor countries globally and that imperialism is still with us.

That’s the share of global wealth (as defined). But more important is what happened to wealth per person globally? On a per capita basis, average wealth grew from US$111,174 to US$160,167. This represents a real rate of growth of 2 percent per year. But 26 countries saw a decline or stagnation in per capita wealth as population growth outpaced net growth in asset value, especially in Sub-Saharan Africa.

Over time, population growth affects per capita wealth, especially in low- and lower middle-income countries. Between 1995 and 2018, global wealth grew by 91 percent, but population grew by 32 percent, so that the net increase in per capita wealth was only 44 percent. Per capita wealth grew fastest in middle-income countries, raising their share of global wealth, but the largest growth occurred in upper-middle-income countries (at 179 percent), in part because of China. Low-income countries increased their total wealth by nearly 132 percent—more than high-income OECD countries or the global average—but only by 22 percent on a per capita basis because population growth was highest in those countries.
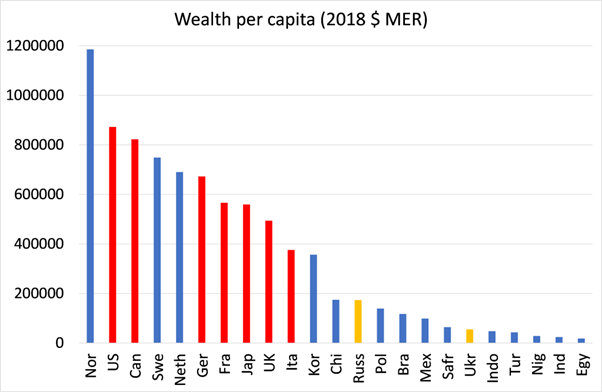
Large disparities in per capita wealth around the world persist. On average, an individual in an OECD country was implicitly endowed with US$621,278 in wealth at birth in 2018. For an individual born in a low-income country, the estimate was just US$11,462. I did a little exercise on comparing wealth per capita between various countries using the World Bank results.

Source: World Bank Changing Wealth of Nations 2021, p94
The graph above shows the wealth per capita for various countries as measured by the World Bank. I have highlighted in red the G7 economies. You can see that the average wealth per capita in those countries is some six times larger than the selected so-called ‘emerging economies’ in this graph. And the latter includes China. The divergence in wealth (as defined) between the imperialist bloc and the rest is huge. For topicality, I included Russia and Ukraine. The US wealth per capita is five times larger than Russia, while in turn Russia’s wealth per capita is over three times larger than Ukraine – perhaps a measure of the relative strength of each country in the world order.
The measure above is in market dollar exchange rates (MER). The World Bank also measures wealth per capita in purchasing power parities (PPP), which supposedly provides a better measure of what can be purchased in each country with the wealth available. This produces higher wealth per capita results for some poorer nations. But it does not significantly alter the overall trends. So I have not done a PPP comparison (although the report does). Also, the MER measure is, in my view, a better international comparison measure of the economic strengths of countries relative to the US.
When we look at the composition of wealth as defined by the Bank (natural resources; human labour power; means of production and net financial assets), there are more revealing facts. Human capital remains the most important component of wealth. Its share in total wealth increased from 62 percent in 1995 to 64 percent in 2018. Produced capital’s share decreased from 32 to 31 percent. But note that produced capital (means of production) is largest as a share of wealth in the advanced capitalist economies. Natural capital represented just 6 percent of total global wealth in 1995 and 2018. This share was equally divided between renewable and non-renewable natural capital (3 percent each) in 2018 at the global level.

Because low-income countries have so few other assets, proportionately, natural assets such as land and ecosystems are crucial for them, comprising around 23 percent of their total wealth. ‘Blue’ natural capital (mangroves and marine capture fisheries) are a critical part of total wealth for some countries. But blue natural capital fell by half from 1995 to 2018, as the value of fisheries collapsed by 83 percent. The main reason for the decline in the value of fisheries is a physical depletion of fish stocks “due to the failure to coordinate fishing activities between countries and the private sector.”
Low- and middle-income countries, where land accounts (forests, protected areas, and agricultural lands) are a large component of total wealth, have seen declining forest wealth but rising agricultural wealth. While forest wealth (timber plus ecosystem services) per capita decreased by 8 percent between 1995 and 2018, driven by population growth and a loss of forest area, agricultural land wealth (cropland plus pastureland) per capita has increased by 9 percent due to area expansion and increasing value per square kilometre. Industrial farming is replacing natural resources.
The Bank measures ‘human capital’ (as the Bank wants to call it in true capitalist fashion) as the value of earnings over a person’s lifetime. Self-employed workers account for 13 percent of global human capital, but a much larger share of the total in many low-income countries, where the agriculture sector and informal employment are significant. The slower annual wage growth in high-income countries (roughly 1 percent), combined with the aging of the labour force, reduces their share of global human capital. Meanwhile, higher rates of wage growth in some middle-income countries ie China (up to 4 percent) increases their relative share.
However, the World Bank admits that “Although the full, long-lasting effects of the COVID-19 pandemic are still unknown, the resulting economic downturn and associated unemployment and loss of earnings have already set back the long-term progress in poverty reduction, especially in low-income countries.” Sub-Saharan Africa and South Asia suffered the greatest setbacks, losing 15 and 7 percent of human capital.
There are huge gaps in the World Bank’s measure of ‘wealth’. It does not include the value of carbon retention or sequestration services as part of wealth embedded in biological ecosystems (for example, forests, soils, and oceans). Nor does it subtract the social cost of carbon from fossil fuels.
How can the wealth divergences globally be closed and how can the growing disaster of climate change and environmental degradation be averted? The World Bank’s answer is the conventional mainstream one. Having told us that the production of commodities for the market is not a proper reflection of wealth in society, it proceeds to offer market solutions to this contradiction. “Going forward, policy interventions—such as carbon taxes and payments for ecosystems services—are urgently needed to make market prices explicitly reflect the social cost of carbon dioxide emissions and the value of global climate regulation services provided by nature.” And it promotes the private sector as the funding source of policy action, arguing for “major progress on incorporating ESG considerations into investing choices.” This is ironic when the evidence of the failure of ‘ethical investing’ is growing by the day.
The World Bank sums up the issue. “Natural and human capital are therefore at the core of our prosperity, but few of these assets are accounted for in the national balance sheets and hence appear invisible or worthless to policy makers. When we think of wealth, most of us might think about financial assets, or companies, computers, and cars. But what about forests, mangroves, water, fish, or clean air? What about healthy people and their capacity for productive work? And can we cooperate when the challenges in managing our prosperity transcend national boundaries?”
February 19, 2022
Inflation: supply or demand?
The debate among economists continues on whether the recent hike in inflation rates in the major economies is due to a ‘supply shock’ or ‘pent-up consumer demand’; and related to that, whether the inflation rise will be ‘transient’ or ‘permanent’.
Supply or demand? If prices rise, is it because supply is not rising ‘enough’ or demand is rising ‘too much’? That’s like the chicken and egg argument. There is an answer to that conundrum. After all, the chicken came first. Chickens evolved from previous species; their eggs simply reproduce more chickens.
Similarly, I would argue that prices and price changes are determined by changes in supply. Or more precisely by the value of and changes in the value of commodities produced. Value determines price at the highest level of abstraction. Demand for commodities follows from the value produced and takes the form of money earned by workers (wages) and appropriated by capitalists (profits).
In a capitalist economy, the price and value of an individual commodity can diverge. Money is the representation of value but when money is not in the form of another commodity like gold, then non-commodity money can diverge from the value of the money commodity; and prices do not then match the value in commodities. Prices in a modern monetary economy are determined by the supply of value embodied in their production and by the supply of non-commodity money. So price inflation is supply-driven. Demand for commodities is determined by the combined purchasing power of workers wages and capitalist profits – if you like, these are the eggs produced by the chicken of value production. These eggs are necessary for the production of more value (more chickens), but they are still the result of previous chickens’ supply.
Where does this meandering on my part takes us? In my view, it helps explain the causes of the current inflation rises. The COVID pandemic slump was clearly a ‘supply shock’. Production collapsed with lockdowns, workers were sent home or into hospital, transport and trade shuddered to a halt; social activity and events were replaced by isolation. That then reduced demand, even though in the advanced capitalist economies, a major section of workers continued to get paid or got government handouts.

So household savings rose significantly during the slump of 2020.
US household savings as % personal disposable income
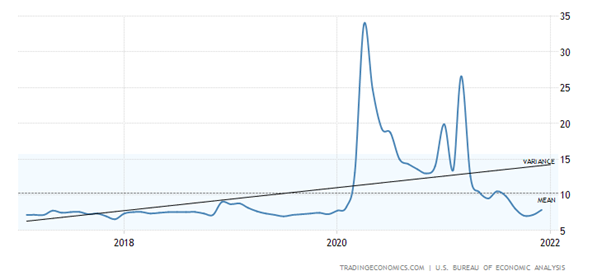
This has led some to argue that these savings are ‘pent-up demand’ released in the year of vaccinations and economic recovery in 2021 and this created ‘excessive demand’ that caused the rise in the prices of goods and services – with inflation rates not seen for over 40 years.
There is undoubtedly some truth in this explanation. But the ‘pent-up demand’ was the result of the previous supply shock and price rises have accelerated only because ‘pent-up supply’ has not followed. Also, much of the savings build-up was among the richer income groups, who could work from home and not spend much; unlike those in ‘essential’ services and transport and retail who are generally paid less and had to go to work.
Higher-income households and retirees are more likely to have increased their savings during Covid
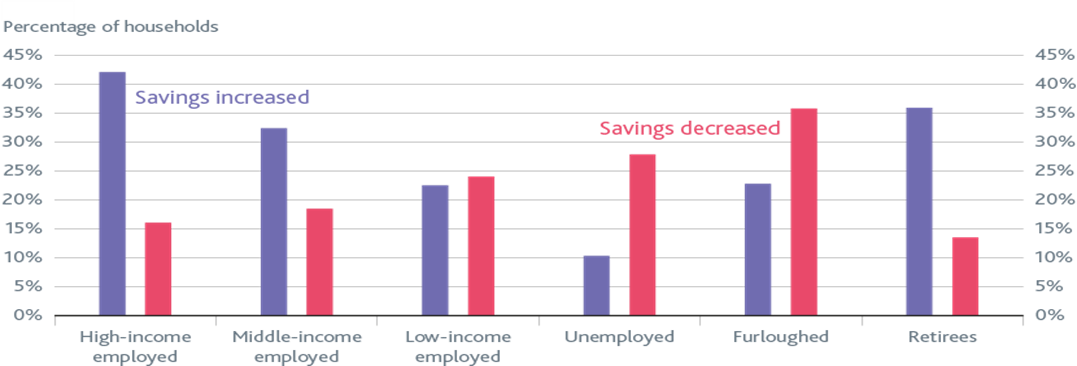
So any increase in consumer spending is limited because those at the top of the income pyramid tend to save more than those at the bottom. Indeed, savings rates are back to ‘normal’ now.
IMF economists have just released a paper that aims to measure the relative contributions of supply and demand to rising inflation in 2021. Globally, the economists reckon that “close to half of that upward swing (in inflation) came from the change in the supply shock component, which had mostly exerted downward pressure on manufactured-goods prices in the pre-pandemic years. The share attributable to supply shocks varies across individual countries; it is estimated at about half for the euro area, 60 percent for Germany and 45–50 percent in the United States and the United Kingdom, and about 40 percent for France and Italy”. Note the impact of supply shocks in Mexico and Japan.

I would argue that this supply-side ‘shock’ is really a continuation of the slowdown in industrial output, international trade, business investment and real GDP growth that had already happened in 2019 before the pandemic broke. That was happening because the profitability of capitalist investment in the major economies had dropped to near historic lows, and as readers of this blog know, it is profitability that ultimately drives investment and growth in capitalist economies.
If rising inflation is being driven by a weak supply-side rather than an excessively strong demand side, monetary policy won’t work. Monetary policy supposedly works by trying to raise or lower ‘aggregate demand’, to use the Keynesian category. If spending is growing too fast for production to meet it and so generating inflation, higher interest rates supposedly dampen the willingness of companies and households to consume or invest by increasing the cost of borrowing. But even if this theory were correct (and the evidence does not support it much), it does not apply when prices are rising because supply chains have broken, energy prices are increasing or there are labour shortages. As Andrew Bailey, governor of the Bank of England, said: “Monetary policy will not increase the supply of semiconductor chips, it will not increase the amount of wind (no, really), and nor will it produce more HGV drivers.”
Nevertheless, the monetary authorities and mainstream Keynesian economists continue to emphasise ‘excessive demand’ as the main cause of inflation. The hardline monetarists thus call for sharp rises in interest rates to curb demand while the Keynesians worry about wage-push inflation as rising wages ‘force’ companies to raise prices. As FT columnist and Keynesian Martin Wolf puts it “What [central bankers] have to do is prevent a wage-price spiral, which would destabilise inflation expectations. Monetary policy must be tight enough to achieve this. In other words, it must create/preserve some slack in the labour market.” In other words, the task must be create unemployment to reduce the bargaining power of workers. Full employment and wage increases are to be opposed. Wolf and BoE governor Bailey claim this is to stop runaway inflation. In reality, it is to preserve profitability.
As I have shown in previous posts, there is no evidence that wage rises lead to higher inflation. We are back to the chicken and the egg. Rising inflation (chicken) forces workers to seek higher wages (egg). Indeed, over the last 20 years until the year of the COVID, US real weekly wages rose just 0.4% a year on average, less even that the average annual real GDP growth of around 2% . It’s the share of GDP growth going to profits that rose (as Marx argued way back in 1865).
Throughout the recovery period from the pandemic slump, it is prices that have outstripped wage rises. As former White House economist, Jason Furman has shown, during the pandemic, US real wages (even after including benefits) have been falling and are now well below the pre-pandemic level.
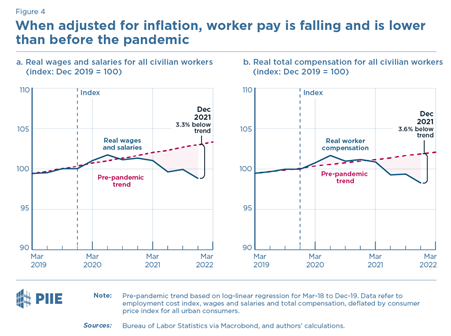
Researchers at the Dallas Fed agree. They found that “real wages have been falling over the last six months… even if they got (as indeed they did) real wage gains earlier in the expansion.”

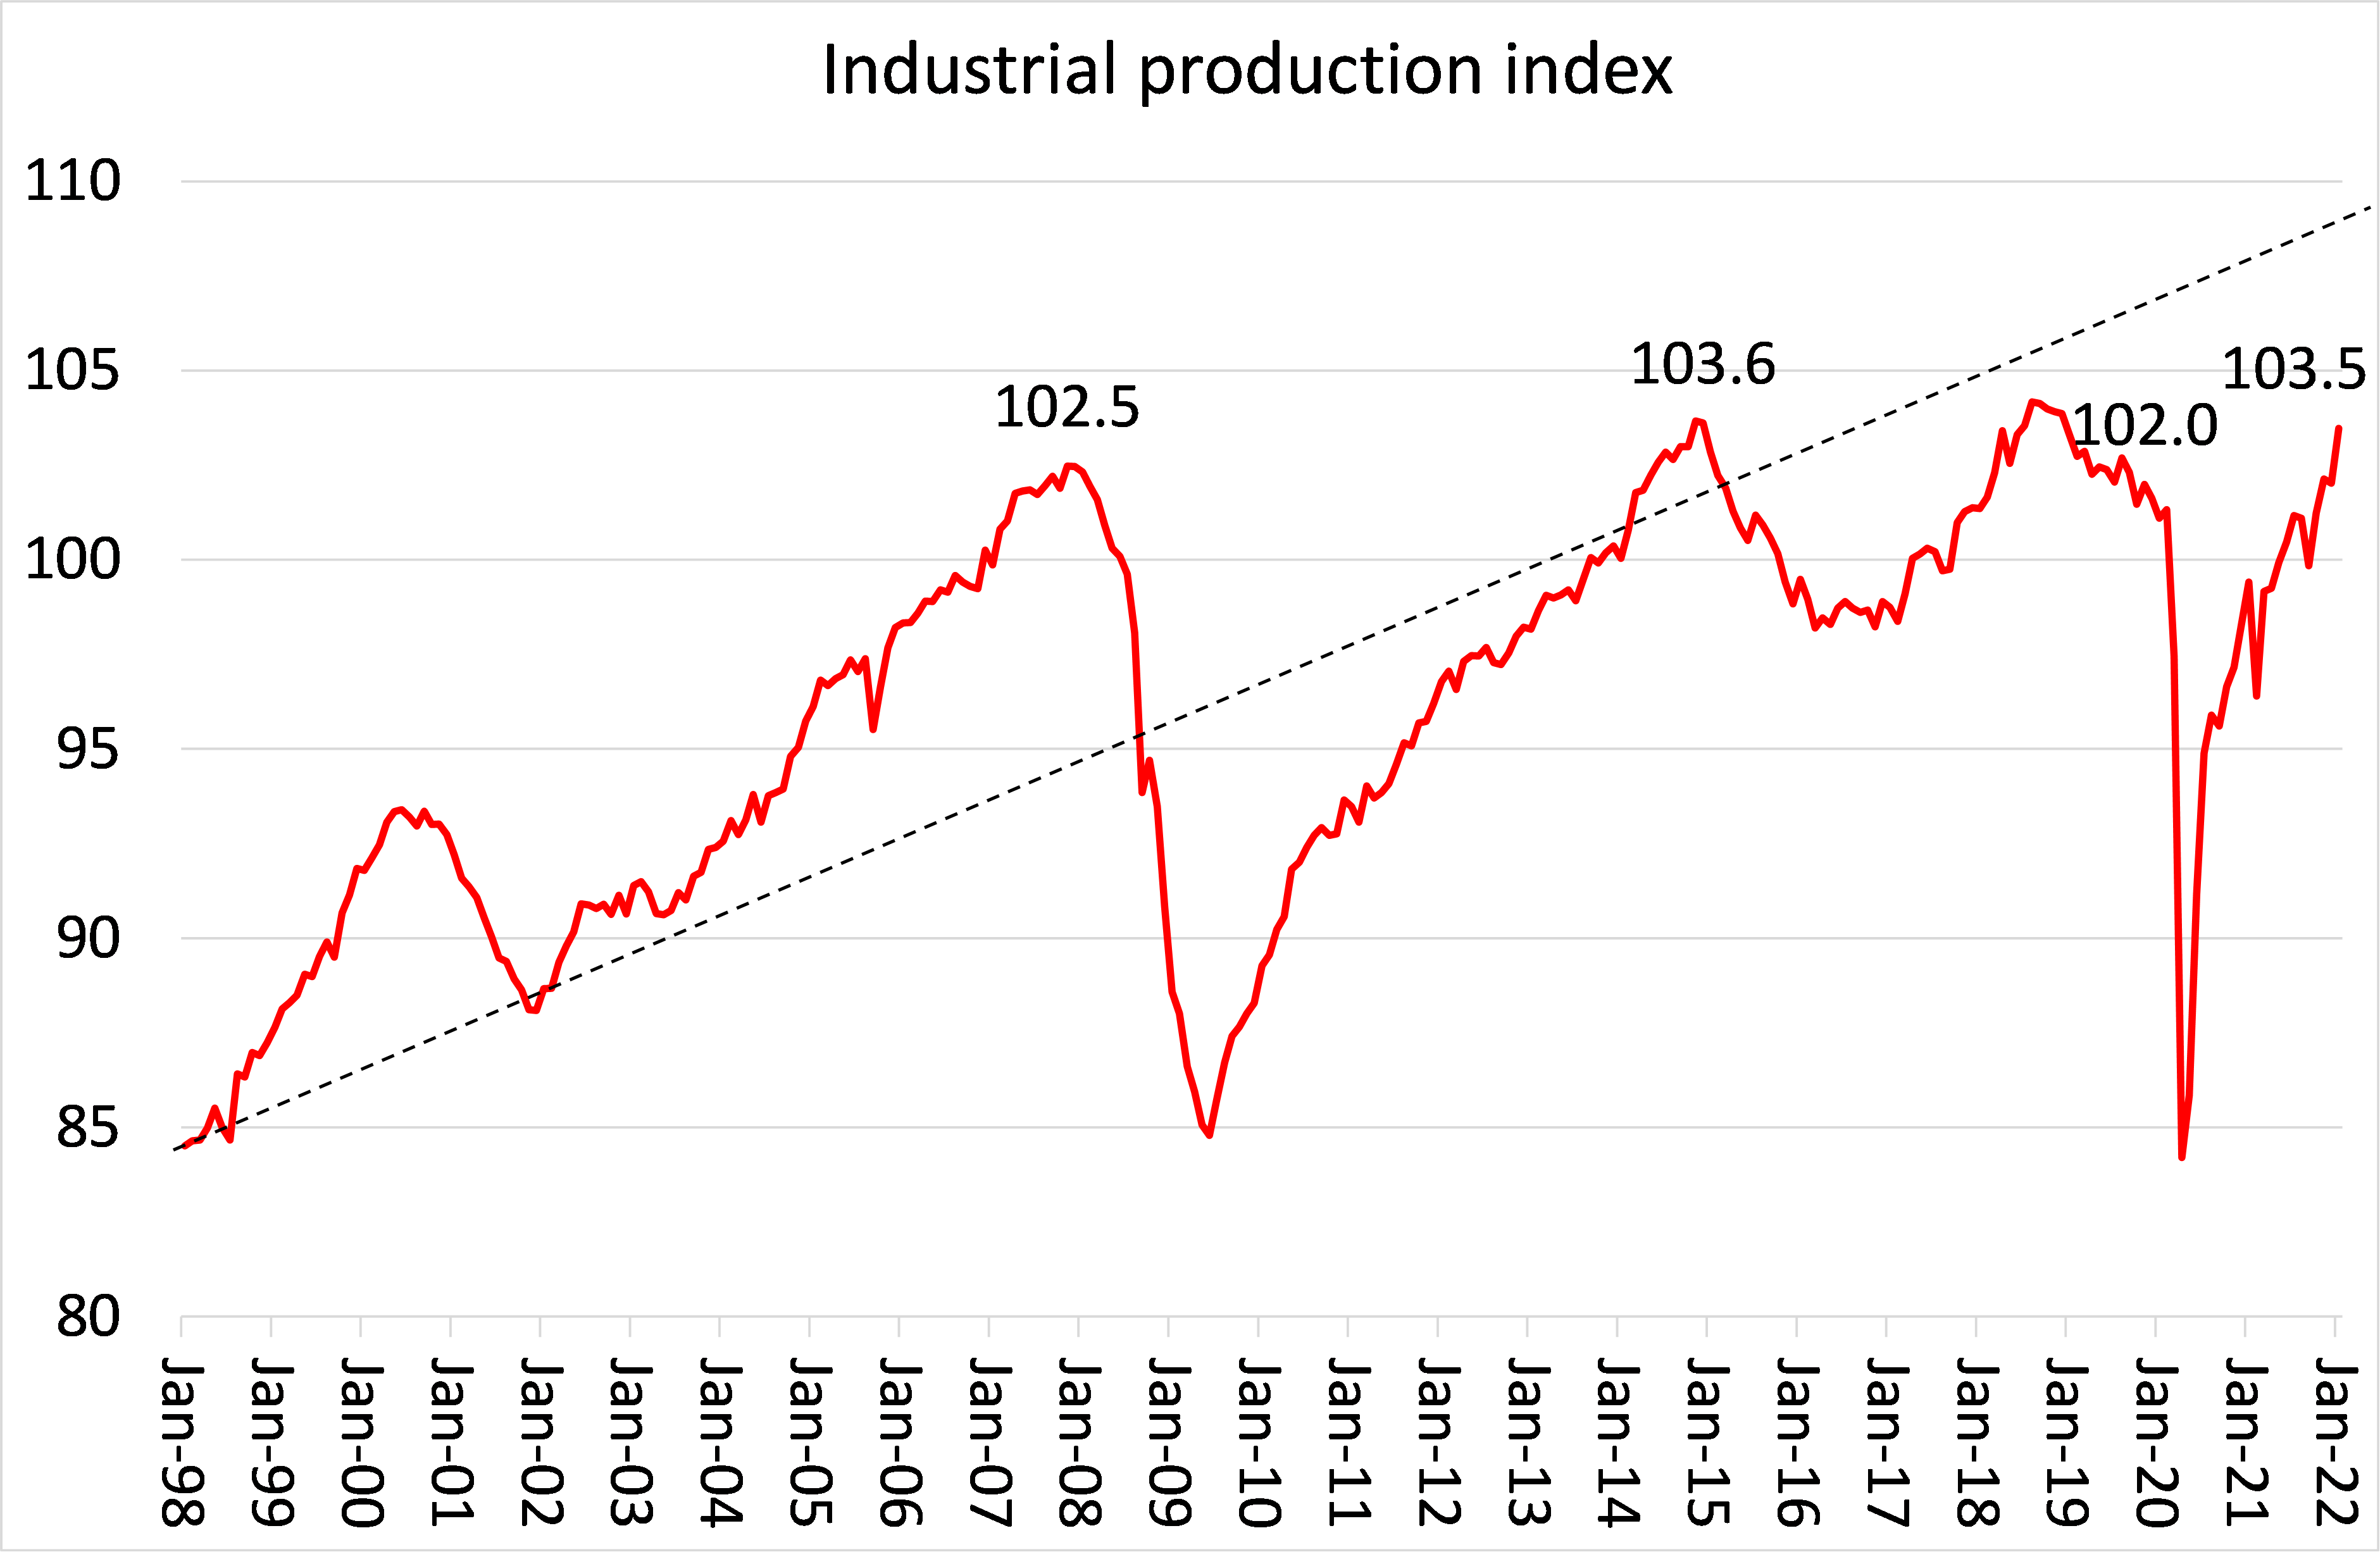
There are two other indicators that rising inflation rates are really due to supply ‘bottlenecks’ and not ‘excessive demand. First, industrial production (IP). In the US, the fastest recovering major economy, industrial output has jumped back in 2021 from the deep contraction of 2020. But the IP index is still no higher than seven years ago and only marginally higher than just before the Great Recession in 2008. The productive sectors of the US economy have been stagnating.
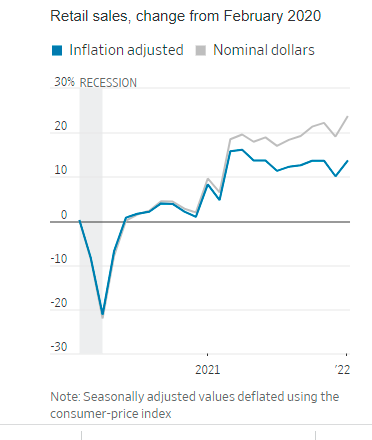
Then there is retail sales, supposedly a measure of consumer demand ,although retail sales cover only about 40% total consumer spending (leaving out spending on health, utilities and transport etc). The latest monthly figure for US retail sales was heralded as showing a dramatic boom in consumer spending. But when you account for inflation in food, energy and other retail goods, real spending was falling through 2021.
If rising inflation is really an indicator of weak supply and not strong demand, it means that monetary policy tightening (and the Fed is now planning sharp rises in its policy rate starting next month), will not curb inflation without pushing the US economy into stagnation or slump. There is a danger that the US economy is heading for a ‘Volcker moment’, when the Fed chief of the later 1970s hiked interest rates into double-digits to crush high inflation. That triggered a stock market ‘correction’ and the deep post-war recession of 1980-2. Just as now, profitability was at a post-war low, so the sharp rise in the cost of borrowing just led to a collapse in investment and eventually production.

Maybe the Fed will ‘chicken out’ of a Volcker move. If so, with supply remaining weak relative to demand, we can expect inflation rates to stay higher for longer.
February 14, 2022
Ukraine: trapped in a war zone
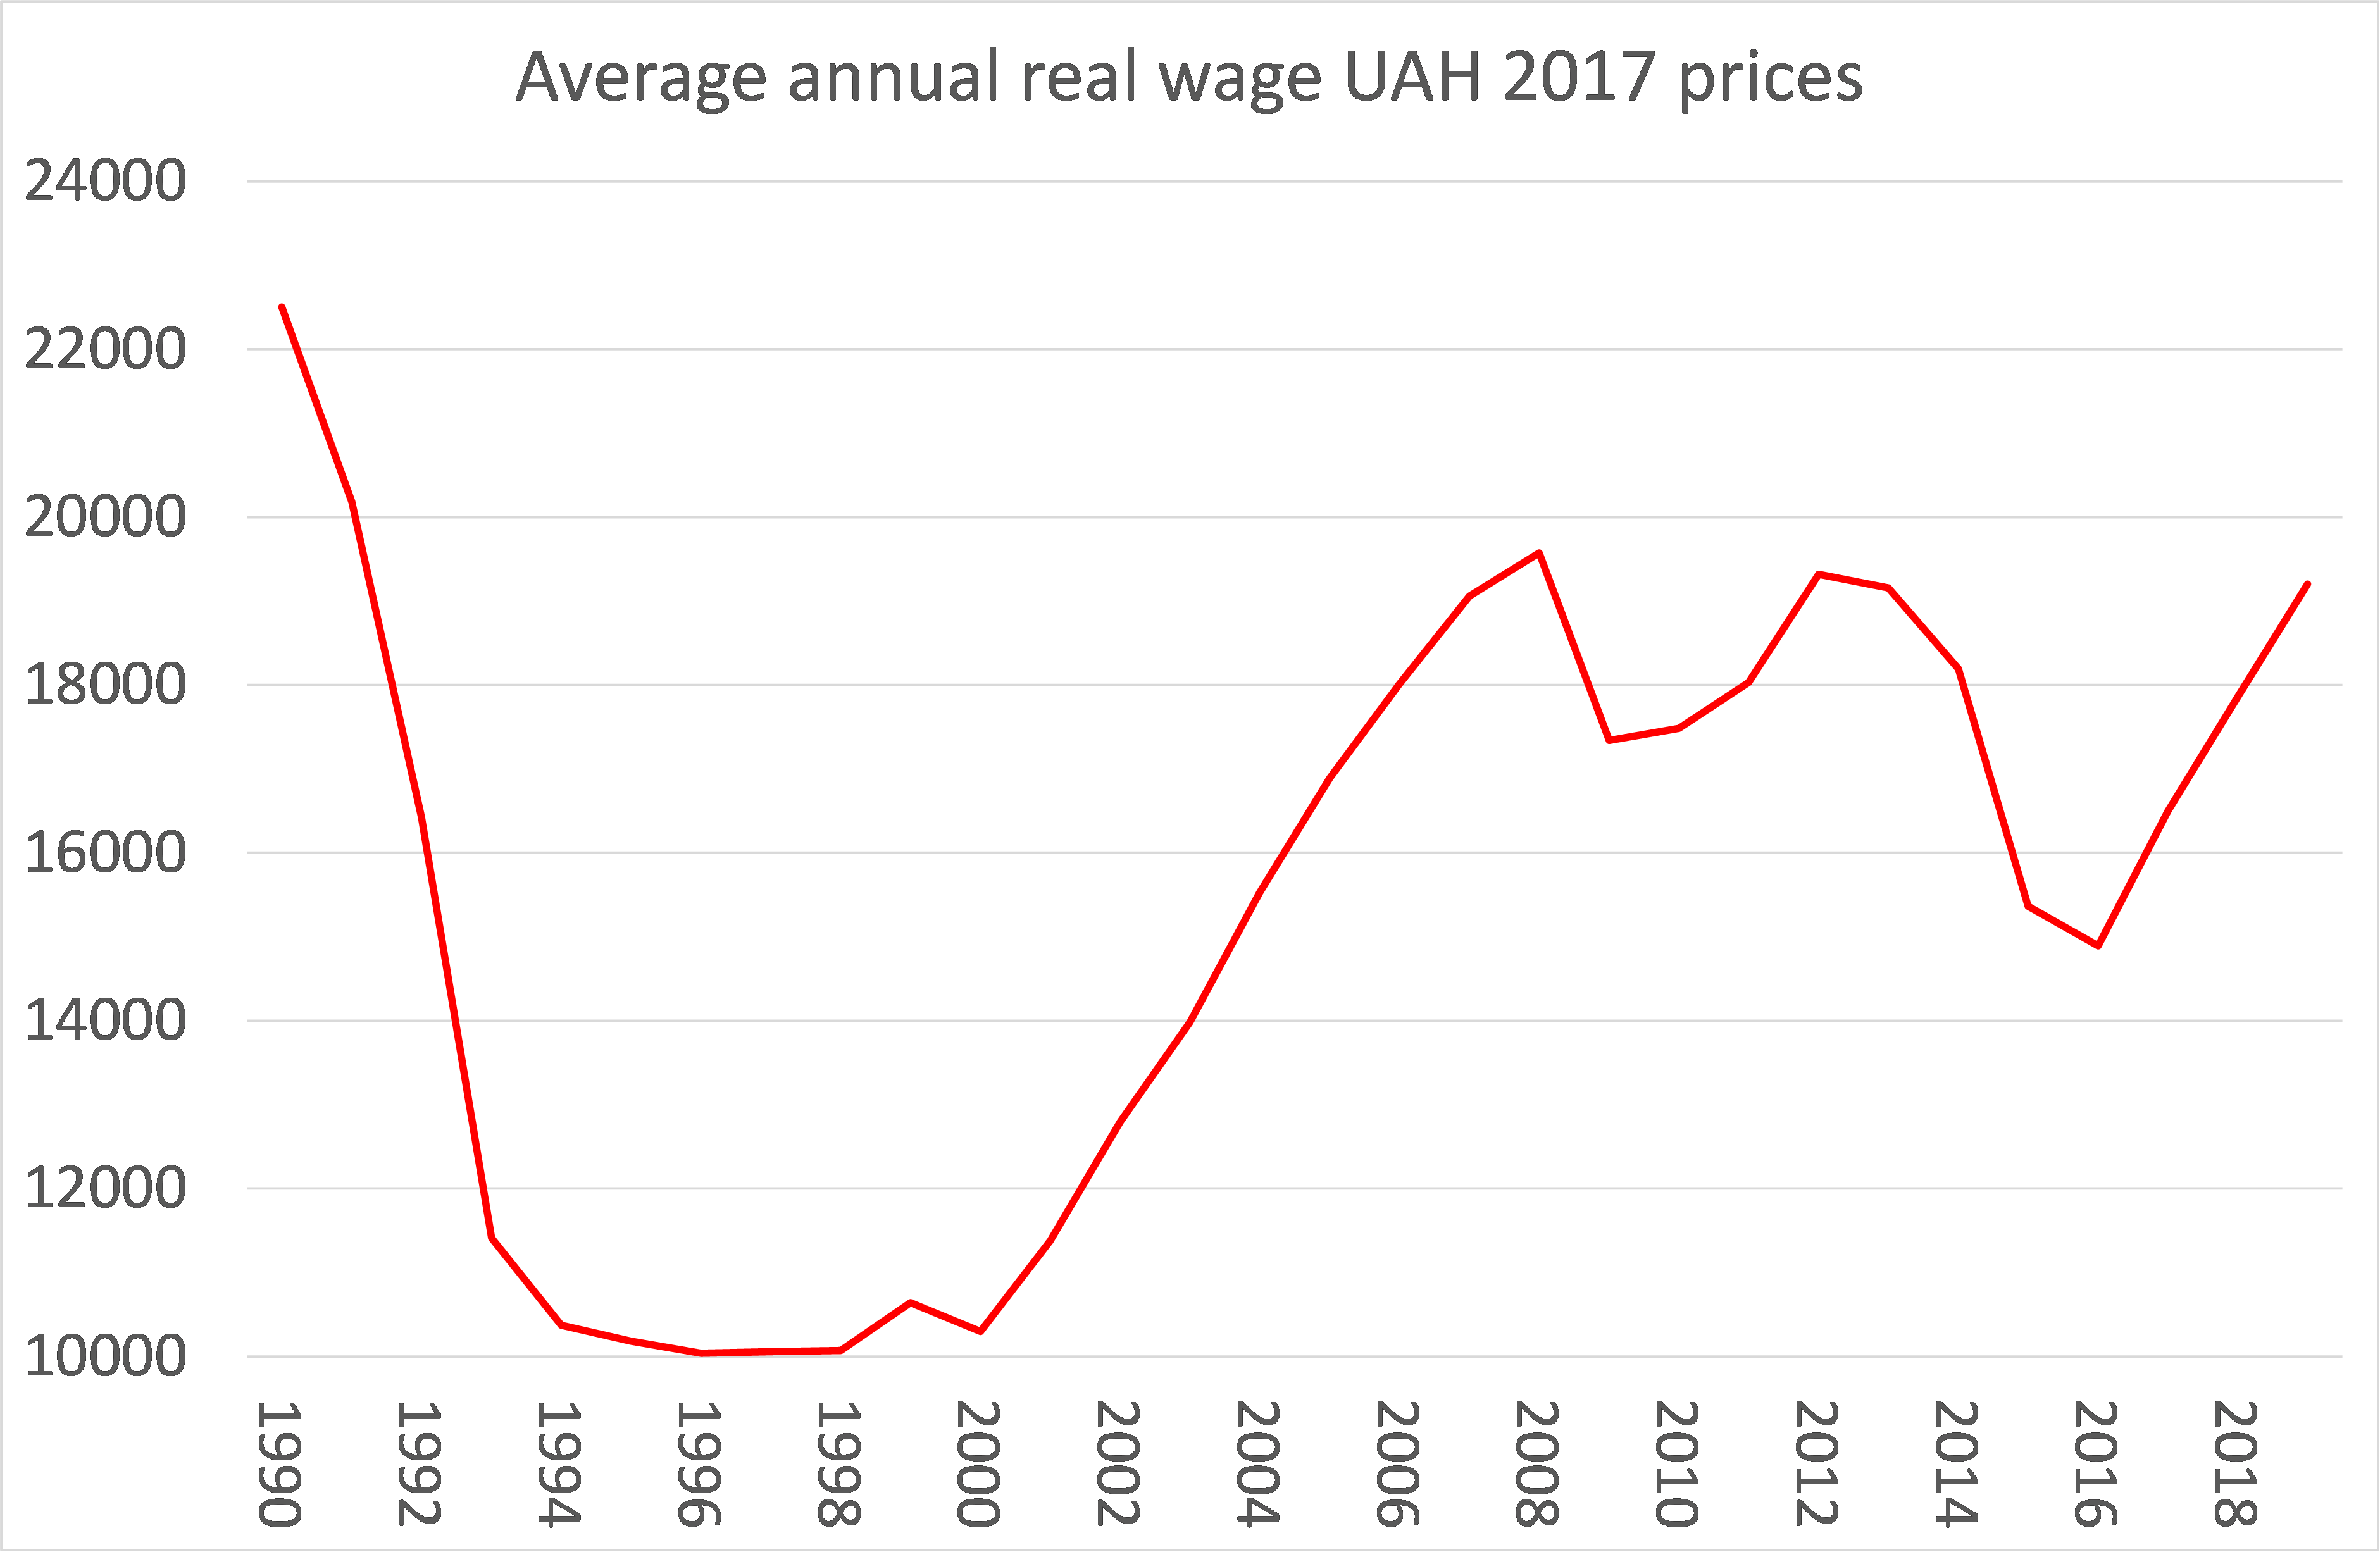
As the drums of war sound for Ukraine, what will be the impact on Ukraine’s economy and the living standards of its 44m population, whether war is avoided or not? I’ve posted on Ukraine several times before during the intense economic crisis that the country experienced in 2013-14 culminating in the collapse of incumbent government, the Maidan uprising and eventually the Russian annexation of Crimea and the predominantly Russian-speaking eastern provinces. The situation was dire for the people then. It improved a little for a while afterwards, but economic growth remains relatively low and living standards have stagnated at best. Average real wages have not risen in 12 years and collapsed severely after the 2014 crisis.
 Source: EWPT 7.0 series
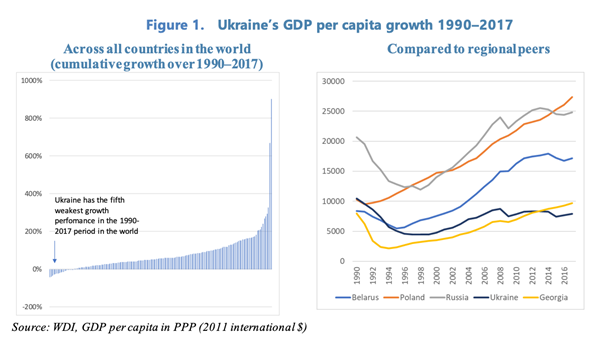
Ukraine was the hardest hit by the collapse of the Soviet Union and the ‘shock therapy’ of capitalist restoration in Eastern Europe and Russia itself. All the former Soviet satellites took a long time to recover GDP per head and income levels, but in the case of Ukraine it has never got back to the 1990 level. Ukraine’s performance between 1990 and 2017 was not just worse than its European neighbours. It was the fifth-worst in the entire world. Between 1990 and 2017 there were only 18 countries with negative cumulative growth and even in that select group, Ukraine’s performance puts it in the bottom third along with the Democratic Republic of Congo, Burundi and Yemen.
In the debt and currency crisis of 2014, Ukraine was saved from total meltdown by three things: first, it defaulted on its debt owed to Russia, which (despite much effort) Russia has not been able to recoup so far. Second, post-Maidan governments engaged in series of IMF bailouts; and third, the price for which was a severe programme of austerity in public services and welfare support. Ukraine owes Russia $3bn, or more than 10% of its FX reserves and if paid, would more than double Ukraine’s external financing gap. That gap is being currently filled by IMF funds, while Ukraine ‘negotiates’ with Russia on a ‘debt restructuring’, supposedly mediated by Germany. Ukraine, in breaking with Russian influence from 2014, has chosen to or been forced to rely on the ‘West’ and IMF credit to support its currency and hope for some economic improvement.
IMF handouts continue. The latest is an agreement to extend loans into 2022 worth $700m of a total $5bn IMF ‘stand-by arrangement’. For this money, Ukraine “must keep its debt ‘sustainable’, safeguard the central bank’s independence, bring inflation back into its target range and tackling corruption.” So austerity measures must be applied to public spending; the central bank must act in the interests of foreign debtors and not allow the currency to devalue too much and keep interest rates up without the interference of the government; and the rampant corruption in government with the Ukrainian oligarchs must be controlled. (see IMF Stand-by arrangement November 2021 report. )
Austerity measures have been applied by various governments over the last ten years. The current IMF package requires a tax increase equivalent to 0.5% of annual GDP, increased pension contributions and rises in energy tariffs. All these measures will lead to a further fall in welfare spending, from 20% of GDP at the time of the 2014 crisis to just 13% this year.
 Source: IMF
At the same time, government must resist any public sector wage rise to compensate for near double-digit inflation rates.
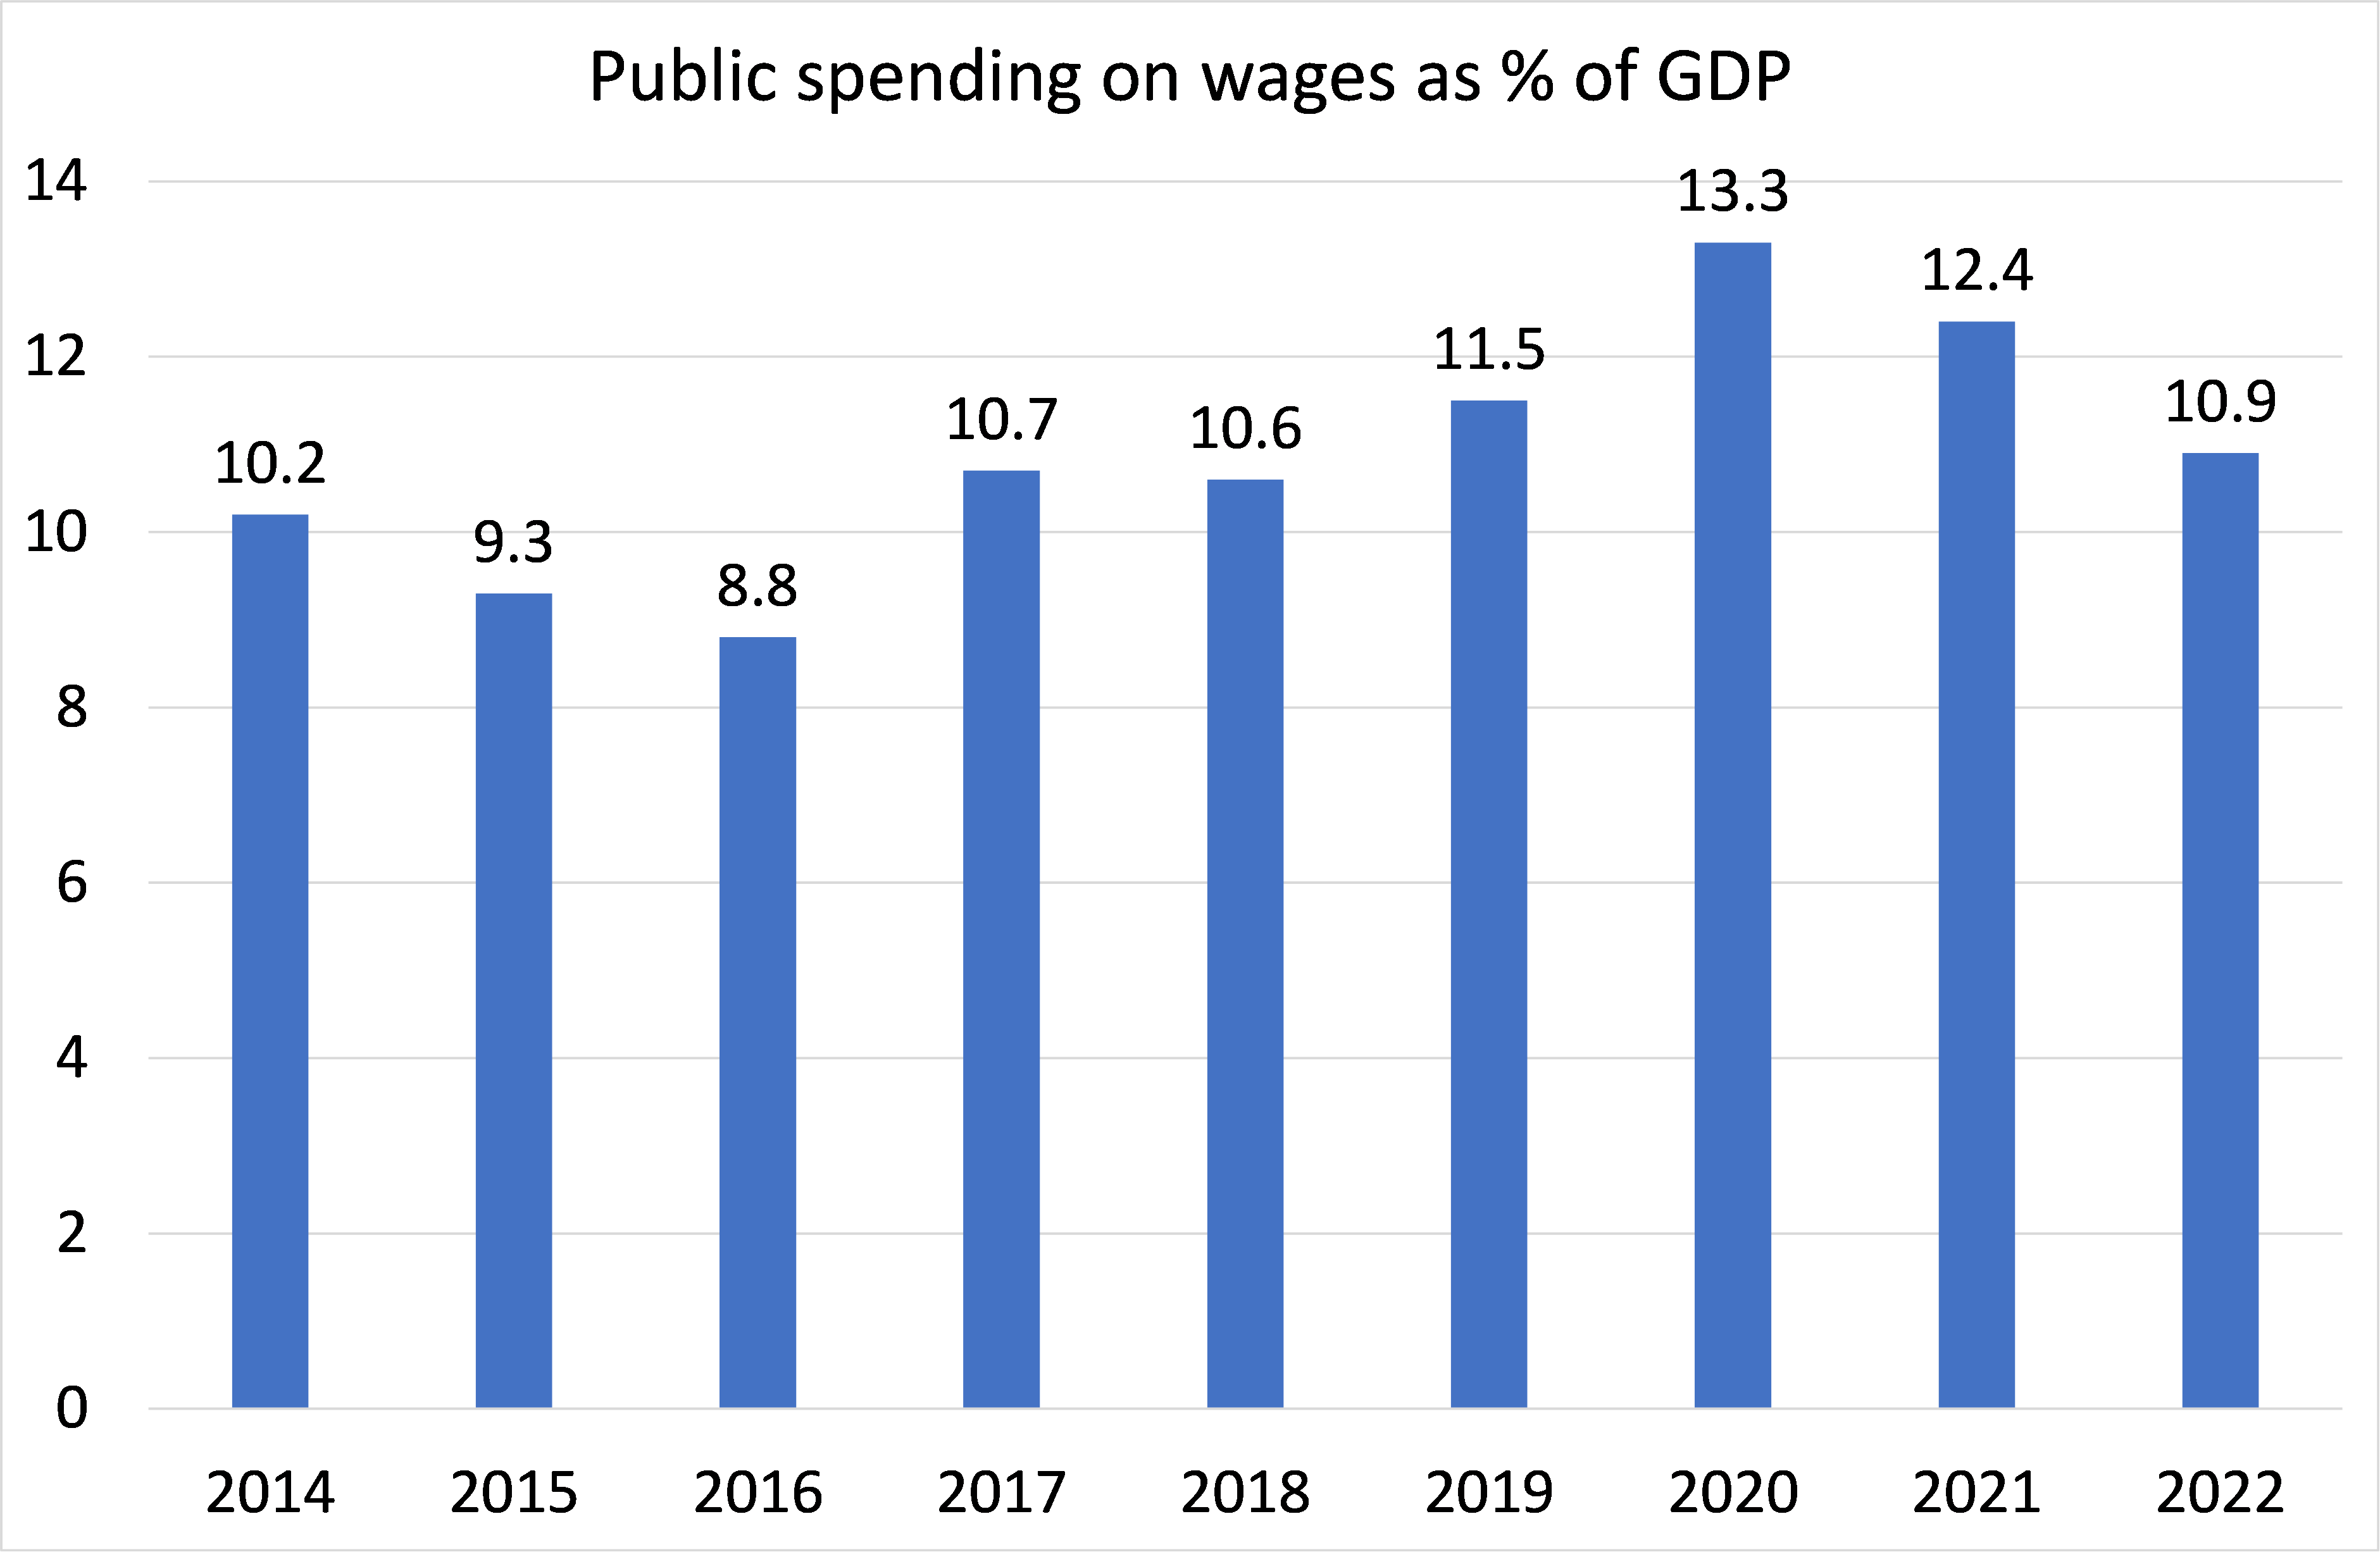 Source: IMF
Above all, the IMF is insisting, with the support of the latest post-Maidan government, to carry out substantial privatisation of the banks and state enterprises in the interests of ‘efficiency’ and to control ‘corruption’. “The authorities remain committed to downsizing the SOE sector. Adopting an overarching state ownership policy would be a key step. Ultimately, corporatization and the concomitant improvement in performance of non-strategic SOEs should lead to their successful privatization. Preparations are also underway to execute the authorities’ strategy to reduce state ownership in the banking sector. Updated in August 2020, the strategy envisions a reduction in state ownership to below 25 percent of banking sector net assets by 2025.”
Most significant has been the move to privatise land holdings. Ukraine is home to a quarter of the fertile “black earth” soil (Chernozem) on the planet. It is already the world’s biggest producer of sunflower oil and the fourth-biggest producer of corn. Along with soybeans, sunflowers and corn are among the main crops grown in the Sunflower Belt, which stretches from Kharkiv in the east to the Ternopil region in the west.
But agro productivity is low. In 2014 agricultural value added per hectare was $413 in Ukraine compared to $1,142 in Poland, $1,507 in Germany, and $2,444 in France. Land is highly polarized between a small workforce in large mechanized commercial farms and the mass of peasants who farm small plots. About 30% of the population still live in rural areas and farming gives employment to more than 14% of the workforce. One of the great demands of Western advisors to Ukraine in recent years is that it should ‘liberalize’ the land market so that ‘a prosperous growth dynamic’ might be unleashed. The IMF reckons that such liberalisation would add 0.6-1.2% pts to annual GDP growth depending on whether the government permitted both foreign and national land ownership.
The government is resisting allowing foreigners to buy land. But in 2024, Ukrainian legal entities will qualify for transactions involving up to 10,000 hectares and will apply an agricultural area of 42.7 million hectares (103 million acres). That is equivalent to the entire surface area of the state of California, or all of Italy! The World Bank is positively drooling at this opening up of Ukraine’s key industry to capitalist enterprise: “This is without exaggeration a historic event, made possible by the leadership of the President of Ukraine, the will of the parliament and the hard work of the government.” So Ukraine plans to open up its economy even more to capital, particularly foreign capital, in the hope that this will deliver faster growth and prosperity.
But this is hope only. Current annual economic growth is optimistically forecast to rise to a 4% rate each year while inflation will stay at 8-10% a year. Unemployment remains stubbornly high (10%), while business investment is falling off a cliff (down 40%). That does not bode well for a capitalist boom. Capital investment is low because the profitability of capital is very low.
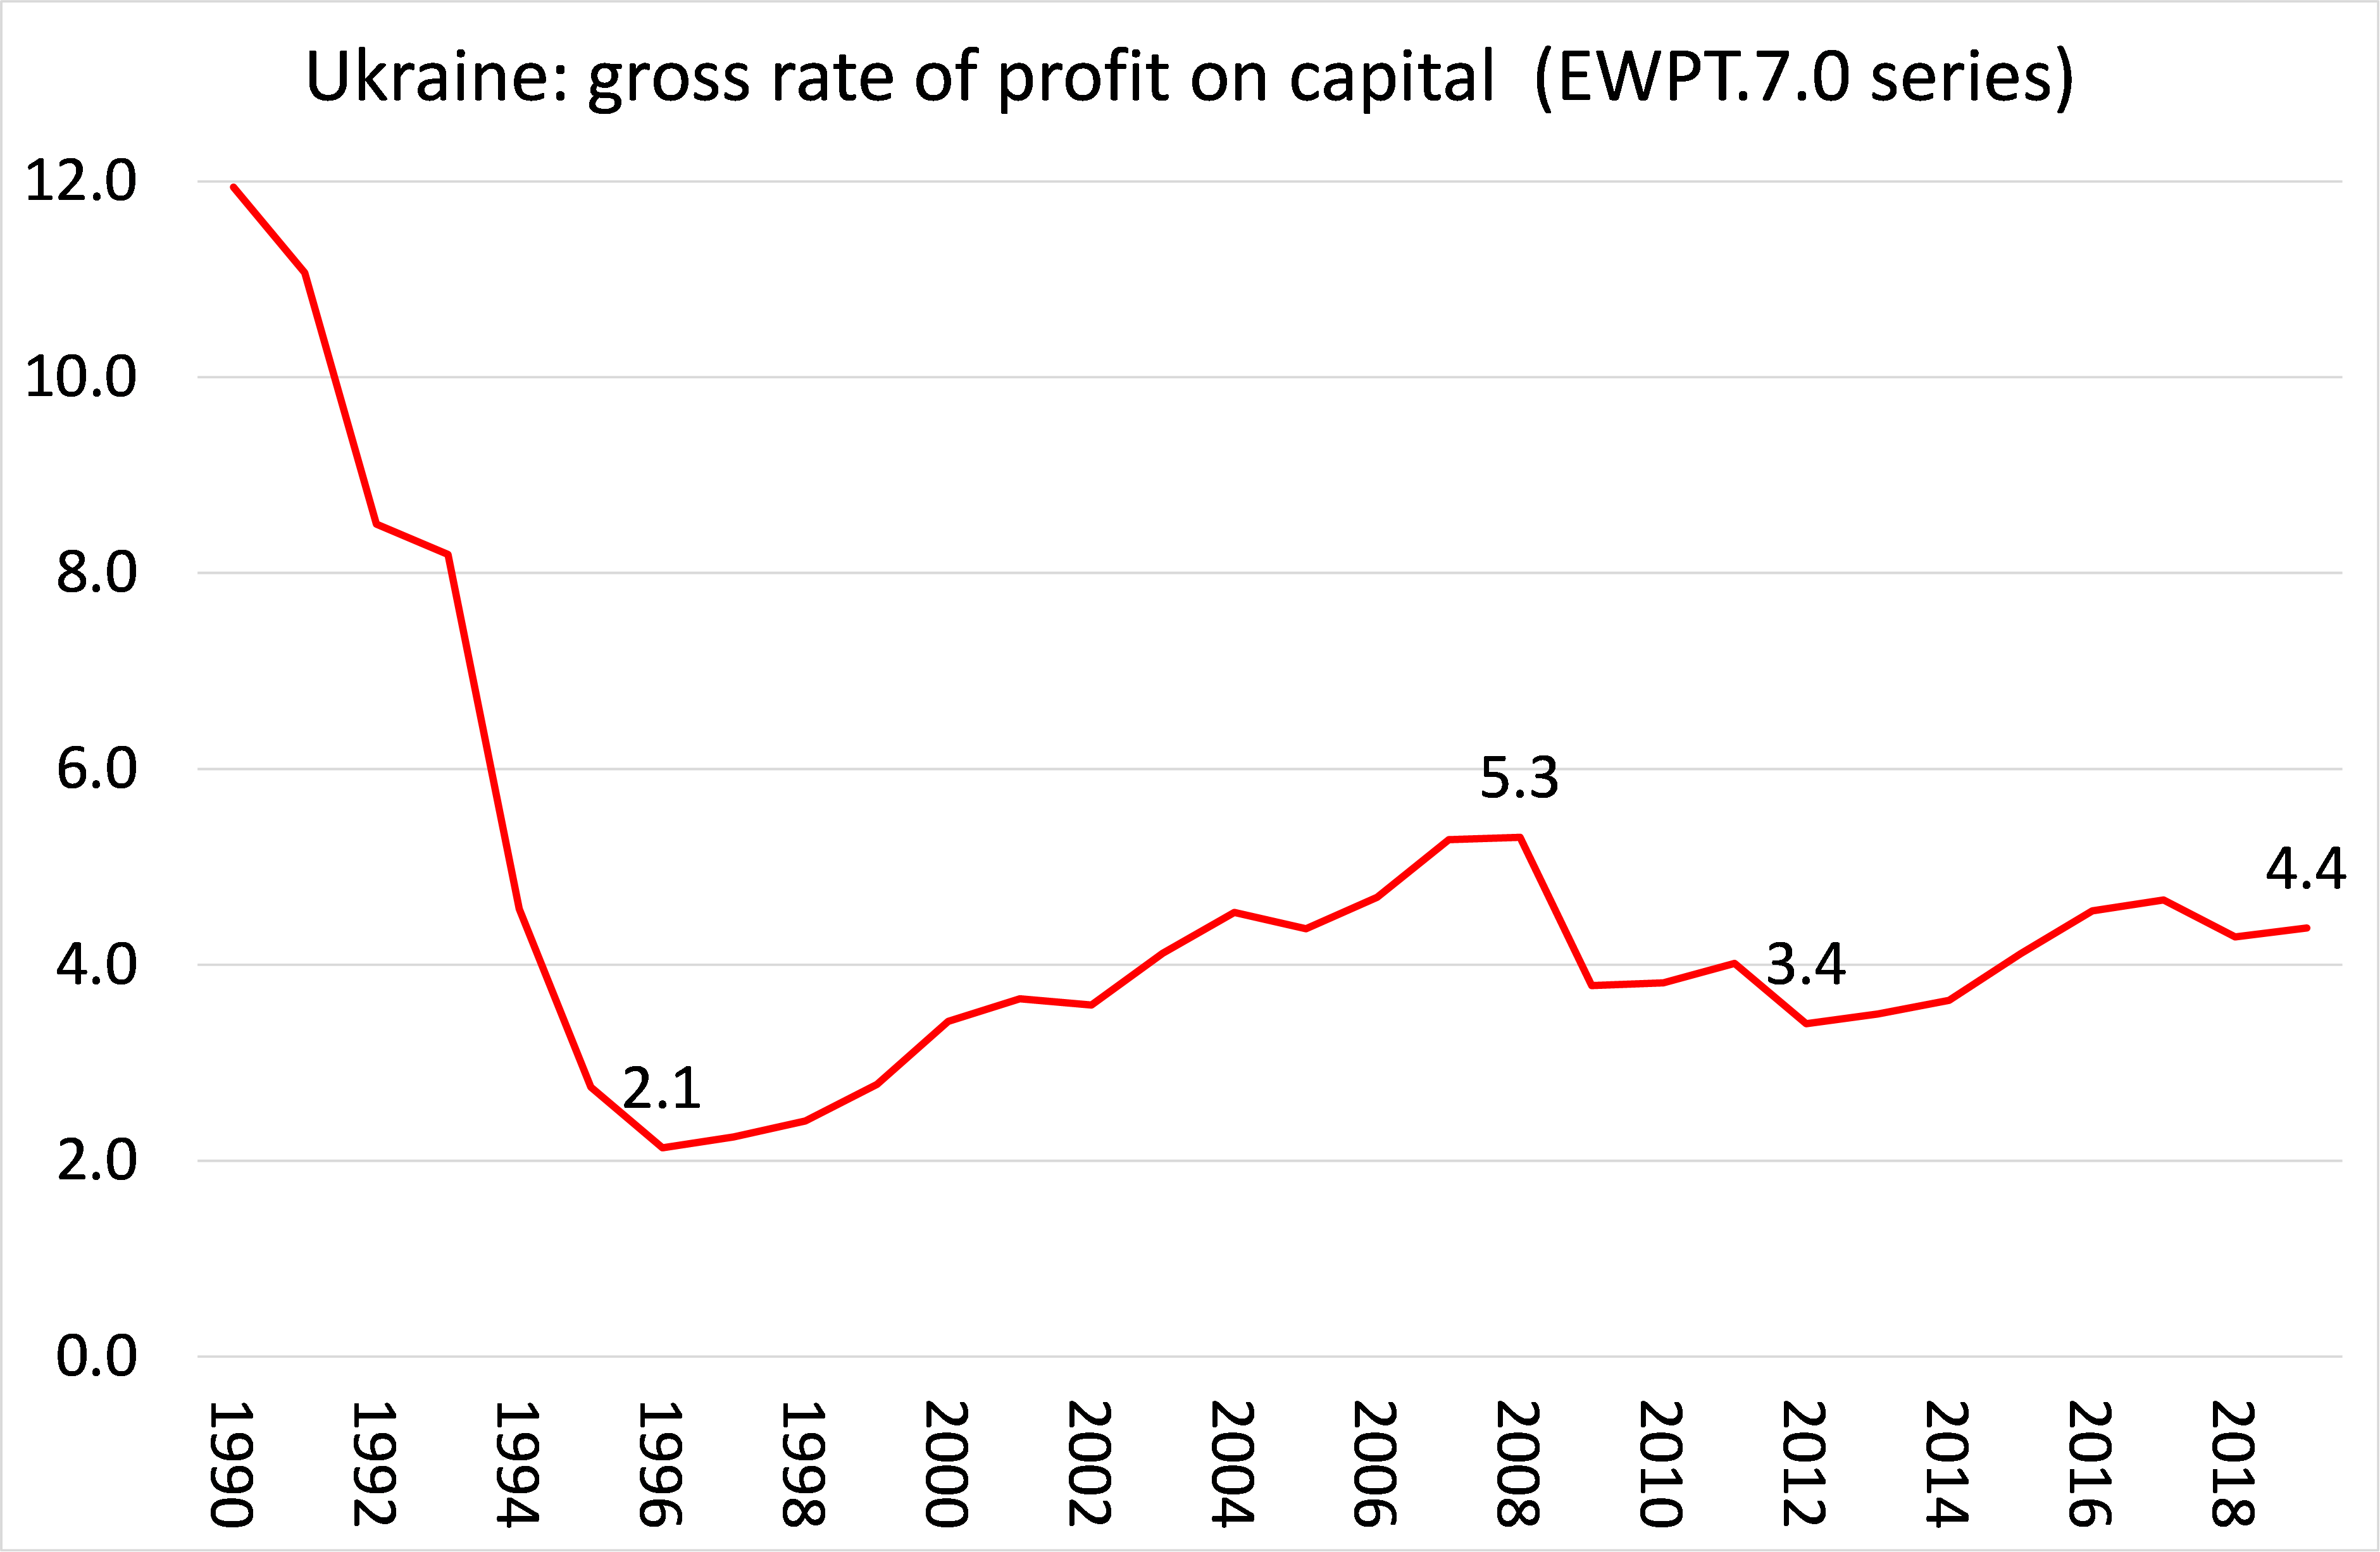 EWPT 7.0.series
Maybe the riches to be gained from the privatisation of state assets and land will reap rewards for some capitalists, probably mostly foreign investors. But most of the gains will probably disappear as corruption remains rampant. The IMF admits that if corruption is not reduced, there will be no recovery and Ukraine will not catch up with the rest of its neighbours to the West.
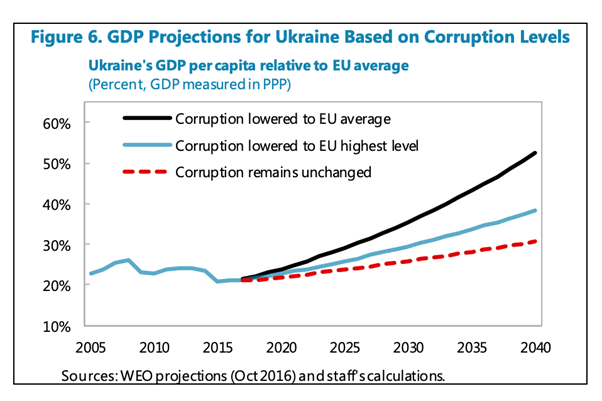
Officially, Ukraine’s gini coefficient for income inequality is the lowest in Europe. That’s partly because Ukraine is so poor: there is practically no middle class And the very rich hide their income and wealth, paying little or no taxes. The ‘shadow economy’ is very large, so the top 10% have wealth and income 40 times larger than the poorest Ukrainians. The current World Report on Happiness puts Ukraine at 111 out of 150 countries below many sub-Saharan African countries.
And the conflict with Russia has cost hugely. According to the Center for Economic and Business Research (CEDR), the loss of GDP has been $280bn dollars over six years from 2014 to 2020, or $40bn annually. The Russian annexation of Crimea has resulted in losses of up to $8.3 billion annually for Ukraine, while the ongoing conflict in the Donbas is costing the Ukrainian economy up to $14.6 billion a year. Total losses from these two occupations alone, since 2014, amount to $102 billion. CEBR says the conflict had a significant impact on the Ukrainian economy, including by reducing investor confidence in the country. This, in turn, led to a loss of $72 billion – $10.3 billion annually. The steady decline in exports resulted in total losses for Ukraine of up to $162 billion between 2014 and 2020. The total loss of fixed assets for Ukraine in Crimea and Donbas from the destruction or damage of assets amount to $117 billion. The total amount of foregone tax revenues to the budget of Ukraine for the period from 2014 to 2020 is $48.5 billion.
After the fall of the Soviet Union, and after gaining its official independence in 1994, the people of Ukraine were ravaged by oligarchs who have milked the assets and resources of the country and also by governments swinging their support between Putin’s Russia and the EU. After the Maidan uprising against the rule of the pro-Russian government, ultra nationalists in Ukraine have dominated government policy. They are demanding that Ukraine join the EU and above all join NATO in order to regain the territories annexed by Russia.
The cruel irony is that Germany has no intention of allowing a volatile and very poor Ukraine join the EU – far too much trouble and cost; while even the US will probably baulk at its NATO membership. In turn, Russia has no intention of handing back the Russian-speaking areas to Kiev control and instead is demanding permanent autonomy and an agreement that Ukraine will never join NATO.
The so-called Minsk accords of 2014-5, signed by the major powers and by a previous Ukraine government, cannot reconcile this division. So the Kiev nationalists, encouraged by the US, continue to press and the Russians continue to prepare for a possible invasion to force an agreement to divide the country permanently. Ukraine is trapped between the interests of Western imperialism and Russian crony capitalism.
February 10, 2022
MMT, Marglin and Marx
Let me start this post by quoting Noah Smith, liberal economist and Bloomberg journalist from his blog on Modern Monetary Theory (MMT): “The New York Times (NYT) just came out with a big glowing writeup of MMT, entitled “Time for a Victory Lap*”. This article aroused the anger of just about every macroeconomist on Twitter, and with good reason — it demonstrates very little understanding of the issues at play or the state of the policy debate, and it rhetorically elevates a fringe ideology to a position of importance and centrality that it neither occupies nor deserves. The NYT article on MMT, written by Jeanna Smialek, is mostly a puff piece about Stephanie Kelton, MMT’s most well-known proponent. In glowing tones, it describes Kelton’s clothes, her office, her house, her neighborhood, her blog, her manner of speaking, her personal story, and so on, calling her “the star architect of a movement that is on something of a victory lap”. Very little is written about the background of the macroeconomic policy debate, and what does appear is highly questionable.”
The NYT article also provoked ‘orthodox’ Keynesian gurus like Larry Summers and Paul Krugman into more scathing comments on MMT. Summers tweeted: “I am sorry to see the @nytimes taking MMT seriously as an intellectual movement. It is the equivalent of publicizing fad diets, quack cancer cures or creationist theories,” A fierce debate followed in the social media and encouraged new critical articles on the validity of MMT.
However, in this particular post, I am not going to repeat all the arguments from a Marxist perspective against the main propositions of MMT. You can read these in a number (six, I think) of posts on this blog; in this longer piece here; and in various video debates on my You Tube channel.
But given the latest discussion, I can add two things which are a reminder of MMT’s faultlines: first as explanation of money flows in a capitalist economy; and second, whether government spending financed by the state issuance and the ‘creation’ of money can deliver economic growth, full employment and rising incomes without touching the sides of capital’s exploitation of labour.
First, MMT argues that a state with ‘sovereign control’ over its currency (eg US government and the dollar) can issue as much as money it likes. This is obviously true as the state controls the issuance of the national currency. But what is not true is that the spending of this money (dollars, euros etc) automatically creates more value in things and services in an economy. As Keynesian Michael Pettis has argued before and repeats in a new article: “What MMT really shows is that there are no direct spending constraints on a government that is monetarily sovereign. It can always create money or debt to fund its spending needs without first needing to obtain the funding. This doesn’t mean, however, that there are no indirect constraints. In fact, there are always economic constraints. This is because an economy cannot consume and invest more than it produces and imports.”
I would put it another way. Money is not value; it is the representation of value. More money does not mean more value. If there is no more value created, then more money (dollars) just represents the same value: the money has depreciated in its ‘purchasing power’ or in its value per unit of currency. And there is no guarantee that increased government spending, whether financed by issuing more currency (MMT) or more government bonds (orthodox Keynesian) will lead to more value. That depends on the decisions of capitalist companies to invest in more labour and/or technology. And that in turn depends on whether more profit can be made. This is what Keynesian theory and MMT (really just an offshoot of Keynesian theory) do not recognise. By the way, you can read a recent riposte to this critique of MMT, https://gimms.org.uk/2021/11/14/garzon-reply-roberts-macro-modelling-mmt/, by Eduardo Garzón who shows exactly where the difference is between Marxist monetary theory and MMT. Of course, I consider the former a better explanation of a capitalist monetary economy and Garzon the latter.
But the other faultline in MMT is what happens when increased government spending financed by the ‘printing’ of money does not lead to increased value but instead to the inflation of prices. It is ironic that just as the NYT claims that MMT has ‘won the day’ in refuting the view of mainstream macro that balanced budgets and controls on public debt are required ie austerity, along comes a huge hike in inflation rates. Mike King in his blog says: “The rise in inflation was exacerbated by supply chain inefficiencies and disruptions, but it was almost certainly propelled to some extent by Covid relief spending and the Fed’s extremely loose monetary policy. That was a reminder that aggregate demand has a limit — that you can only boost the economy with fiscal and monetary policy so much before costs start to appear. (Those costs, as any orthodox macro theory will tell you, are due not to any issue with government financing, but to the economy’s real constraints — the limits of real resources available.).”
MMT proponents have always recognised that if an economy reaches ‘full employment’ and cannot grow any more, then inflation could ensue. Their answer is that the government should then increase taxation to ‘destroy’ the surfeit of money spending. But as I have argued before, in effect, MMT policy then becomes just like orthodox Keynesian macro management ie trying to tune the economy along the narrow path of growth without inflation with a judicious use of taxes and spending. Unfortunately, the anarchic capitalist accumulation process cannot be ‘adjusted’ in this way – as the failure of Keynesian macro management in the last major bout of high inflation and low real GDP growth in the late 1970s showed.
Indeed, in a new paper on the efficacy of MMT’s key policy proposal to achieve full employment, a Job Guarantee (JG), which I have also commented on in previous posts and papers, Jackson Mejia and Brian C. Albrecht argue that “the JG does nothing to stabilize inflation under a discretionary policy regime.” What they mean by this is that governments with adjustments to government spending and taxation cannot keep the Job Guarantee at the right level to achieve full employment and control inflation – there is a trade-off. They quote leading MMT exponents, Mitchell, Wray, and Watts (2019, Ch. 19) who write, “By design, a JG programme is a complement to. . . fiscal policies that aim to finetune total spending, and welfare or other social safety nets.” And again, MMTers Fullwiler, Grey, and Tankus (2019) suggest that “varying tax rates and other inflation offsets should be included in the budgeting process from the outset.” But as the authors of this paper conclude: “consistent with other findings of central bank inflation management under discretion, we find that inflation management under discretionary fiscal policy is subject to the same problem.” In other words, Keynesian fiscal management, whether orthodox or MMT-JG, cannot adjust effectively between the Scylla and Charybdis of full employment and inflation.
But that’s enough on MMT for now. In this post, I want to concentrate on what Larry Summers tweeted further on. Summers complains that one of the reasons that mainstream economics and central bankers got it wrong about the current bout of inflation in the major economies is that they and the financial media do not pay enough attention to the views of heterodox economics. Summers appears to want to show he is a ‘pluralist’ in his approach to economics, unlike some. He attacks the NYT and economic journalism in general for “its neglect of Marxist and post-Keynesian scholarship most of which is very critical of my views and policy choices”. Summers then argues that “the NYT should give more attention to Marxist scholars like Steve Marglin, whose book Raising Keynes deserves extensive debate.”
What? Who he? some of you might exclaim. Well part of the reason that Summers cites Stephen Marglin is that Marglin is a longstanding member of Harvard University’s economic department, the university in which Summers is an emeritus professor and was formerly President (when he got into trouble for claiming that women were poor at science). It may be that Marglin is the only ‘Marxist’ economist that he has read.
Marglin started out as a neoclassical economist and was regarded, even while still an undergraduate, as the star of Harvard’s economics department. But since the late 1960s, Marglin moved away from mainstream economics. He became a Leftist but describes himself as a Marxist “only in the sense of not being anti-Marx.” – so not a very strong attachment. Marglin apparently recognised that capitalists got rich, not because they were smarter than the average worker or because their factories etc were more efficient than workers self-producing, but because of their monopolisation of the means of production, which meant they got ‘rents’ out of production (note, no use of Marx’s category of surplus value). Capitalism also controlled the manufacture of knowledge.
‘Marxist’ Marglin’s new book, Raising Keynes: a 21st century General Theory, argues that Keynes’ radical ideas have been distorted and submerged by mainstream neoclassical economics. Modern Keynesianism has become a theory that claims capitalist production is fine except for some imperfections in markets. All government has to do is to intervene or manage the economy to compensate for these imperfections, or what is sometimes called the ‘warts’ on the smooth body of the ‘free market’ economy. In the case of macro management, the imperfection is ‘sticky’ prices or wages, which stop a capitalist economy from reaching full employment ‘equilibrium’. In a slump prices and wages should adjust downwards in order to reach a full employment equilibrium. But if there is monopoly pricing and trade unions, then the prices of commodities and labour become ‘sticky’ and the economy trundles along at less than full employment.
In his new book, Marglin, like Joan Robinson and others before him, reckons this view of Keynesianism is a travesty of Keynes. It is what Joan Robinson once calls ‘bastardised Keynes’. Marglin claims he is rescuing “the central insight of John Maynard Keynes’s great work, The General Theory of Employment, Interest and Money, that capitalism left to its own devices has no mechanism for guaranteeing full employment, and that consequently the government must provide a visible hand to work in tandem with the invisible hand of the market.” Raising Keynes shows how and why the orthodox reading of Keynes is wrong and substantiates Keynes’s insight that, even if you strip capitalism of its warts, you still have a system which has no mechanism for reliably producing enough jobs. So “we need the government, not on an occasional, intermittent basis, but all the time, in the long run as well as in emergencies.”
But I find nothing new in this ‘radical’ interpretation of Keynes. Marglin may think he is resurrecting Keynes from the dead, but several ‘Marxists’ and post-Keynesians have done this before him. For example, in an interview, winners of Leontiev prize (http://www.ase.tufts.edu/gdae/about_us/leontief15.html), Foley and Taylor claimed that: “Keynes saw capitalism’s general state as allowing almost arbitrary unemployment: hence his “General Theory.” Full employment was a lucky exception… calling full employment the general state and allowing one unlucky exception turns Keynes upside down.”
Moreover, does this revelation about a ‘heterodox’ Keynes make Marglin a Marxist? Well, it’s true that over 160 years ago, Marx reached the same conclusion as radical Keynes and Marxist Marglin that capitalism can never sustain full employment. But Marx’s theory was based on his law of general accumulation and the emergence of a permanent ‘reserve army of labour’. This ‘surplus to requirements’ workforce emerged because, in competition, capitalists strive to increase profits by invest more into technology relative to the labour force. In doing so, capitalists tend to shed labour for machines, and then draw on the surplus pool of labour according to the cycle of production.
But this theory of permanent ‘underemployment’ is not the same as that of Marglin’s ‘radical’ Keynes. For Marx, the failure of capitalism to deliver full employment is based on the contradiction between the capitalist drive for profit and social needs. Nothing is produced under capitalism unless it can make a profit. In contrast, Keynesian theory generally ignores profits as a driver. This is a fundamental difference and it shows in economic policy.
For what is Marxist Marglin’s policy solution to achieve full employment?. Well “the government must provide a visible hand to work in tandem with the invisible hand of the market.” So it is not the replacement of capitalist mode of production and the ending of the contradiction between private profit and social need. Instead, government must help capitalist production to work better. Indeed, Marglin’s practical example of this is the Roosevelt New Deal in the 1930s. According to Marglin, the New Deal “arrested the fall in prices and wages and set the stage for the gradual recovery of output and employment”. Really? By 1939 unemployment rates were still very high and the US economy was still struggling. Only in the ‘war economy’ from 1940 onwards was full employment achieved, when government took over the bulk of investment and employment decisions from private capital for the war effort. The war economy did not ‘work in tandem’ with the ‘invisible hand of the market’ but replaced capitalist production entirely, if only for a few years.
Anyway, it is just not true that Keynes was some sort of radical or socialist who rejected capitalism. As he wrote: “For the most part, I think that Capitalism, wisely managed, can probably be made more efficient for attaining economic ends than any alternative system yet in sight, but that in itself it is in many ways extremely objectionable. Our problem is to work out a social organisation which shall be as efficient as possible without offending our notions of a satisfactory way of life.” Moreover, the profit motive must remain: “The loss of profit may be due to all sorts of causes, but short of going over to communism there is no possibility of curing unemployment except by restoring to employers a proper margin of profit.” As Keynes argued that “Economic prosperity is…dependent on a political and social atmosphere which is congenial to the average businessman.” He had little respect for Karl Marx, calling him “a poor thinker,” and Das Kapital “an obsolete economic textbook which I know to be not only scientifically erroneous but without interest or application for the modern world.”
Two years ago, another ‘Marxist’ James Crotty published a book, called Keynes against Capitalism, in which he claimed that, far from being a conservative, Keynes was in fact a socialist, if not a revolutionary one like Marx. “Keynes did not set out to save capitalism from itself as many think, but instead reckoned it needed to be replaced by a liberal form of socialism.” Although what Keynes describes as liberal socialism was really the so-called mixed economy of capitalist combines and government control (which Marglin seems to advocate too), all run by “an elite of business managers, bankers, civil servants, economists and scientists, all trained at Oxford and Cambridge.”
Above all, let me remind readers that this radical Keynes appears to be only concerned with getting full employment within a capitalist economy. Keynes had little or nothing to say about global poverty and inequality; he was an imperialist in policy; and he claimed that capitalism would eventually solve the problem of lack of work through technology. The problem of the 21st century would then be one of ‘too much leisure’ because everybody would be on a 15-hour week!
It is this sort of ‘Marxist’ economics to which Summers wants us to pay attention. But as Austrian School economist Joseph Schumpeter once commented “[T]here are the attempts to Keynesify Marx or to Marxify Keynes….. It is in fact possible to enrich the meanings of both these authors by points culled from the other, (but) they are at opposite poles in matters that are of decisive importance analytically.” Rather than try to resurrect Keynes as Marglin aims to, it would be better to let him rest in peace.
Michael Roberts's Blog

- Michael Roberts's profile
- 35 followers

