
Gennaro Cuofano's Blog, page 94
September 12, 2022
What is the Kirkpatrick model?
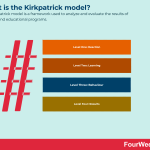

The Kirkpatrick model is a framework used to analyze and evaluate the results of training and educational programs.
Understanding the Kirkpatrick modelThe Kirkpatrick model was developed by Donald L. Kirkpatrick in 1954, a former Professor Emeritus at the University of Wisconsin and president of the American Society for Training and Development (ASTD).
Kirkpatrick’s model, which was the focus of his Ph.D. dissertation, became an influential framework for training course evaluation after his ideas were published in the United States Training and Development Journal in 1959.
Kirkpatrick updated the model in 1975 and 1993, with son James and wife Wendy revising the model once more after Kirkpatrick died in 2014.
The latest iteration of the model seeks to emphasize the importance of training that is relatable to an employee’s daily activities.
Today, the Kirkpatrick model is one of the most popular and recognized for determining the effectiveness of training and educational programs.
It is used to analyze any type of training – whether that be formal or informal – against four levels of criteria which are described in the next section.
The four levels of Kirkpatrick’s modelModern interpretations of Kirkpatrick’s model believe it is prudent to start at level four and work backward to better establish desirable outcomes.
This is also to avoid a common scenario where facilitators become stuck in the first two levels and never proceed to complete the training program.
With that in mind, here are the four levels.
Level 1: ReactionThe first level determines whether students find the training material relevant, favorable, or otherwise stimulating. This is normally achieved by a so-called “smile sheet” where individuals are asked to rate their experience.
Kirkpatrick stressed that it was important to focus on questions that relate to the student’s experience of course objectives, course materials, content relevance, and the level of facilitator knowledge.
Too many businesses fixate on training outcomes and not on how the training was delivered.
Level 2: LearningThe second level is concerned with whether the student has acquired the intended knowledge, skills, attitude, or confidence after taking the course.
Before-and-after student assessments are effective here, as are examinations and comparisons to a control group.
Irrespective of the method chosen, it is important to standardize the scoring system and ensure that the method is aligned with the objectives of the training program.
Level 3: BehaviourCrucial to measuring the true impact of a training initiative is the behavior of students. In other words, is there evidence employees are exhibiting new behavior in their positions?
Kirkpatrick’s model also considers the concept of drivers, otherwise known as the processes and reward systems that compensate performance and encourage desirable behavior.
Note that if an individual fails to alter their behavior post-training, this does not necessarily mean the training itself has failed.
In some cases, the training may be robust but let down by a less-than-stellar change management strategy.
Level 4: ResultsLevel 4 is where the rubber hits the road, so to speak.
Here, the effectiveness of the training program is measured against organizational KPIs that may relate to fewer workplace incidents, increased sales, or more favorable employee morale, for example.
Determining the actual impact of training on these KPIs can be difficult – despite them being the impetus for the training program in the first place.
Like the methods seen in phase two for employees, control groups and before-and-after assessments can also be worthwhile for broader organizational objectives.
More simply, the business can compare the return on investment to the cost of training.
Key takeaways:The Kirkpatrick model is a framework used to analyze and evaluate the results of training and educational programs. The Kirkpatrick model was developed by Donald L. Kirkpatrick and has been revised several times since 1954.The Kirkpatrick model is one of the most popular and recognized for determining the effectiveness of formal and informal training and educational programs.The Kirkpatrick model features four criteria, or levels: reaction, behavior, learning, and results. To design training programs with more optimal outcomes and ensure the initiative is seen through to completion, it is recommended that facilitators start at level 4 and work backward.The post What is the Kirkpatrick model? appeared first on FourWeekMBA.


What is a learning cycle?
Learning cycles explain how people learn from experience over multiple phases, with the last phase often followed by the first to facilitate progression.
One of the first proponents of learning cycles was American psychologist and educational philosopher John Dewey.
In his 1933 book How We Think, Dewey described a five-aspect model of reflective thought where the individual first identifies a potential solution and ultimately arrives at a point where it can be tested.
Since that time, several learning cycle frameworks have been developed. Some of these are briefly explained below.
Kolb and Fry’s modelEducational theorists David A. Kolb and Ronald E. Fry developed the experiential learning model (ELM) in 1975.
Fundamentally, the model enables students to learn via real-world experiences, reflect on lessons learned, and apply solutions to future scenarios.
The model, which has applications from business to the military, is a learning cycle comprised of four distinct phases:
Concrete experience – in the first phase, the learner experiences something never encountered before. Alternatively, they may reinterpret an old experience with new concepts. Reflective observation – the learner then reflects on the experience based on the existing knowledge. In particular, they think about the inconsistencies that occur between experience and understanding.Abstract conceptualization – eventually, reflection enables the individual to form a new idea or modify an existing concept. Put differently, the person has learned from their experience.Active experimentation – in the final phase, the learner applies their newfound knowledge to real-world contexts to see what happens.Honey and Mumford’s modelBased on Kolb and Fry’s work, Peter Honey and Alan Mumford developed a similar learning cycle in 1985.
Like their predecessors, Honey and Mumford see learning as having an experience, reflecting on that experience, drawing conclusions, and testing new theories.
However, to describe people who enter and exit the cycle at different points, the pair developed four learning styles:
Activist – those who learn best from hands-on experience and are not afraid to operate outside their comfort zone.Theorist – those who learn best by understanding the models, concepts, and facts behind a topic. Pragmatist – these learners are most effective when they can see the real-world application of whatever it is they are studying.Reflector – as the name suggests, these learners do best when they can observe others and reflect on the experience. They prefer to collect data from multiple sources or perspectives before tackling a problem.The 5E learning cycleThe 5E learning cycle was developed by BSCS Science Learning out of Colorado, USA. The cycle contains five phases:
Engage – first, the student’s attention must be captured.Explore – then, the student is permitted to establish knowledge of a topic via questions and observations.Explain – where the student shares what they have learned and participates in an instructor-led discussion.Extend – similar to the reflection stage of the ELM model, the student is called upon to apply what they have learned in similar contexts.Evaluate – lastly, the instructor assesses whether student knowledge and understanding are valid. It’s important that evaluation be performed as part of the cycle and not as a standalone event.ALACT modelA more recent learning cycle with a focus on personal development and student teachers is the ALACT model. Developed by Fred Korthagen, Angelo Vasalos, and their colleagues, the learning cycle in this model features five phases:
Action – the model first advocates that learning and reflection are most effective when backed by practical experience.Looking back on the action – where the individual reflects on the context, their actions, the actions of others, and their feelings or emotions.Awareness of essential aspects – here, the individual endeavors to make sense of their experience by thinking about its implications or significance. Creating alternative methods of action – based on information yielded from the second and third phases, the individual determines how they can do better.Trial – where new courses of action are “trialled” or adopted.Key takeaways:Learning cycles explain how people learn from experience over multiple phases, with the last phase often followed by the first to facilitate learning. One of the first proponents of the learning cycle was American psychologist and educational philosopher John Dewey.Educational theorists David A. Kolb and Ronald E. Fry developed the experiential learning model (ELM) in 1975, one of the first learning cycle frameworks of the modern age that is still in use today.Other interpretations of the learning cycle are the Honey and Mumford model, the 5E model, and the ALACT model.The post What is a learning cycle? appeared first on FourWeekMBA.
What is the SECI model?
The SECI model is a framework that explains how explicit and tacit knowledge is converted into organizational knowledge.
Understanding the SECI modelKnowledge is often the key source of competitive advantage in many industries. It creates value for the organization by enabling it to innovate, learn and unlearn, and transfer best practices across boundaries.
With the advent of the information age and knowledge societies, there has been much research into the processes that enable organizations to capture, integrate, share, use, and maintain knowledge to improve performance.
Several management processes have also been put forth to ensure knowledge is made available to all employees irrespective of rank or seniority level.
One of the most popular frameworks in use today is the SECI model. The model considers knowledge creation to be a dynamic process where the interaction between tacit and explicit knowledge creates new knowledge that spreads across three ontological levels: individual, organizational, and inter-organizational.
Tacit and explicit knowledge in the SECI modelBefore we move on to explain the model further, it may first be helpful to explain the difference between tacit and explicit knowledge:
Tacit knowledge – this encapsulates the knowledge, skills, and abilities an individual accrues from personal and professional life experiences. It is a more intuitive form of knowledge that is rooted in context, values, and practice and is harder to communicate with others since it resides in the mind. Transferral of tacit knowledge occurs via training, mentoring, and support.Explicit knowledge – compared to tacit knowledge, explicit knowledge is easily documented and communicated between people. In an organizational context, it may take the form of a standard operating procedure, brand style guide, or content library, for example. Explicit knowledge is information found in documents, books, and databases and can easily be accessed, stored, and verbalized by others.The interaction between tacit and explicit knowledgeAccording to SECI model creator Ikujiro Nonaka, there are four modes of knowledge conversion which explain how tacit and explicit knowledge interact:
Socialization (tacit to tacit) – a process of knowledge sharing characterized by observation, imitation, practice, and guidance. Socialization is direct and occurs via the shared experiences of one person who has the knowledge and one person who does not. Within a company, socialization can occur when employees interact with customers or in a team brainstorming session.Externalisation (tacit to explicit) – a more difficult process where tacit knowledge is codified into documents, manuals, or processes that enable the information to be learned by others and shared across the organization. Once crystallized, it becomes the basis of new knowledge. Combination (explicit to explicit) – Nonaka described this process as one where “explicit knowledge is collected from inside or outside the organization and then combined, edited, or processed to form more complex and system explicit knowledge.” The building of a prototype is a classic example of the combination process.Internalization (explicit to tacit) – where knowledge created in the previous process is converted into tacit knowledge by employees. This knowledge is then used in practical contexts and forms the basis of new routines. Internalization is also characterized by personal and collective reflection, pattern recognition, and the ability to understand various fields, concepts, and ideas.Key takeaways:The SECI model is a framework that explains how explicit and tacit knowledge is converted into organizational knowledge.In more recent years, there has been increased interest in processes that help organizations capture, integrate, share, use, and maintain knowledge to improve performance.SECI model creator Ikujiro Nonaka developed four knowledge dimensions that explain how tacit and explicit knowledge interact: socialization, externalization, combination, and internalization.The post What is the SECI model? appeared first on FourWeekMBA.
TOWS Matrix vs. SWOT Analysis
The TOWS Matrix is an acronym for Threats, Opportunities, Weaknesses, and Strengths. It’s a variation on the SWOT Analysis, and it tries to address some of the weaknesses of the SWOT Analysis. Both can be useful to assess the market context.
Understanding a TOWS matrix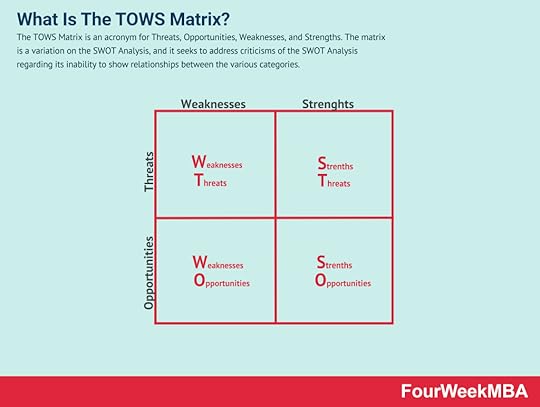 The TOWS Matrix is an acronym for Threats, Opportunities, Weaknesses, and Strengths. The matrix is a variation on the SWOT Analysis, and it seeks to address criticisms of the SWOT Analysis regarding its inability to show relationships between the various categories.
The TOWS matrix was created by author and management consultant Heinz Weihrich in 1999.
While both the TOWS matrix and SWOT analysis consider the same four factors, the former is more of a strategic planning tool. It looks at the specific relationships between internal and external factors that help an organization remove weaknesses, exploit strengths, take advantage of opportunities, and reduce or remove threats.
Each relationship is represented by a 2×2 matrix with resultant strategic options occupying four quadrants:
Strengths to opportunities (SO) – the strategy with the greatest chance of success where the organization focuses on its internal strengths to “double down” on external opportunities and increase market share.Strengths to threats (ST) – the second strategy calls on the organization to consider how its internal strengths could help it avoid real or potential market threats. Weaknesses to opportunities (WO) – how can market opportunities compensate for an organization’s internal weaknesses?Weaknesses to threats (WT) – this is a defensive strategy where the organization must seek to minimize the impacts of both its internal weaknesses and external threats. In some cases, this may force the organization to question whether it has a viable business.Understanding a SWOT analysis
The SWOT analysis was created by American management consultant and businessman Albert Humphrey. The analysis is the result of a decade of work between 1960 and 1970 at Stanford University where Humphrey developed a team-based approach to planning.
The analysis can serve much like a questionnaire for each factor. For example:
Strengths – what does the organization do well? Does it own intellectual property or possess a unique skill?Opportunities – are there changes to the external environment ripe for exploitation? How can the organization take advantage of a competitor’s weakness?Weaknesses – is IP outdated? Does the workforce require extra training? Is the organization’s financial position sustainable?Threats – what threat do the competition pose? Is a change of government likely to drive up costs? What about a fluctuation in the economic cycle?The SWOT analysis is a simple but effective way for an organization to assess its strengths, weaknesses, opportunities, and threats. Unlike the TOWS matrix, however, it does not clarify how a strength may be maximized or a weakness avoided. As a result, it is often used in conjunction with another analysis.
Read Next: TOWS Matrix, SWOT Analysis.
Other related business frameworks:
AIDA ModelAnsoff MatrixBusiness AnalysisBusiness Model CanvasBusiness Strategy FrameworksVRIO FrameworkAdditional resources:
Business ModelsBusiness StrategyDistribution ChannelsGo-To-Market StrategyMarketing StrategyMarket SegmentationNiche MarketingRevenue ModelsConnected strategic frameworks The PESTEL analysis is a framework that can help marketers assess whether macro-economic factors are affecting an organization. This is a critical step that helps organizations identify potential threats and weaknesses that can be used in other frameworks such as SWOT or to gain a broader and better understanding of the overall marketing environment.
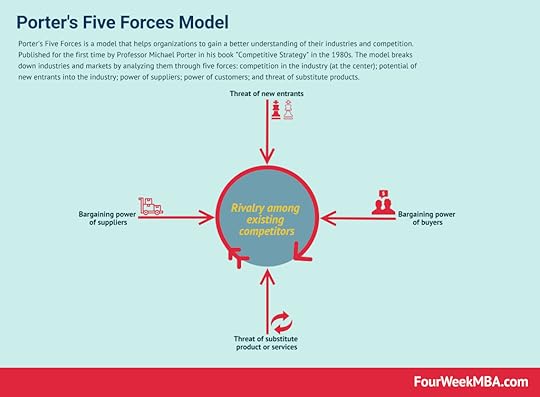 Porter’s Five Forces is a model that helps organizations to gain a better understanding of their industries and competition. Published for the first time by Professor Michael Porter in his book “Competitive Strategy” in the 1980s. The model breaks down industries and markets by analyzing them through five forces
 A blue ocean is a strategy where the boundaries of existing markets are redefined, and new uncontested markets are created. At its core, there is value innovation, for which uncontested markets are created, where competition is made irrelevant. And the cost-value trade-off is broken. Thus, companies following a blue ocean strategy offer much more value at a lower cost for the end customers.
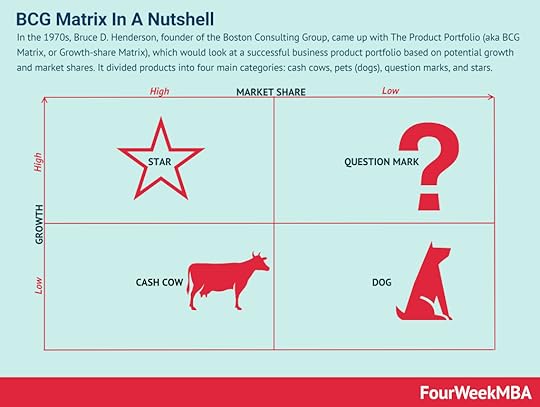 In the 1970s, Bruce D. Henderson, founder of the Boston Consulting Group, came up with The Product Portfolio (aka BCG Matrix, or Growth-share Matrix), which would look at a successful business product portfolio based on potential growth and market shares. It divided products into four main categories: cash cows, pets (dogs), question marks, and stars.
 First proposed by accounting academic Robert Kaplan, the balanced scorecard is a management system that allows an organization to focus on big-picture strategic goals. The four perspectives of the balanced scorecard include financial, customer, business process, and organizational capacity. From there, according to the balanced scorecard, it’s possible to have a holistic view of the business.
 Businesses use scenario planning to make assumptions on future events and how their respective business environments may change in response to those future events. Therefore, scenario planning identifies specific uncertainties – or different realities and how they might affect future business operations. Scenario planning attempts at better strategic decision making by avoiding two pitfalls: underprediction, and overprediction.
Other related business frameworks:
AIDA ModelAnsoff MatrixBusiness AnalysisBusiness Model CanvasBusiness Strategy FrameworksVRIO FrameworkThe post TOWS Matrix vs. SWOT Analysis appeared first on FourWeekMBA.
September 11, 2022
Mnemonic Techniques
Mnemonic techniques, also known as mnemonic devices, describe various ways in which an individual can memorize ideas with patterns.
As a memorization tool, mnemonic techniques are as numerous as they are varied.
Most people can remember the phrase from their childhood used to memorize the correct order of the planets.
However, relatively few would have heard of the method of loci technique or the one based on linked stories and images.
Let’s describe some of these mnemonic techniques (and a few others) in the sections that follow.
Method of loci The Method of Loci is a mnemonic strategy for memorizing information. The Method of Loci gets its name from the word “loci”, which is the plural of locus – meaning location or place. It is a form of memorization where an individual places information they want to remember along with points of an imaginary journey. By retracing the same route through the journey, the individual can recall the information in a specific order. For this reason, many consider this memory tool a location-based mnemonic.
 The method of loci mnemonic technique is one of the oldest still in use today. The technique, which is also one of the most researched and versatile, was used as early as 477 BC by the Greek poet Simonides of Ceos.
In short, the learner visualizes a familiar room or route inside a building and then mentally attributes information to familiar objects or locations.
As the individual imagines themselves following a path or entering a room, each object or location enables them to recall specific pieces of information.
The linking systemSimilar to the method of loci is the linking system technique. Here, the learner must create a story that connects pieces of information with each piece resulting in recollection of the next.
Imagine that Wendy has an important presentation tomorrow and needs to remember to bring the following items to work: laptop, reading glasses, pointer, brochures, and cue cards.
Wendy uses the linking system to develop a short story that will help her remember these items: Wendy’s laptop puts on its reading glasses and uses a pointer to illustrate brochures and cue cards.
Acronyms and acrosticsAcronyms are one of the easiest mnemonic techniques to understand. For example, the HOMES acronym is used to remember all five of the North American Great Lakes:
Huron.Ontario.Michigan.Erie, andSuperior.Acrostics are similar to acronyms but use a phrase or complete sentence is used to recall information instead of a word.
The most common of these, which we touched on in the introduction, is the acrostic that deals with the number and order of planetary bodies.
Derivations of the phrase “My Very Educated Mother Just Sent Us Nine Pizzas” contain the first letter of each planet.
ChunkingChunking is a technique where the individual breaks down information into smaller chunks.
This is commonly employed to remember long numbers such as those associated with phone numbers, social security accounts, bank accounts, and even passwords.
Recent research by Norris and Kalm (2021) posits that chunking is effective because it serves as a long-term memory function.
Making connectionsMaking connections is about connecting new information with something the individual already knows or is familiar with.
This versatile technique is a type of elaborative rehearsal which, like chunking, can result in more information stored in long-term memory.
Consider Tony, a businessman who attends a networking function with a tendency to forget people’s names.
When Tony is introduced to Nancy, for example, he can memorize her name by associating it with an observation.
Tony notices that Nancy is somewhat reserved and shy, so he decides to call her “Nervous Nancy” in his mind to remember her name should the two ever cross paths in the future.
Key takeaways:Mnemonic techniques, also known as mnemonic devices, describe various ways in which an individual can memorize ideas with patterns.In use as early as 477 BC, the method of loci mnemonic technique is one of the oldest still in use today. It involves visualizing a familiar room or route inside a building and then mentally attributing information to familiar objects or locations.Other common mnemonic techniques include acronyms, acrostics, chunking, and making connections.Connected Mnemonic FrameworksThe Method of Loci is a mnemonic strategy for memorizing information. The Method of Loci gets its name from the word “loci”, which is the plural of locus – meaning location or place. It is a form of memorization where an individual places information they want to remember along with points of an imaginary journey. By retracing the same route through the journey, the individual can recall the information in a specific order. For this reason, many consider this memory tool a location-based mnemonic.  The Feynman Technique is a mental model and strategy for learning something new and committing it to memory. It is often used in exam preparation and for understanding difficult concepts. Physicist Richard Feynman elaborated this method, and it’s a powerful technique to explain anything.
 The 5 Whys method is an interrogative problem-solving technique that seeks to understand cause-and-effect relationships. At its core, the technique is used to identify the root cause of a problem by asking the question of why five times. This might unlock new ways to think about a problem and therefore devise a creative solution to solve it.
 Related Strategy Concepts: Read Next: Mental Models, Biases, Bounded Rationality, Mandela Effect, Dunning-Kruger Effect, Lindy Effect, Crowding Out Effect, Bandwagon Effect, Decision-Making Matrix.
The post Mnemonic Techniques appeared first on FourWeekMBA.
MoSCoW Method In A Nutshell
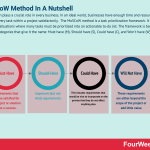

Prioritization plays a crucial role in every business. In an ideal world, businesses have enough time and resources to complete every task within a project satisfactorily. The MoSCoW method is a task prioritization framework. It is most effective in situations where many tasks must be prioritized into an actionable to-do list. The framework is based on four main categories that give it the name: Must have (M), Should have (S), Could have (C), and Won’t have (W).
Understanding the MoSCoW methodSince unforeseen setbacks are inevitable, task prioritization ensures that the most relevant and important tasks are completed first. Projects lacking in task prioritization quickly become disorganized and chaotic.
Instead of a systematic process, resources are typically assigned to tasks by those that simply have the most influence in the room. Invariably, this comes at the expense of the success of the project and of the organization itself.
The MoSCoW method categorizes requirements based on their intrinsic value to the business. Requirements most commonly take the form of tasks but change processes and objectives can also be analyzed.
The method is based on an acronym from the first letter of four prioritization categories.
In the next section, we will look at each category in more detail.
The four prioritization categories of the MoSCoW methodAll requirements are important to MoSCoW method principles, but they need to be categorized according to priority to deliver maximum benefit to the business.
Here are the four categories in descending order of priority:
Must have (M) – or requirements that must be satisfied for the project or solution to be a success. These requirements play a vital role in meeting deadlines and satisfying legal or safety standards. If the result of a requirement not being met is project cancellation, then it occupies this category.Should have (S) – or important (but not vital) requirements such as a lack of efficiency or unfavorable stakeholder expectations. These so-called “secondary requirements” usually have a workaround and do not significantly impact the project being delivered. In any case, they should only be rectified once “must-have” requirements have been satisfied.Could have (C) – this includes requirements that would be nice to incorporate on the proviso that they do not affect anything else. However, leaving them out of the project scope must result in little impact when compared with a “should have” requirement. This category sometimes includes low-cost refinements that are carried out provided there is sufficient time to do so.Won’t have (W) – these requirements are either beyond the scope of the project or add little value. They may be feasible for a future project update and should be stored away for later reference. For example, a new rideshare company may shelve plans for a premium car option until usability issues with its app have been resolved.Advantages and disadvantages of the MoSCoW methodAdvantagesEase of use. The method is easy to learn and implement because it is based on basic principles of task prioritization.Accuracy. Accurate task prioritization is reliant on group consensus lead by an impartial moderator. It does not rely on biased prioritization where big personalities can influence others.Versatility. The MoSCoW method can be used for any project and any sized company.DisadvantagesLack of category sorting. While the method provides clear guidance on categorization, it does not suggest how requirements within the categories should be sorted.Bias. Despite the team-based approach, bias can still occur when most requirements are mistakenly placed in the “must-have” category. Some businesses find it helpful to stipulate that no more than 60% of all project requirements can be classified as high priority.MoSCoW method examplesBelow we have listed a few general examples of the MoSCoW method in action.
Developing a project management app Must have – task assignment, file attachment, workflow monitoring, and integration with Google Calendar.Should have – Kanban view, Notion integration, mobile app version, in-app messaging, and time tracking functionality.Could have – collaborative whiteboard (in-app), Chrome support (add-on), integration with Slack, and a feature that visualizes key project advancement indicators.Won’t have – video conferencing. Designing a block of apartments for a new city development Must have – cement, bricks, windows, proper ventilation, fire hoses for each floor, pile foundations, and a stairwell for emergencies.Should have – a compact, modular kitchen, doors made from composite material, soundproofed walls, two elevators, at least two bedrooms per apartment, and ducted, reverse cycle heating and cooling.Could have – load-bearing balconies (with a balustrade), internal staircases for penthouse apartments, outdoor entertainment areas, and an intercom system.Won’t have – traditional gardens, water features, and a separate laundry room for a washing machine and dryer. Product development for a men’s wallet Must have – two slots for banknotes, ten compartments for credit and debit cards, durable construction material, and high-quality sewing.Should have – leather as the primary composition, a transverse horizontal compartment, a transparent credit card sleeve, and a small company logo on the outside face.Could have – an attractive, timeless color or pattern on the inside of the banknote slots, an additional transparent sleeve for treasured photos, and a small, zippered coin pouch.Won’t have – cream or beige colored leather that stains or wears easily, external metal accents that can catch on the material inside the wearer’s pocket. Purchasing a new vehicle Must have – at least seven seats, 4WD, a 5-star safety rating, a hybrid engine, front and rear passenger airbags, adaptive cruise control, tow bar, and Apple CarPlay.Should have – reverse parking sensors, electronic brakeforce distribution (EBD), blind spot mirror warnings, an electric driver’s seat with customizable settings, and Bluetooth.Could have – lane departure warning system, heated seats, limited slip differential, sunroof, leather upholstery, center airbags, remote parking, intersection-scanning autonomous emergency braking (AEB), and live blind spot video feed.Won’t have – a small, four-cylinder engine, screens that are not touch-sensitive, haptic controls that replace buttons, spoiler, and voice recognition. Building a website for a law firm that wants to enable clients to track their court cases Must have – robust coding free from any bugs, maximum uptime, a simple client registration system, a safe and robust personal directory that cannot be accessed by malicious actors, and discoverability on the first page of Google search results for the company name keyword.Should have – a modern, intuitive, and responsive design and navigation, email notifications, a site with pages that load quickly, nofollow links to external sites or organizations, a high contrast color scheme, and a prominent “Contact Us” page.Could have – a blog section with information on industry news and trends, custom menus with submenus, and an introductory video on the homepage.Won’t have – too much text, no whitespace, and pages with no mobile optimization.Key takeawaysThe MoSCoW method is a requirement prioritization framework. It may be used to classify tasks, objectives, or change processes.The MoSCoW method utilizes four requirement categories according to the degree that each requirement impacts the overall project.The MoSCoW method is a versatile, accurate, and relatively simple process to learn. However, it can be prone to bias and it does not suggest how requirements within categories should be prioritized.Related Agile Business Frameworks AIOps is the application of artificial intelligence to IT operations. It has become particularly useful for modern IT management in hybridized, distributed, and dynamic environments. AIOps has become a key operational component of modern digital-based organizations, built around software and algorithms.
  Agile started as a lightweight development method compared to heavyweight software development, which is the core paradigm of the previous decades of software development. By 2001 the Manifesto for Agile Software Development was born as a set of principles that defined the new paradigm for software development as a continuous iteration. This would also influence the way of doing business.
  Agile project management (APM) is a strategy that breaks large projects into smaller, more manageable tasks. In the APM methodology, each project is completed in small sections – often referred to as iterations. Each iteration is completed according to its project life cycle, beginning with the initial design and progressing to testing and then quality assurance.
  Agile Modeling (AM) is a methodology for modeling and documenting software-based systems. Agile Modeling is critical to the rapid and continuous delivery of software. It is a collection of values, principles, and practices that guide effective, lightweight software modeling.
 Agile Business Analysis (AgileBA) is certification in the form of guidance and training for business analysts seeking to work in agile environments. To support this shift, AgileBA also helps the business analyst relate Agile projects to a wider organizational mission or strategy. To ensure that analysts have the necessary skills and expertise, AgileBA certification was developed.
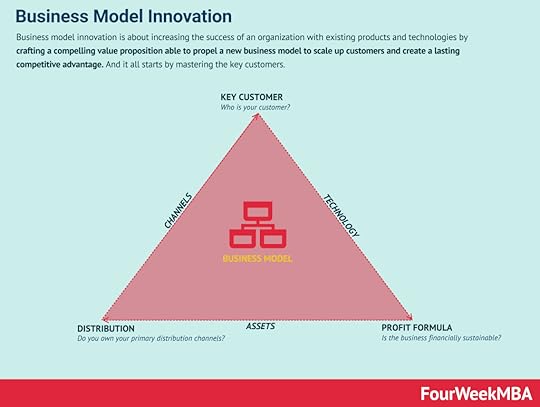 Business model innovation is about increasing the success of an organization with existing products and technologies by crafting a compelling value proposition able to propel a new business model to scale up customers and create a lasting competitive advantage. And it all starts by mastering the key customers.
 That is a process that requires a continuous feedback loop to develop a valuable product and build a viable business model. Continuous innovation is a mindset where products and services are designed and delivered to tune them around the customers’ problem and not the technical solution of its founders.
 A design sprint is a proven five-day process where critical business questions are answered through speedy design and prototyping, focusing on the end-user. A design sprint starts with a weekly challenge that should finish with a prototype, test at the end, and therefore a lesson learned to be iterated.
 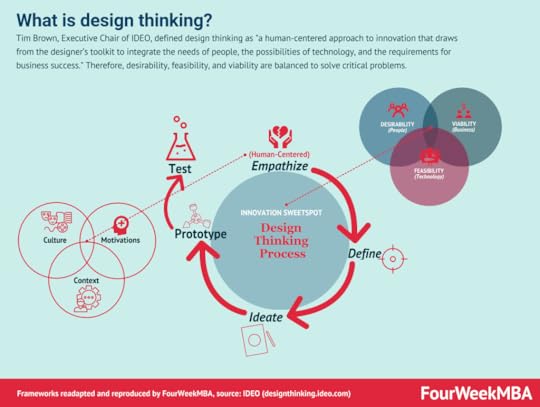 Tim Brown, Executive Chair of IDEO, defined design thinking as “a human-centered approach to innovation that draws from the designer’s toolkit to integrate the needs of people, the possibilities of technology, and the requirements for business success.” Therefore, desirability, feasibility, and viability are balanced to solve critical problems.
  DevOps refers to a series of practices performed to perform automated software development processes. It is a conjugation of the term “development” and “operations” to emphasize how functions integrate across IT teams. DevOps strategies promote seamless building, testing, and deployment of products. It aims to bridge a gap between development and operations teams to streamline the development altogether.
 Product discovery is a critical part of agile methodologies, as its aim is to ensure that products customers love are built. Product discovery involves learning through a raft of methods, including design thinking, lean start-up, and A/B testing to name a few. Dual Track Agile is an agile methodology containing two separate tracks: the “discovery” track and the “delivery” track.
 Feature-Driven Development is a pragmatic software process that is client and architecture-centric. Feature-Driven Development (FDD) is an agile software development model that organizes workflow according to which features need to be developed next.
 eXtreme Programming was developed in the late 1990s by Ken Beck, Ron Jeffries, and Ward Cunningham. During this time, the trio was working on the Chrysler Comprehensive Compensation System (C3) to help manage the company payroll system. eXtreme Programming (XP) is a software development methodology. It is designed to improve software quality and the ability of software to adapt to changing customer needs.
 The Agile methodology has been primarily thought of for software development (and other business disciplines have also adopted it). Lean thinking is a process improvement technique where teams prioritize the value streams to improve it continuously. Both methodologies look at the customer as the key driver to improvement and waste reduction. Both methodologies look at improvement as something continuous.
  A startup company is a high-tech business that tries to build a scalable business model in tech-driven industries. A startup company usually follows a lean methodology, where continuous innovation, driven by built-in viral loops is the rule. Thus, driving growth and building network effects as a consequence of this strategy.
  Kanban is a lean manufacturing framework first developed by Toyota in the late 1940s. The Kanban framework is a means of visualizing work as it moves through identifying potential bottlenecks. It does that through a process called just-in-time (JIT) manufacturing to optimize engineering processes, speed up manufacturing products, and improve the go-to-market strategy.
  RAD was first introduced by author and consultant James Martin in 1991. Martin recognized and then took advantage of the endless malleability of software in designing development models. Rapid Application Development (RAD) is a methodology focusing on delivering rapidly through continuous feedback and frequent iterations.
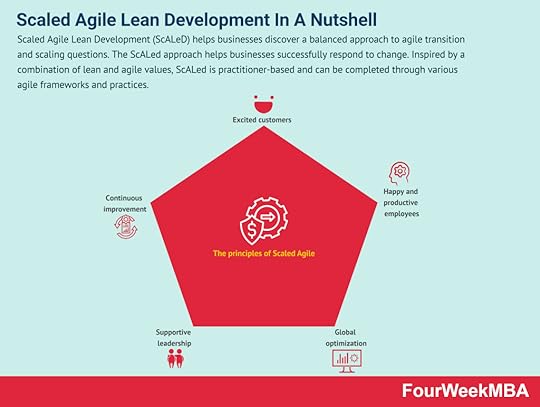 Scaled Agile Lean Development (ScALeD) helps businesses discover a balanced approach to agile transition and scaling questions. The ScALed approach helps businesses successfully respond to change. Inspired by a combination of lean and agile values, ScALed is practitioner-based and can be completed through various agile frameworks and practices.
 The Spotify Model is an autonomous approach to scaling agile, focusing on culture communication, accountability, and quality. The Spotify model was first recognized in 2012 after Henrik Kniberg, and Anders Ivarsson released a white paper detailing how streaming company Spotify approached agility. Therefore, the Spotify model represents an evolution of agile.
  As the name suggests, TDD is a test-driven technique for delivering high-quality software rapidly and sustainably. It is an iterative approach based on the idea that a failing test should be written before any code for a feature or function is written. Test-Driven Development (TDD) is an approach to software development that relies on very short development cycles.
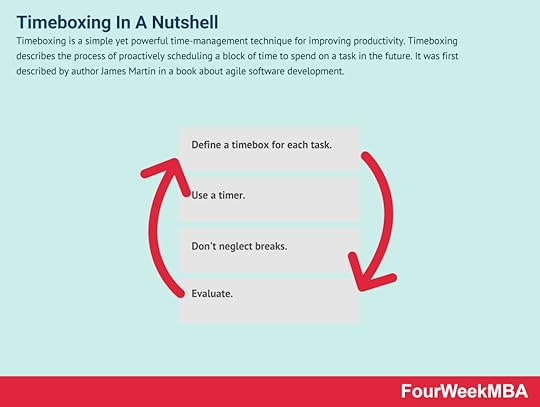 Timeboxing is a simple yet powerful time-management technique for improving productivity. Timeboxing describes the process of proactively scheduling a block of time to spend on a task in the future. It was first described by author James Martin in a book about agile software development.
 Scrum is a methodology co-created by Ken Schwaber and Jeff Sutherland for effective team collaboration on complex products. Scrum was primarily thought for software development projects to deliver new software capability every 2-4 weeks. It is a sub-group of agile also used in project management to improve startups’ productivity.
 Scrum anti-patterns describe any attractive, easy-to-implement solution that ultimately makes a problem worse. Therefore, these are the practice not to follow to prevent issues from emerging. Some classic examples of scrum anti-patterns comprise absent product owners, pre-assigned tickets (making individuals work in isolation), and discounting retrospectives (where review meetings are not useful to really make improvements).
  Scrum at Scale (Scrum@Scale) is a framework that Scrum teams use to address complex problems and deliver high-value products. Scrum at Scale was created through a joint venture between the Scrum Alliance and Scrum Inc. The joint venture was overseen by Jeff Sutherland, a co-creator of Scrum and one of the principal authors of the Agile Manifesto.
 Read Next: MVP, Lean Canvas, Scrum, Design Thinking, VTDF Framework.
Read More: Business Models
Read Next: Business Analysis, Competitor Analysis, Continuous Innovation, Agile Methodology, Lean Startup, Business Model
Main Guides:
Business ModelsBusiness StrategyBusiness DevelopmentDistribution ChannelsMarketing StrategyPlatform Business ModelsNetwork EffectsMain Case Studies:
Amazon Business ModelApple Mission StatementNike Mission Statement Amazon Mission StatementApple DistributionThe post MoSCoW Method In A Nutshell appeared first on FourWeekMBA.
SIPOC Diagram In A Nutshell
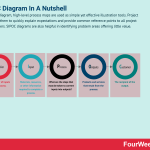

In a SIPOC diagram, high-level process maps are used as simple yet effective illustration tools. Project leaders use them to quickly explain expectations and provide common reference points to all project team members. SIPOC diagrams are also helpful in identifying problem areas offering little value.
Understanding a SIPOC diagramA SIPOC diagram is a tool for documenting and improving business processes. Ultimately, SIPOC diagrams help businesses develop operations that are more efficient and less wasteful. The diagrams are a form of process mapping, where project goals are first identified and then detailed steps devised regarding how they might be achieved.
The five components of a SIPOC diagramSIPOC is an acronym of five components that are included on a SIPOC diagram. Emphasis is given to high-level processes and how they transform inputs (resources) into outputs (products or services).
Here are the five components:
Supplier – the provider of inputs into a process. For a café business, the supplier may be a local roastery or grocery store. Customer requests or feedback can also be classified as suppliers.Input – materials, resources, or other information required to complete a process. Coffee beans and cake are examples of inputs for a café. Electricity and water are also important inputs in the coffee-making process.Process – what are the steps that must be taken to convert inputs into outputs? The café must take customer orders using a point-of-sale system and then convert coffee beans into a hot appetizing beverage.Outputs – or products and services that result from the process. For example, a freshly brewed cup of coffee.Customer – the recipient of the output, such as coffee lovers or morning commuters.How to construct a SIPOC diagram
Constructing a SIPOC diagram is relatively straightforward. To start, create a table with five columns and then label each with one of the five components.
Then, follow these steps:
Write the name of the process in the central column and describe key steps. In describing the steps, remember that SIPOC diagrams describe high-level processes. Keep each step brief by using a flowchart and ensure that the team understands the start and endpoints.Identify the outputs. Describe four or five important outputs using nouns and neutral language to avoid categorizing them as either positive or negative. Businesses can also note customer requirements in this column but again, keep the tone neutral where possible.Identify customers. Who are the stakeholders that will ultimately benefit from the process? If improvements to internal operations are the goal, then employees are the customers. List the inputs required for the process to function at the desired level. The focus should again be on four to five of the most salient.Identify the suppliers for each input described in the previous step.At this point, a business may choose to identify preliminary customer requirements. This step is useful for those incorporating customer requirements into the measure phase of the Six Sigma DMAIC methodology.Lastly, discuss and verify all aspects of the process with sponsors, key stakeholders, and decisions makers.SIPOC diagram examplesIn this section, we will outline some hypothetical examples of SIPOC diagrams.
Car dealershipConsider a car dealership with the following process steps:
Meet with prospective customers.Understand what the customer wants or needs in a new vehicle.Present several different models to customers and test-drive available vehicles.Reach an agreement on any optional extras, total price, and delivery timeframe. Complete paperwork and hand over keys to the new owner.Based on this process, the following SIPOC elements can be defined:
Suppliers – vehicle manufacturers, other component suppliers, gas stations, car washes, and office printer.Inputs – vehicles, optional extras, vehicle fuel, vehicle washes, and client needs worksheet.Process – as described above.Outputs – new customer account, paperwork to state motor transport authority, paperwork to the dealership, paperwork to the vehicle manufacturer, payment for the vehicle, and service notifications.Customers – vehicle purchaser, dealership franchise owner, Department of Motor Vehicles (DMV), and dealership service department.Requirements – color choice, built-to-order, and paperwork that must be filed or submitted within 72 hours. Smoothie caféHere is a SIPOC diagram that describes the process of preparing a made-to-order smoothie:
Suppliers – smoothie requester (customer), smoothie maker, store owner, order taker, and kitchen supervisor.Inputs – smoothie request (order), smoothie recipe, purchase receipt, blender, timer, water, juice, banana, honey, spinach, and ice.Process – receive order, prepare order, prepare (clean, cut, and sort) ingredients, place ingredients in a blender, taste order, and notify customer service staff of order completion.Output – approved purchase, completed order, refreshing smoothie, satisfied customer, tip, and purchase receipt. Customer – thirsty customer, smoothie maker, and store owner (purchaser of ingredients). Mobile application developmentIn this example, let’s describe an enterprise that wants to employ the services of a software development company to develop a mobile app:
Suppliers – enterprise customer, project manager, software development team (programmers, developers, analysts, software quality assurance officers, etc.).Inputs – customer requirements in the form of a functional specification document (FSD) and user requirement specifications (URS), skills and knowledge of the technical personnel, databases, frameworks, hosting services, and all other project management tools.Process – in this case, we’ll describe the process in terms of broad phases of the software development life cycle. Namely: requirement analysis, design, development/coding, testing, release, and maintenance.Outputs – the most obvious output of this process is the mobile application. However, any product or service created at a step that will be used later is also deemed an output in a SIPOC diagram. One example is a requirement document design diagram. Other outputs include a completed project and satisfied client.Customer – in software development, the customer is the enterprise contracting the company’s services as well as the end user of the mobile app. Customers can also encompass the employees on the development team who carry out the process using outputs from the previous step. Thus, customers include users, clients, technical personnel, and third-party individuals. Key takeawaysA SIPOC diagram helps businesses identify the key drivers of high-level process improvement.A SIPOC diagram consists of five components: supplier, input, process, output, and customer. Focus is given to processes and how they transforms inputs into outputs.Constructing a SIPOC diagram is a straightforward affair that favors simplicity. Team members should identify processes using flow charts and keep input and output lists to a maximum of five items. However, those wanting a more detailed analysis can incorporate the Six Sigma DMAIC process.Connected strategic frameworksPESTEL AnalysisThe PESTEL analysis is a framework that can help marketers assess whether macro-economic factors are affecting an organization. This is a critical step that helps organizations identify potential threats and weaknesses that can be used in other frameworks such as SWOT or to gain a broader and better understanding of the overall marketing environment.SWOT Analysis A SWOT Analysis is a framework used for evaluating the business’s Strengths, Weaknesses, Opportunities, and Threats. It can aid in identifying the problematic areas of your business so that you can maximize your opportunities. It will also alert you to the challenges your organization might face in the future.Porter’s Five ForcesPorter’s Five Forces is a model that helps organizations to gain a better understanding of their industries and competition. Published for the first time by Professor Michael Porter in his book “Competitive Strategy” in the 1980s. The model breaks down industries and markets by analyzing them through five forcesGrowth-Share MatrixIn the 1970s, Bruce D. Henderson, founder of the Boston Consulting Group, came up with The Product Portfolio (aka BCG Matrix, or Growth-share Matrix), which would look at a successful business product portfolio based on potential growth and market shares. It divided products into four main categories: cash cows, pets (dogs), question marks, and stars.Root Cause AnalysisThe 5 Whys method is an interrogative problem-solving technique that seeks to understand cause-and-effect relationships. At its core, the technique is used to identify the root cause of a problem by asking the question of why five times. This might unlock new ways to think about a problem and therefore devise a creative solution to solve it. NOISE Analysis
 A NOISE analysis is a strategic planning tool that is a useful alternative to the SWOT analysis. Conversely, the NOISE analysis allows decision-makers to analyze the current state of the business and create a strategic improvement plan. It incorporates solution-focused language that helps teams build upon their knowledge and goals and overcome identified obstacles. SCOC Analysis
 The SCOC analysis is an asset-based strategic planning tool focusing on the core strengths of a business, building upon what it claims to be the shortcomings of a traditional SWOT analysis. Indeed, the SCOC analysis claims that the SWOT analysis focuses on threats that might never materialize, thus underweighting potential opportunities. STEEP Analysis
 The STEEP analysis is a tool used to map the external factors that impact an organization. STEEP stands for the five key areas on which the analysis focuses: socio-cultural, technological, economic, environmental/ecological, and political. Usually, the STEEP analysis is complementary or alternative to other methods such as SWOT or PESTEL analyses.TOWS MatrixThe TOWS Matrix is an acronym for Threats, Opportunities, Weaknesses, and Strengths. The matrix is a variation on the SWOT Analysis, and it seeks to address criticisms of the SWOT Analysis regarding its inability to show relationships between the various categories.
Main Guides:
Business ModelsBusiness StrategyBusiness DevelopmentDistribution ChannelsMarketing StrategyPlatform Business ModelsNetwork EffectsMain Case Studies:
Amazon Business ModelApple Mission StatementNike Mission Statement Amazon Mission StatementApple DistributionThe post SIPOC Diagram In A Nutshell appeared first on FourWeekMBA.
What Is The ERG Theory? The ERG Theory In A Nutshell
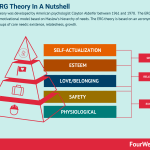

The ERG theory was developed by American psychologist Clayton Alderfer between 1961 and 1978. The ERG theory is a motivational model based on Maslow’s hierarchy of needs. The ERG theory is based on an acronym of three groups of core needs: existence, relatedness, growth.
Understanding the ERG theoryThe ERG theory was developed by American psychologist Clayton Alderfer between 1961 and 1978.
ERG theory is an extension of Maslow’s hierarchy of needs, which Alderfer refined in line with empirical research on motivation over seventeen years. After concluding his research, Alderfer simplified Maslow’s five-level interpretation into a three-level hierarchy.
He also stipulated three fundamental differences to Maslow’s model:
Different levels of need could be pursued simultaneously, with no requirement for an individual to start from the bottom of Maslow’s pyramid and work their way up.The order of needs were not fixed but instead varied from person to person.The ERG theory also noted that if a higher level need remained unfulfilled, the individual could regress to a lower level need to increase satisfaction. This became known as the frustration-regression principle.In the context of employee motivation, Alderfer suggested the frustration-regression principle negatively impacts motivation and personal growth. As a result, the ERG theory has an important role to play in employee morale, productivity, and predicting sources of workplace conflict.
More broadly speaking, Alderfer’s work may also be useful to analyze different leadership styles or help employees transition through change.
The three groups of needs comprising the ERG theoryThe ERG theory is based on an acronym of three groups of core needs. These are:
Existence – or the basic material requirements for living. Maslow categorized these as physiological needs (food, water, shelter) and safety needs (health, employment, property). When these needs are met in the workplace, they remove distractions and boost productivity. Relatedness – or needs related to the maintenance of interpersonal relationships. These needs align with Maslow’s third and fourth levels which encompass friendship, family, intimacy and gaining the respect of others. In a work environment, relatedness is a need to have satisfactory or mutually beneficial relationships with colleagues, superiors, or subordinates.Growth – or the need for personal development through meaningful or creative work. This is an intrinsic desire for most people and has obvious benefits in workplace and non-workplace settings. Growth is related to Maslow’s upper level which contains self-esteem, self-confidence, discovery, morality, and achievement.It’s also important to note that each of the three groups has been studied extensively since the ERG theory was released.
With their effectiveness verified several times over, the most successful organisations will be those that create an environment where all three levels are available to every employee at all times.
ERG theory examplesTo conclude, we will share two representative examples of how ERG theory can be used to assist employees and organizations.
Start-up entrepreneurThe life of a start-up entrepreneur (and indeed the start-up itself) is almost exactly aligned with the key components of ERG theory.
In the early days of the venture, the entrepreneur and business endeavor to meet basic needs.
For the individual, this may be a living salary that pays the bills. For the business, its needs are raw materials, electricity, and a physical or online presence to conduct operations.
With these important needs in place, the start-up can establish a presence in the market, develop relationships with suppliers, and collaborate with other institutions to innovate and increase sales.
With their basic needs covered, the start-up founder can start to create a professional network and hire the best talent to share their immense workload.
In the third and final growth stage, the start-up founder is supported by a team of subordinates who attend to less critical needs.
This frees them up to fulfil their potential in areas where they can make the most impact. For the business, growth tends to be characterized by market leadership, better margins, and increased size.
Unmotivated employeeThe ERG theory can also be used to tackle the problem of unmotivated employees. For better or worse, many employees earn a salary that covers basic survival needs such as food and shelter but little else.
Those who are worried about paying their mortgage each month tend to be less interested in socializing with others since it is too expensive to do so. However, a lack of socialization causes a deficiency in the second basic need of relatedness.
This may result in the employee feeling excluded from social circles at work which then causes a decrease in collaboration, motivation, and productivity.
To enable the employee to meet the needs of relatedness and growth, the business could look at more inclusive work practices and, if their performance merits it, a promotion or salary increase.
Businesses are now also turning to companies such as Nudge that provide financial literacy training to increase the well-being of employees.
Alternatively, the business could ask the employee whether they would be open to moving into another position or department.
Finding themselves in a role that better suits their unique skillset, they may become more motivated to engage with other employees and work productively toward organizational goals.
Career choicesIn the final example, consider an employee who wants to determine the best career choice for their needs and skills.
The individual starts with existence-related needs to first determine how much money they require to cover their expenses.
Based on this information, industries with average salaries in the desired range can be identified.
In terms of relatedness, the person thinks about their social needs and whether they are introverted or extroverted.
They also look for employers with desirable workplace cultures where managers and subordinates work collaboratively.
Lastly, the potential for career development and opportunities to advance within the company is assessed.
Since the individual works best under pressure where every day is different from the next, they look for dynamic businesses with ambitious mission statements and objectives.
Key takeaways:The ERG theory is a motivational model developed by American psychologist Clayton Alderfer and is the result of seventeen years of empirical research.The ERG theory was developed in the context of employee motivation, but it may also have applications in change management, conflict resolution, and leadership style influence.The ERG theory is based on three core needs: existence, relatedness, and growth. For maximum organizational effectiveness, each need must be available to every employee at all times.Connected Business Frameworks To The ERG Theory Maslow’s Hierarchy of Needs was developed by American psychologist Abraham Maslow. His hierarchy, often depicted in the shape of a pyramid, helped explain his research on basic human needs and desires. In marketing, the hierarchy (and its basis in psychology) can be used to market to specific groups of people based on their similarly specific needs, desires, and resultant actions.
 Transformational leadership is a style of leadership that motivates, encourages, and inspires employees to contribute to company growth. Leadership expert James McGregor Burns first described the concept of transformational leadership in a 1978 book entitled Leadership. Although Burns’ research was focused on political leaders, the term is also applicable for businesses and organizational psychology.
 Monroe’s motivated sequence was created by American psychologist Alan Monroe, who had an interest in persuasive speech delivery. Monroe’s motivated sequence uses the psychology of persuasion to develop an outline for delivering speeches.
 The SQ3R method is a reading comprehension strategy that promotes enhanced learning. The SQ3R method was first proposed by educational psychologist Francis P. Robinson in his book Effective Study. The method was originally designed for college students as a more efficient and active means of absorbing textbook information. However, it is useful in any scenario where the retention of information is important. This allows the reader to learn effectively and make the best use of their time.
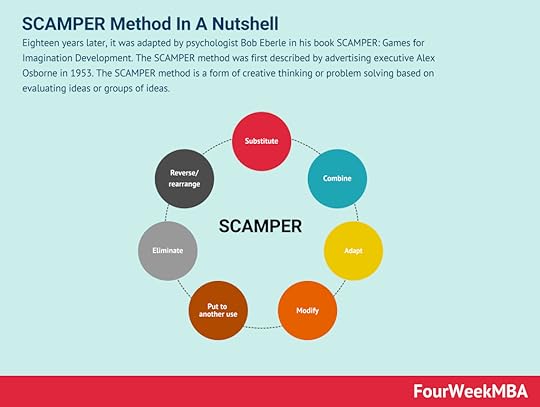 Eighteen years later, it was adapted by psychologist Bob Eberle in his book SCAMPER: Games for Imagination Development. The SCAMPER method was first described by advertising executive Alex Osborne in 1953. The SCAMPER method is a form of creative thinking or problem solving based on evaluating ideas or groups of ideas.
 The Pygmalion effect is a psychological phenomenon where higher expectations lead to an increase in performance. The Pygmalion effect was defined by psychologist Robert Rosenthal, who described it as “the phenomenon whereby one person’s expectation for another person’s behavior comes to serve as a self-fulfilling prophecy.”
 The recognition heuristic is a psychological model of judgment and decision making. It is part of a suite of simple and economical heuristics proposed by psychologists Daniel Goldstein and Gerd Gigerenzer. The recognition heuristic argues that inferences are made about an object based on whether it is recognized or not.
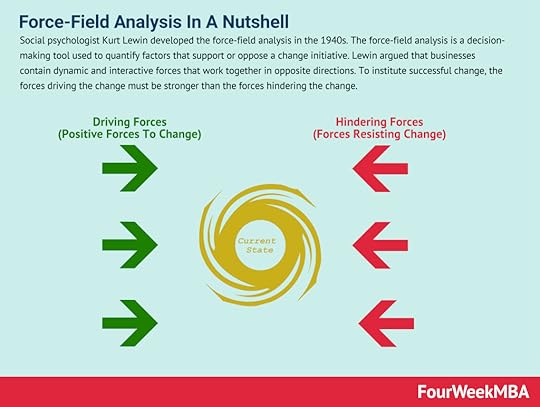 Social psychologist Kurt Lewin developed the force-field analysis in the 1940s. The force-field analysis is a decision-making tool used to quantify factors that support or oppose a change initiative. Lewin argued that businesses contain dynamic and interactive forces that work together in opposite directions. To institute successful change, the forces driving the change must be stronger than the forces hindering the change.
Main Free Guides:
Business ModelsBusiness StrategyBusiness DevelopmentDigital Business ModelsDistribution ChannelsMarketing StrategyPlatform Business ModelsTech Business ModelThe post What Is The ERG Theory? The ERG Theory In A Nutshell appeared first on FourWeekMBA.
What Is A Competing Values Framework? The Competing Value Framework In A Nutshell

The competing values framework was created by Robert Quinn and John Rohrbaugh, emerging from research into the major characteristics of effective organizations. The competing values framework is a tool used to understand and characterize organizational behaviors and beliefs and how they contribute to success.
Understanding the competing values frameworkBased on the study of culture, leadership, structure, and information processing, Quinn and Rohrbaugh discovered 39 different indicators of effectiveness. These were then analyzed for patterns and distilled into two major dimensions of organizational success:
Organizational focus – which may be internal or external. Some companies focused on internal processes to achieve success, while others achieved similar results by maintaining a focus on competitive advantage and rivalry.Organizational structure – is the business flexible or does it prioritize stability? The researchers found that some companies were successful because they were adaptable and agile. Conversely, some succeeded because of stable leadership and process orientation.The competing values framework has been recognized as one of the 40 most important frameworks in the history of business. It has wide-ranging applications in leadership competency, organizational culture, financial strategy, information processing, and life cycle stage development.
The four major models of the competing values frameworkFour major models, or cultural archetypes, are derived from the degree to which a company is internally or externally focused and flexible or stable.
The interaction between each archetype appears to send conflicting messages, which gives the competing values framework its name. For instance, an organization may need to be flexible while also displaying control and stability at the same time.
With that said, let’s take a look at each archetype below:
Clan (collaborative) – an organization underpinned by shared values such as stability, cohesion, and participation. The culture is dominated by an emphasis on personal development, mentorship, empathy, and openness. Company effectiveness is also bolstered by risk aversion.Adhocracy (creative) – adhocracies are innovative, externally focussed, and flexible. Creative and diverse ideas drive the company forward because leadership is not afraid to take risks. This type of organization is supremely adept at navigating uncertainty, ambiguity, and instability. Hierarchy (controlling) – these organizations are focused internally and owe their success to control, order, and continuous improvement. Culture is overtly formal and procedural. Leadership makes long-term predictions based on efficient, capable, and stable processes that are known quantities.Market (competing) – competing companies are driven by profitability, market share, and goal achievement. Success is acquired with an aggressive and decisive mindset that is energized by the presence of competitors. Winning through hard work and productivity is actively pursued. With a relatively stable structure, market organizations create a strong brand identity by delivering high customer value.The competing values framework and leadershipThe organizational values of the framework can also be used to model leadership styles.
Below is a brief look at some leadership types based on the hierarchies listed in the previous section:
Mentor, team builder, facilitator (Clan) – these leaders value development, communication, and commitment. Innovator, visionary, entrepreneur (Adhocracy) – these leaders preach values around agility, transformation, and innovation.Coordinator, organizer, monitor (Hierarchy) – these leaders prefer consistency, uniformity, predictability, timeliness, and efficiency.Producer, competitor, go-getter (Market) – these leaders are primarily concerned with attaining dominant market share, goal attainment, and profitability.Competing values framework examplesTo conclude, we’ll discuss some examples from each of the four main archetypes of the competing values framework.
1 – Clan (collaborative)The clan culture is often found in start-ups and smaller companies, but it can also be found in companies that employ the franchise model.
One particular example is Tom’s of Maine, an American business and Certified B Corporation that manufactures natural health products such as toothpaste, soap, and deodorant.
Founder Tom Chappell stressed the importance of respectful relationships between co-workers, customers, owners, suppliers, the community, and the environment.
Employees are provided with a safe environment to grow and learn and the culture is more reminiscent of an extended family, with Chappell serving as a mentor and parental figure to subordinates.
2 – Adhocracy (creative)Pixar has a flat organizational structure which creates the ideal conditions for adhocracy to thrive.
The company has a proven track record of both artistic and technological innovations and is known as a leading pioneer in computer animation.
Pixar is proud to proclaim that, unlike its competitors, it has never purchased scripts or ideas from external parties.
All of the company’s worlds and stories from movies such as Toy Story, Finding Nemo, and Cars came from a creative team who were encouraged to take risks and push the metaphorical envelope.
Indeed, Pixar understands that true creative talent is rare and that management’s role is to not avoid risk entirely but ensure the company can recover easily when inevitable failures occur.
3 – Hierarchy (controlling)Most investment banks such as Goldman Sachs operate under the hierarchical model with a strict and inflexible structure.
Each is characterized by the following levels with only minor derivations between companies:
Intern.Analyst.Associate.Vice President.Director or Senior Vice President, andManaging Director.Each level is associated with certain rituals, benefits, and responsibilities, and employees need to be competitive and possess extreme levels of attention to detail.
Progression through these levels is well defined and has not changed considerably over time.
To encourage employees to work under the intense pressure of a hierarchical structure, promotions are frequent and there is little exclusivity to the titles in most investment banks.
Goldman Sachs, for example, has over 10,000 vice presidents and many firms also have thousands of managing directors.
4 – Market (competing)Amazon is an oft-cited example of the market culture. Numerous former employees have spoken about a culture that expected the very best they could deliver and to be constantly climbing the ladder.
There were also claims in a 2015 New York Times article that if employees hit the wall – a phrase used to describe one reaching their emotional or physical limits – they were told the only solution was to “climb the wall”.
While the company has made efforts to address its controversial culture in recent years, Amazon’s obvious focus to be the best means it embodies the best (and worst) aspects of the market model for now.
One look at the company’s leadership principles confirms this, with the blurb under the “Deliver results” principle reading as follows: “Leaders focus on the key inputs for their business and deliver them with the right quality and in a timely fashion. Despite setbacks, they rise to the occasion and never settle.”
Key takeaways:The competing values framework categorizes the values, beliefs, and behaviors that make up organizational and individual success.The competing values framework measures success in terms of organizational structure and focus, two dimensions based on the quantitative analysis of 39 effectiveness indicators.The competing values framework suggests four different archetypes, with each displaying varying degrees of structure and focus. They are clan, adhocracy, hierarchy, and market. The framework also details the leadership styles that thrive in each archetype.Connected Strategy FrameworksPorter’s Five Forces Porter’s Five Forces is a model that helps organizations to gain a better understanding of their industries and competition. Published for the first time by Professor Michael Porter in his book “Competitive Strategy” in the 1980s. The model breaks down industries and markets by analyzing them through five forcesAnsoff Matrix
 You can use the Ansoff Matrix as a strategic framework to understand what growth strategy is more suited based on the market context. Developed by mathematician and business manager Igor Ansoff, it assumes a growth strategy can be derived by whether the market is new or existing, and the product is new or existing.Blitzscaling Canvas
 The Blitzscaling business model canvas is a model based on the concept of Blitzscaling, which is a particular process of massive growth under uncertainty, and that prioritizes speed over efficiency and focuses on market domination to create a first-scaler advantage in a scenario of uncertainty.Business Analysis Framework
 Business analysis is a research discipline that helps driving change within an organization by identifying the key elements and processes that drive value. Business analysis can also be used in Identifying new business opportunities or how to take advantage of existing business opportunities to grow your business in the marketplace.Gap Analysis
 A gap analysis helps an organization assess its alignment with strategic objectives to determine whether the current execution is in line with the company’s mission and long-term vision. Gap analyses then help reach a target performance by assisting organizations to use their resources better. A good gap analysis is a powerful tool to improve execution.Business Model Canvas
 The business model canvas is a framework proposed by Alexander Osterwalder and Yves Pigneur in Busines Model Generation enabling the design of business models through nine building blocks comprising: key partners, key activities, value propositions, customer relationships, customer segments, critical resources, channels, cost structure, and revenue streams.Lean Startup Canvas
 The lean startup canvas is an adaptation by Ash Maurya of the business model canvas by Alexander Osterwalder, which adds a layer that focuses on problems, solutions, key metrics, unfair advantage based, and a unique value proposition. Thus, starting from mastering the problem rather than the solution.Digital Marketing Circle
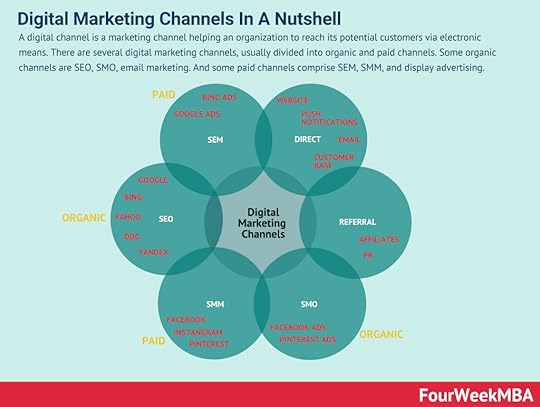 A digital channel is a marketing channel, part of a distribution strategy, helping an organization to reach its potential customers via electronic means. There are several digital marketing channels, usually divided into organic and paid channels. Some organic channels are SEO, SMO, email marketing. And some paid channels comprise SEM, SMM, and display advertising.Blue Ocean Strategy
 A blue ocean is a strategy where the boundaries of existing markets are redefined, and new uncontested markets are created. At its core, there is value innovation, for which uncontested markets are created, where competition is made irrelevant. And the cost-value trade-off is broken. Thus, companies following a blue ocean strategy offer much more value at a lower cost for the end customers.
Main Free Guides:
Business ModelsBusiness StrategyBusiness DevelopmentDigital Business ModelsDistribution ChannelsMarketing StrategyPlatform Business ModelsTech Business ModelThe post What Is A Competing Values Framework? The Competing Value Framework In A Nutshell appeared first on FourWeekMBA.
September 9, 2022
What Is The Anchoring Effect And Why It Matters In Business
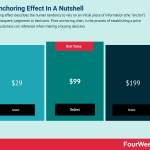

The anchoring effect describes the human tendency to rely on an initial piece of information (the “anchor”) to make subsequent judgments or decisions. Price anchoring, then, is the process of establishing a price point that customers can reference when making a buying decision.
Understanding the anchoring effectThe anchoring effect is part of an entire field of study researching how the brain determines value. Dubbed neuroeconomics, the field is a mixture of economics, psychology, and neuroscience and how these disciplines play a role in human decision making.
Indeed, the anchoring effect is a powerful strategy that businesses can and do use to influence consumer behavior.
When a price anchor is established, it gives the consumer a frame of reference for valuing the product. In a $100 pair of shoes that is discounted to $75, the original asking price of $100 is the anchor point. It allows the consumer to deduce that the shoes have been discounted by 25%. More importantly, it leads them to believe that they are receiving a good deal.
PerceptionWithin reason, the definition of a “cheap” or “expensive” product is open to interpretation. In other words, price is always relative and judged after comparison to similar products. Since consumers tend to desire the highest reward for the least amount of money or effort, marketers can use this to their advantage.
For example, a cloud storage company could offer a premium plan of $1,000 per month with unlimited storage and a standard plan of $200 per month offering 750 gigabytes of storage. Most consumers will sign up for the standard plan because they don’t need unlimited storage. Because of the $1,000 price anchor, they’ll also believe they are saving $800 a month. The business, on the other hand, deliberately created the premium plan to make the standard plan look more attractive in comparison. In this scenario, it is a win-win for both parties.
The power of suggestionPrice anchoring is also effective when there are a large variety of products. With such variety, some consumers have difficulty making decisions on what to buy. Their decision anxiety is such that they might walk away from the purchase altogether.
Businesses can use the bandwagon effect and price anchoring to relieve this anxiety. For example, a bookstore may feature a bestseller section with popular books and an anchor price of $20. Here, the anchor price provides a frame of reference for the consumer who may have only wanted to spend $15. But since many other consumers are buying books at this price, it must represent value for money. This in turn reduces decision-anxiety because the consumer assures themselves that the $20 price anchor is a good one.
A tendency to avoid extremesAs a general rule, consumers like to avoid extremes. Most will order a medium coffee in a cafe instead of a small or large one. This tendency to sit in the middle is something that businesses exploit through price anchoring.
Consider the example of a hosting company that offers three levels of hosting – basic, premium, and professional. Here, the company effectively uses the price of the basic and professional level packages as an anchor to push consumers to the premium level. Regardless of industry, businesses that offer a complete range of products can take advantage of this tendency to avoid extremities. Instead, the consumer is directed to the product that the business wants them to purchase.
Key takeaways:The anchoring effect is a basic human tendency to rely on initial information (the “anchor”) to make future decisions. Price anchoring is therefore the process of using an initial price to influence consumer purchasing decisions.Businesses can use the anchoring effect to influence consumer buying behavior through exploiting cognitive biases and tendencies.The anchoring effect allows businesses to direct consumers to a target product. This is achieved through perception, suggestion, and avoiding extremes.Connected Business Concepts As highlighted by German psychologist Gerd Gigerenzer in the paper “Heuristic Decision Making,” the term heuristic is of Greek origin, meaning “serving to find out or discover.” More precisely, a heuristic is a fast and accurate way to make decisions in the real world, which is driven by uncertainty.
 Bounded rationality is a concept attributed to Herbert Simon, an economist and political scientist interested in decision-making and how we make decisions in the real world. In fact, he believed that rather than optimizing (which was the mainstream view in the past decades) humans follow what he called satisficing.
 Second-order thinking is a means of assessing the implications of our decisions by considering future consequences. Second-order thinking is a mental model that considers all future possibilities. It encourages individuals to think outside of the box so that they can prepare for every and eventuality. It also discourages the tendency for individuals to default to the most obvious choice.
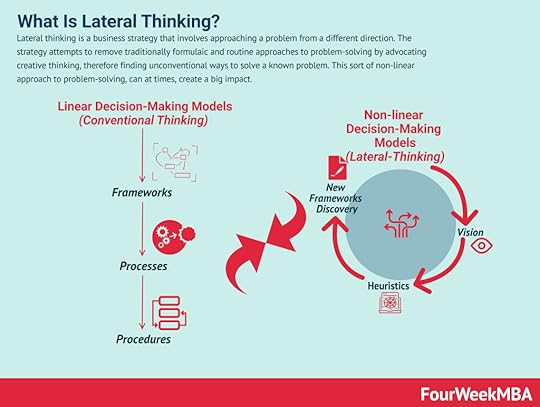 Lateral thinking is a business strategy that involves approaching a problem from a different direction. The strategy attempts to remove traditionally formulaic and routine approaches to problem-solving by advocating creative thinking, therefore finding unconventional ways to solve a known problem. This sort of non-linear approach to problem-solving, can at times, create a big impact.
 Moonshot thinking is an approach to innovation, and it can be applied to business or any other discipline where you target at least 10X goals. That shifts the mindset, and it empowers a team of people to look for unconventional solutions, thus starting from first principles, by leveraging on fast-paced experimentation.
 The concept of cognitive biases was introduced and popularized by the work of Amos Tversky and Daniel Kahneman in 1972. Biases are seen as systematic errors and flaws that make humans deviate from the standards of rationality, thus making us inept at making good decisions under uncertainty.
 The Dunning-Kruger effect describes a cognitive bias where people with low ability in a task overestimate their ability to perform that task well. Consumers or businesses that do not possess the requisite knowledge make bad decisions. What’s more, knowledge gaps prevent the person or business from seeing their mistakes.
 Occam’s Razor states that one should not increase (beyond reason) the number of entities required to explain anything. All things being equal, the simplest solution is often the best one. The principle is attributed to 14th-century English theologian William of Ockham.
 The Mandela effect is a phenomenon where a large group of people remembers an event differently from how it occurred. The Mandela effect was first described in relation to Fiona Broome, who believed that former South African President Nelson Mandela died in prison during the 1980s. While Mandela was released from prison in 1990 and died 23 years later, Broome remembered news coverage of his death in prison and even a speech from his widow. Of course, neither event occurred in reality. But Broome was later to discover that she was not the only one with the same recollection of events.
 The crowding-out effect occurs when public sector spending reduces spending in the private sector.
 The bandwagon effect tells us that the more a belief or idea has been adopted by more people within a group, the more the individual adoption of that idea might increase within the same group. This is the psychological effect that leads to herd mentality. What is marketing can be associated with social proof.
Read Next: Biases, Bounded Rationality, Mandela Effect, Dunning-Kruger
Read Next: Heuristics, Biases.
Learn also:
Speed-Reversibility MatrixGrowth-Share MatrixAnsoff MatrixDigital Strategy MatrixDunning-Kruger EffectLindy EffectCrowding-Out EffectBandwagon EffectLearn more:
Distribution ChannelsTypes of Business Models You Need to KnowBusiness Strategy: Definition, Examples, And Case StudiesMarketing Strategy: Definition, Types, And ExamplesPlatform Business Models In A NutshellNetwork Effects In A NutshellGross Margin In A NutshellThe post What Is The Anchoring Effect And Why It Matters In Business appeared first on FourWeekMBA.


