
SIPOC Diagram In A Nutshell

In a SIPOC diagram, high-level process maps are used as simple yet effective illustration tools. Project leaders use them to quickly explain expectations and provide common reference points to all project team members. SIPOC diagrams are also helpful in identifying problem areas offering little value.
Understanding a SIPOC diagramA SIPOC diagram is a tool for documenting and improving business processes. Ultimately, SIPOC diagrams help businesses develop operations that are more efficient and less wasteful. The diagrams are a form of process mapping, where project goals are first identified and then detailed steps devised regarding how they might be achieved.
The five components of a SIPOC diagramSIPOC is an acronym of five components that are included on a SIPOC diagram. Emphasis is given to high-level processes and how they transform inputs (resources) into outputs (products or services).
Here are the five components:
Supplier – the provider of inputs into a process. For a café business, the supplier may be a local roastery or grocery store. Customer requests or feedback can also be classified as suppliers.Input – materials, resources, or other information required to complete a process. Coffee beans and cake are examples of inputs for a café. Electricity and water are also important inputs in the coffee-making process.Process – what are the steps that must be taken to convert inputs into outputs? The café must take customer orders using a point-of-sale system and then convert coffee beans into a hot appetizing beverage.Outputs – or products and services that result from the process. For example, a freshly brewed cup of coffee.Customer – the recipient of the output, such as coffee lovers or morning commuters.How to construct a SIPOC diagram
Constructing a SIPOC diagram is relatively straightforward. To start, create a table with five columns and then label each with one of the five components.
Then, follow these steps:
Write the name of the process in the central column and describe key steps. In describing the steps, remember that SIPOC diagrams describe high-level processes. Keep each step brief by using a flowchart and ensure that the team understands the start and endpoints.Identify the outputs. Describe four or five important outputs using nouns and neutral language to avoid categorizing them as either positive or negative. Businesses can also note customer requirements in this column but again, keep the tone neutral where possible.Identify customers. Who are the stakeholders that will ultimately benefit from the process? If improvements to internal operations are the goal, then employees are the customers. List the inputs required for the process to function at the desired level. The focus should again be on four to five of the most salient.Identify the suppliers for each input described in the previous step.At this point, a business may choose to identify preliminary customer requirements. This step is useful for those incorporating customer requirements into the measure phase of the Six Sigma DMAIC methodology.Lastly, discuss and verify all aspects of the process with sponsors, key stakeholders, and decisions makers.SIPOC diagram examplesIn this section, we will outline some hypothetical examples of SIPOC diagrams.
Car dealershipConsider a car dealership with the following process steps:
Meet with prospective customers.Understand what the customer wants or needs in a new vehicle.Present several different models to customers and test-drive available vehicles.Reach an agreement on any optional extras, total price, and delivery timeframe. Complete paperwork and hand over keys to the new owner.Based on this process, the following SIPOC elements can be defined:
Suppliers – vehicle manufacturers, other component suppliers, gas stations, car washes, and office printer.Inputs – vehicles, optional extras, vehicle fuel, vehicle washes, and client needs worksheet.Process – as described above.Outputs – new customer account, paperwork to state motor transport authority, paperwork to the dealership, paperwork to the vehicle manufacturer, payment for the vehicle, and service notifications.Customers – vehicle purchaser, dealership franchise owner, Department of Motor Vehicles (DMV), and dealership service department.Requirements – color choice, built-to-order, and paperwork that must be filed or submitted within 72 hours. Smoothie caféHere is a SIPOC diagram that describes the process of preparing a made-to-order smoothie:
Suppliers – smoothie requester (customer), smoothie maker, store owner, order taker, and kitchen supervisor.Inputs – smoothie request (order), smoothie recipe, purchase receipt, blender, timer, water, juice, banana, honey, spinach, and ice.Process – receive order, prepare order, prepare (clean, cut, and sort) ingredients, place ingredients in a blender, taste order, and notify customer service staff of order completion.Output – approved purchase, completed order, refreshing smoothie, satisfied customer, tip, and purchase receipt. Customer – thirsty customer, smoothie maker, and store owner (purchaser of ingredients). Mobile application developmentIn this example, let’s describe an enterprise that wants to employ the services of a software development company to develop a mobile app:
Suppliers – enterprise customer, project manager, software development team (programmers, developers, analysts, software quality assurance officers, etc.).Inputs – customer requirements in the form of a functional specification document (FSD) and user requirement specifications (URS), skills and knowledge of the technical personnel, databases, frameworks, hosting services, and all other project management tools.Process – in this case, we’ll describe the process in terms of broad phases of the software development life cycle. Namely: requirement analysis, design, development/coding, testing, release, and maintenance.Outputs – the most obvious output of this process is the mobile application. However, any product or service created at a step that will be used later is also deemed an output in a SIPOC diagram. One example is a requirement document design diagram. Other outputs include a completed project and satisfied client.Customer – in software development, the customer is the enterprise contracting the company’s services as well as the end user of the mobile app. Customers can also encompass the employees on the development team who carry out the process using outputs from the previous step. Thus, customers include users, clients, technical personnel, and third-party individuals. Key takeawaysA SIPOC diagram helps businesses identify the key drivers of high-level process improvement.A SIPOC diagram consists of five components: supplier, input, process, output, and customer. Focus is given to processes and how they transforms inputs into outputs.Constructing a SIPOC diagram is a straightforward affair that favors simplicity. Team members should identify processes using flow charts and keep input and output lists to a maximum of five items. However, those wanting a more detailed analysis can incorporate the Six Sigma DMAIC process.Connected strategic frameworksPESTEL Analysis The PESTEL analysis is a framework that can help marketers assess whether macro-economic factors are affecting an organization. This is a critical step that helps organizations identify potential threats and weaknesses that can be used in other frameworks such as SWOT or to gain a broader and better understanding of the overall marketing environment.SWOT Analysis
 A SWOT Analysis is a framework used for evaluating the business’s Strengths, Weaknesses, Opportunities, and Threats. It can aid in identifying the problematic areas of your business so that you can maximize your opportunities. It will also alert you to the challenges your organization might face in the future.Porter’s Five Forces
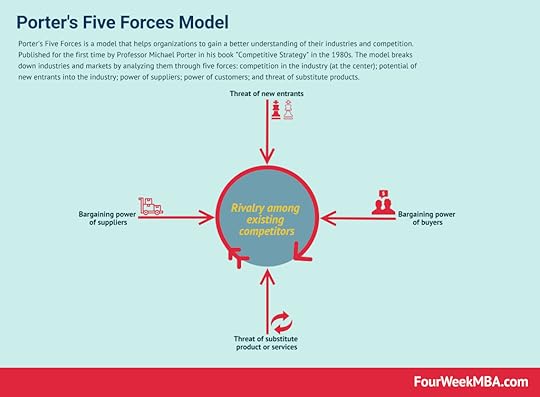 Porter’s Five Forces is a model that helps organizations to gain a better understanding of their industries and competition. Published for the first time by Professor Michael Porter in his book “Competitive Strategy” in the 1980s. The model breaks down industries and markets by analyzing them through five forcesGrowth-Share Matrix
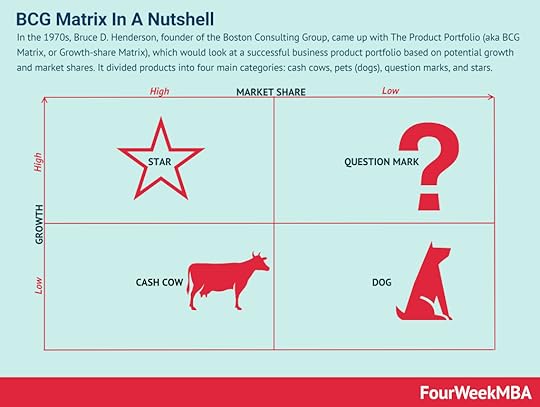 In the 1970s, Bruce D. Henderson, founder of the Boston Consulting Group, came up with The Product Portfolio (aka BCG Matrix, or Growth-share Matrix), which would look at a successful business product portfolio based on potential growth and market shares. It divided products into four main categories: cash cows, pets (dogs), question marks, and stars.Root Cause Analysis
 The 5 Whys method is an interrogative problem-solving technique that seeks to understand cause-and-effect relationships. At its core, the technique is used to identify the root cause of a problem by asking the question of why five times. This might unlock new ways to think about a problem and therefore devise a creative solution to solve it. NOISE Analysis
 A NOISE analysis is a strategic planning tool that is a useful alternative to the SWOT analysis. Conversely, the NOISE analysis allows decision-makers to analyze the current state of the business and create a strategic improvement plan. It incorporates solution-focused language that helps teams build upon their knowledge and goals and overcome identified obstacles. SCOC Analysis
 The SCOC analysis is an asset-based strategic planning tool focusing on the core strengths of a business, building upon what it claims to be the shortcomings of a traditional SWOT analysis. Indeed, the SCOC analysis claims that the SWOT analysis focuses on threats that might never materialize, thus underweighting potential opportunities. STEEP Analysis
 The STEEP analysis is a tool used to map the external factors that impact an organization. STEEP stands for the five key areas on which the analysis focuses: socio-cultural, technological, economic, environmental/ecological, and political. Usually, the STEEP analysis is complementary or alternative to other methods such as SWOT or PESTEL analyses.TOWS Matrix
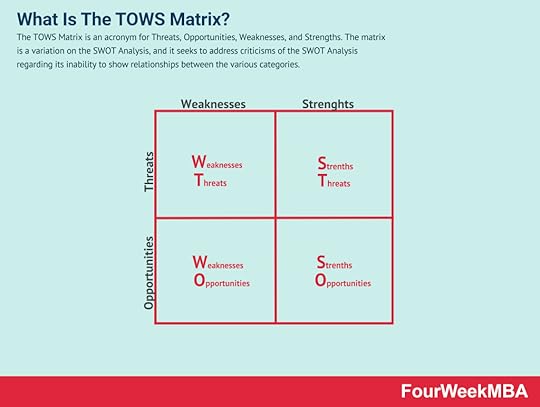 The TOWS Matrix is an acronym for Threats, Opportunities, Weaknesses, and Strengths. The matrix is a variation on the SWOT Analysis, and it seeks to address criticisms of the SWOT Analysis regarding its inability to show relationships between the various categories.
Main Guides:
Business ModelsBusiness StrategyBusiness DevelopmentDistribution ChannelsMarketing StrategyPlatform Business ModelsNetwork EffectsMain Case Studies:
Amazon Business ModelApple Mission StatementNike Mission Statement Amazon Mission StatementApple DistributionThe post SIPOC Diagram In A Nutshell appeared first on FourWeekMBA.


