
Stacia Misner's Blog
March 25, 2023
Visual Studio Live! Las Vegas
Many thanks to everyone who attended either or both of my sessions in Las Vegas on March 21, 2023. I enjoyed meeting many of you and look forward to crossing paths again in the future!
I have placed the sample files that I used in my demonstrations in GitHub. If you have any questions, please add a comment below and I’ll reply as soon as I am able.


June 25, 2019
Conquering the Chaos with Data Governance for Power BI
Many years before Power BI, there was Power Pivot. (Bonus points
for you if you remember that back then that it was known as PowerPivot.) I
remember attending a Birds of a Feather session at Microsoft TechEd to discuss
the implications of Power Pivot with a group of data professionals. There was
much gnashing of teeth over the perceived horrors of putting data directly into
the hands of users. Then, at the back of the room, a very relaxed gentleman, with
flowing locks and wearing a Hawaiian shirt and Birkenstocks, suggested in the
most soothing of tones, “Hey man, just let the data be free!”
I’ve never forgotten that scene and how it epitomized both the
goals and challenges of self-service business intelligence. On the one hand,
the self-service ideal is to free up data to empower users to discover and use
information in insightful ways. On the other hand, there are legitimate reasons
to control how people access, use, and share data.
Whereas traditional BI imposes many important controls on the
structure, composition, and consumption of data, the process often had
difficulty keeping up with the speed of business. While self-service tools can
accelerate the development and delivery of information to users, the lack of
controls had reintroduced the very problems that traditional BI was supposed to
solve: incomplete and inaccurate data, inconsistent calculations, hard to
repeat processes, and multiple versions of the truth. In short, chaos.
If you’re currently using Power BI and find yourself facing these
very problems, what can you do to conquer the chaos? Implement a data
governance strategy that strikes a balance between an IT-managed information
solution and user-driven exploration of data. Fortunately, Power BI has evolved
over the years since its initial incarnation as Power Pivot to include many
features that can support your data governance goals.
Data governance is a huge subject area and a specific
implementation approach is dependent on many factors, including organization
size, user skills, types of data in use, and the self-service tools available,
to name a few. My intent today is not to provide a comprehensive overview of
data governance in Power BI, but simply to give you a starting point for your
own implementation strategy with specific tactics that leverage features in
Power BI for better data governance.
One of the most important goals of data governance is to ensure
that the data in any shared spreadsheet, report, or dashboard is complete,
accurate, and consistent no matter what. That’s a lofty goal to try to apply to
all data assets in an organization. Instead, make a distinction between shared
data assets for organizational or departmental use and other data assets that
are developed for personal exploration, and then set up policies and processes
that support both use cases. That way, users can work with the data they feel is appropriate for the
question at hand, but can also easily identify sources that have been
officially approved. Importantly, users should be trained in the policies
related to the certification process and understand how the content they create
should be used and shared.
Towards this end, consider the following actions:
Provide
users with a sandbox environment in which they can combine data sources that
they are allowed to access and experiment with different types of calculations
or different ways to present the data.
Power BI has always included the components
necessary for a sandbox environment, regardless if users choose to work in the
desktop application or in a browser accessing the Power BI service online. Each
user can work in an isolated space and has complete freedom to access a wide
variety of data sources, whether certified or not.
If the content is saved or
published to the Power BI service, it stays within the user’s personal
environment called My Workspace. The user may later decide to share the content
with others in a few different ways, as described in ways
to share your work. You can control whether, and how,
content can be shared in the Tenant
Settings page of the Power BI admin portal.
Assign oversight responsibility to at least one individual per department
or subject area. This individual, commonly known as a data steward, reviews
data sources, validates report logic, watches for and eliminates duplicative
efforts, and promotes approved content from a sandbox environment to a shared
location, among other tasks. In addition, the data steward determines who has
access to the promoted content.
Power BI uses app
workspaces to organize content. You can
think of an app workspace as the logical equivalent of a shared folder on a
server. Consider creating separate workspaces to differentiate between
certified and non-certified content. Within a workspace, assign individual
users or groups to appropriate roles
that control access and also define the types of content creation and
management activities they can perform.
For users who only need to
consume the content created by others, all items or a subset of items, can be
published from an app workspace as an app,
which insulates users from any ongoing content changes in the originating app
workspace. In other words, the app is purely for end user consumption, whereas
the app workspace is the collaborative development environment.
Ideally, data stewards should have the
ability to move content between app workspaces when promoting content to a
certified status. However, Power BI does not yet support this capability. Until
this feature is added, the creator’s content in a PBIX file must be published
to the target app workspace. As long as you have edit access to a report (among
a few other limitations), you can download
its corresponding PBIX file from the Power BI service and then
republish it to a new location.
Monitor activity and usage by content and by user. Usage auditing ensures
compliance with policies and standards, and surfaces potentially valuable new
data sources that might be of use to a broader audience.
Power BI provides the following
options for monitoring:
Usage metrics. You can review data for dashboard and report usage from a built-in report or you can use a live connection to the underlying data source for these metrics if you prefer to build a custom report.Audit logs. You can access audited activity details through the Office 365 Security and Compliance Center, or by executing a PowerShell script.
When you take advantage of Power BI’s features with data governance in mind, you can make chaos a relic of the past. Instead, users can make better decisions because they are using higher quality content and more trustworthy data. A cooperative governed environment reduces duplication of effort inherent when users work in isolation and thereby improves everyone’s productivity. And you have better oversight of how data assets are being used–or not being used–and can intervene where appropriate.
Note: This post was originally published in the June 13, 2019 PASS Insights newsletter, but was written a couple of months prior to publication. On June 3, 2019, Microsoft announced the public preview of shared and certified datasets , which is another great feature for data governance in Power BI. Datasets can be certified by data stewards and discovered by users in a dataset catalog that is accessible in both the Power BI Desktop and the online Power BI service. Furthermore, usage metrics and audit logs are captured for these datasets.
June 12, 2019
My Two New Power BI Courses at Pluralsight
This year I’ve been busy producing two new courses at Pluralsight covering Power BI from two different perspectives. One course is for the complete novice and the other course is for anyone who wants to delve deeper into Power BI data modeling concepts.
If you don’t have an account at Pluralsight yet, no worries! You can sign up for a free trial with unlimited access!
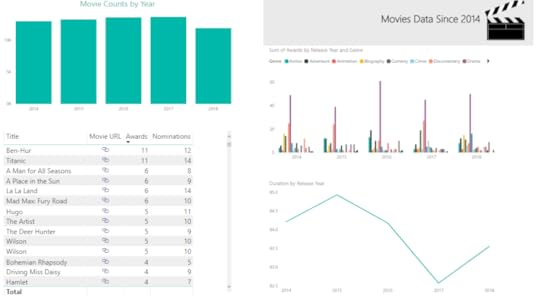
Building Your First Power BI Report
If you are brand new to Power BI, start with Building Your First Power BI Report. It takes 1 hour and 37 minutes to watch all the videos in this course at a normal speed.
This course takes you on a tour of the Power BI Desktop application using a single source of data, an Excel spreadsheet containing movie data that I downloaded from IMDB.com using their free API and filtered down to a reasonably-sized data set.
I blended the resulting data set with some Academy Awards data to add counts of awards and nominations so that we had numeric data to plot in charts. (Psst: I used Power Query (aka Get Data) in Excel to merge the IMDB data with Academy Award data from Wikipedia and Best Picture data from Filmsite.org.)
Using this simple data set, I teach you how to:
Import an Excel workbook into Power BI. Data is rarely ready to use for reporting immediately after an import. Therefore, I’ll also show you the simple steps necessary to fix your data so that it is more usable. That means you’ll learn how to filter out extraneous columns and rows and how to rename columns. You’ll also learn a few more advanced techniques necessary to fix this particular data set. More specifically, I teach you about duplicating a query, splitting a single column into multiple columns, transposing columns into rows (aka unpivoting), and data cleansing techniques. Model the data to improve the reporting experience. To do this, I’ll introduce the concept of table relationships, show you some of the properties that you can manage in the Power BI data model, and teach you about the DAX language that is used to add calculations to your model. Add data visualizations and static report elements to a report. Now we get to the good stuff! Power BI allows you to explore your data from multiple perspectives, so I’ll show you how to set up different views of the same data using a table as well as column and line charts. To wrap up, you learn how to publish your work to the Power BI web service and create a dashboard.
Modeling Data in Power BI
If you’ve already started using Power BI and want to explore more advanced features, especially with regard to combining multiple, disparate types of data, I have another course for you to view, Modeling Data in Power BI. This course is nearly 5 hours long when played at a normal speed.
In this course, the focus is on getting data from multiple sources into Power BI, applying a variety of transformations to blend the data together, and then modeling the data to better support data exploration in reports. Although I create visualizations in reports, I do not spend much time explaining about how to use these visualizations or how to take advantage of the various reporting features. The reports are here to validate the work performed to prepare the data model.
The data set is also related to movies, but consolidates a variety of sources to illustrate the areas in which Power BI handles some transformation steps for you and those in which you need to do more work to prepare the data. Specifically, I use the following sources in this course:
A group of TSV files (like CSV files only using a tab as a delimiter), downloaded from IMDB.com and filtered down to a smaller set of data of movies and people. Primarily, I filtered the data based on movie release year. However, I also filtered the data to include only actors and directors, rather than all roles such as writers, producers, and so on. Otherwise, the data model would be HUGE! I also separated out names of people into different files to set up a demonstration in which you can import multiple files with the same structure as one query. A group of CSV files containing MovieLens data from the University of Minnesota. I was given written permission to use this data for demonstration purposes in this course, with the requirement that you must download the data directly from their web site. This set of data includes user-defined tags and ratings for movies. An XML file containing movie-related data from a Stanford professor’s course on data modeling. I included this data to demonstrate some challenges and solutions to working with XML data. HTML data related to the Stanford XML data in order to include information about awards and to illustrate yet another type of data source.
With this more complex collection of data sets loaded into Power BI, I teach you how to perform the following tasks:
Combine data sets into fewer queriesFilter the data to include only the rows and columns you needExpand XMLUse Custom Columns to convert data types and concatenate stringsDuplicate and reference queriesUnpivot data to create new rows from columns in a single rowUse a custom function to expedite the process of expanding XMLCleanse dataAdd proper relationships between tablesConfigure model properties to control visibility, sorting, formatting, and summarizationWork with data categoriesUse synonymsEdit the Q&A linguistic schemaWork with DAX in calculated columns, measures, and parametersExplore the effect of row and filter context on DAX resultsWork with a parent-child hierarchy
Whew! That’s a lot to learn! The end result isn’t pretty because this course is not about Power BI reporting. I’ll even admit it’s not the most perfect data model, but I had to draw the line somewhere. Else it would be a ten-hour course! That said, any further changes to the data model would be part of a normal iterative process to fine-tune the model to suit specific reporting requirements.
Furthermore, this course covers a lot of advanced modeling concepts that you won’t find in my very first Power BI course published in 2016, Getting Started in Power BI. That older course is still mostly valid, but the product has added many more features since then. Keeping up with monthly updates to Power BI definitely keeps us all on our toes!
And if you’re still craving more Power BI content, there are also a lot of others available at Pluralsight. Go check them out!
June 9, 2018
Using SSIS to Stage JSON in SQL Server Tables
Last month I started wrangling with JSON in SSIS and discussed how to download JSON files and store them as flat files. Now I want to move that data into staging tables in SQL Server.
My general philosophy about staging tables is to move the data into tables while preserving the original structure and contents of the data as well as possible. In this case, I’m slightly bending my own rule by selecting a specific array from each JSON file because this is where the majority of the data resides. In my PBIX files that I created at the beginning of this series, I also eliminated the JSON objects that are on the same level of the array, so I already know I don’t care about these bits of data.
Here’s the general plan for staging the data:
Create a staging table for each group of files–games, player, etc.
Read each JSON file using OPENJSON and insert the results into the target staging table.
Create a staging table
I need one staging table for each type of file that I have. I already have a list of 5 of the 6 types of tables in the apiCall table that I built (described here), so I can use an Execute SQL Task to generate this list and use UNION to append the 6th table type to the list manually.
select querytype from dbo.apicall
union
select 'seasons'
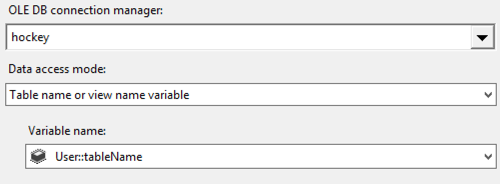
I set the ResultSet property of the task to FullResultSet. On the Result Set page, I assign the Result Name to an object variable, tableNameSet.
Then, I can use a Foreach Loop Container to iterate through tableNameSet by using the Foreach ADO Enumerator, and map the single column it contains to a string variable, tableName.
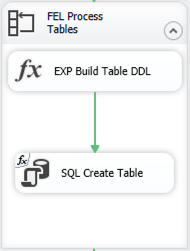
Each iteration of the loop will use an Expression Task to build the DDL necessary to create the staging table and then use an Execute SQL Task to execute the DDL.
By using the OPENJSON function to read the JSON files, I’m guaranteeing the structure of each staging file is identical. All I need to do is change the name of the table in my DDL. (Note: I already added a staging schema to my database.) The Expression Task contains the following code:
@[User::tableDDL] = "DROP TABLE IF EXISTS staging." +
@[User::tableName] + "; CREATE TABLE staging." +
@[User::tableName] + "( [key] nvarchar(4000), [value] nvarchar(max), [type] tinyint )"
Normally I truncate staging tables, but for now I’m ok with dropping the tables if they exist (using syntax applicable to SQL Server 2016 or later) and recreating it. Later, I might expand on my solution by setting up a package for the one-time tasks like creating tables and change this code to perform a truncation, but that will be later.
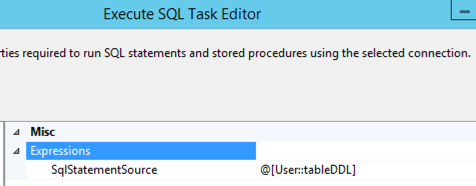
The Execute SQL Task then uses an expression to assign the value of the tableDDL variable to the SqlStatementSource property dynamically at runtime, and voila… the staging tables are created.
Read each JSON file
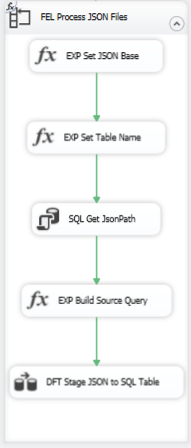
Now I’m ready to load those tables by reading each of the JSON files using another Foreach Loop container and executing a series of tasks: expressions to set variables, read a table to get the path that I need in the OPENJSON query, and then a Data Flow Task that has its source query set dynamically to a particular JSON file and a target table for which the table name is stored in a variable.
Let’s peel this apart.
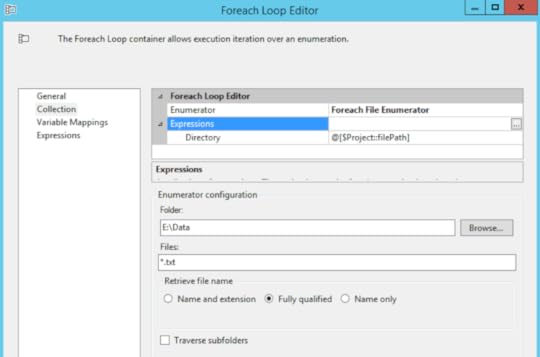
The Foreach Loop Container is set to use the Foreach File Enumerator. I changed my user variable filePath from my first package to a project parameter now that I have two packages in my project, and I reference that project parameter in the Directory property expression. I restrict the enumerator to txt files using a wildcard and get the fully qualified name of the file. That way, I can use that value when I build out the OPENJSON query. I map this value to a string variable, sourceFile.
Inside the loop, my first two steps are to use Expression Tasks to set variable values.
First:
@[User::jsonFileNameBase] =
REPLACE(TOKEN(REPLACE(@[User::sourceFile], @[$Project::filePath]
+ "\\", ""), "_", 1), ".txt", "")
Basically, this code strips out the path from the fully qualified name and gets the base name of the file that precedes the underscore in the name. For example, the file e:\data\games_19171918.txt is transformed to games by this code. However, I also have files like seasons.txt that have no underscore, so I need to strip off .txt to get to the desired base name of seasons.
Second:
@[User::tableName] = "staging." +
@[User::jsonFileNameBase]
Here I prepend the schema name to the base name created in the first step to assign a table name to a variable.
Then I set up a table manually to hold the path value I need for the OPENJSON table. Nothing fancy – I just need a way to map paths to file types:
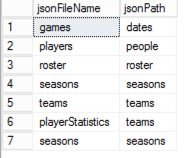
I use an Execute SQL Task to query this table. By using a parameter in the query, I can call this task to query for the current file type:
select jsonPath from jsonPath where jsonFileName = ?
The parameter mapping looks like this:
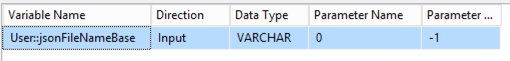
I set the ResultSet property to SingleRow as there will only be one result and I assign this result set to the string variable jsonPath.
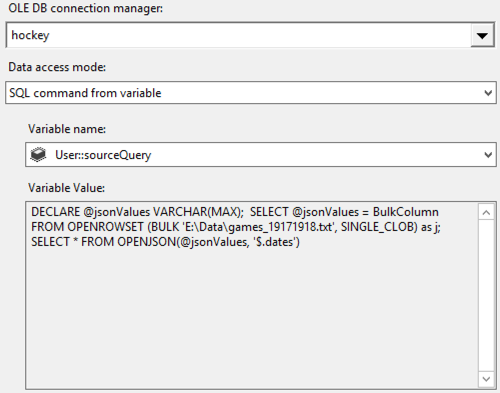
One more Expression Task is necessary. This final task uses the sourceFile and jsonPath variables to build out the string variable sourceQuery:
@[User::sourceQuery] =
"DECLARE @jsonValues VARCHAR(MAX);
SELECT @jsonValues = BulkColumn
FROM OPENROWSET (BULK '" + @[User::sourceFile] + "',
SINGLE_CLOB) as j;
SELECT * FROM OPENJSON(@jsonValues,
'$." + @[User::jsonPath] + "');"
The last step is to call the Data Flow Task which consists of two components, an OLE DB Source and an OLE DB Destination.
The OLE DB Source references the sourceQuery variable created in the previous step.
Last, the OLE DB Destination is set up to target the table specified in the tableName variable:
After executing the package, all the data gets loaded – still as JSON objects – into SQL Server tables. Foreach Loop containers made it easy to loop through table rows in the first set of tasks and through the files themselves in the second set of tasks and to use variables that dynamically change the task properties for each loop iteration. That way, I didn’t have to build a unique Data Flow Task for each type of file that I wanted to load.
Of course, the part that made this easy was that the target table structures were identical so the Data Flow Task column mappings do not change on each iteration. If they did, I would not be able to use this approach.
In my next post, I’ll work through restructuring this data into a relational model that will become the basis for future analytics projects. Stay tuned!
You can download the SSIS solution here.
June 2, 2018
T-SQL JSON Output to Flat File Destination in SSIS
In my last post, I was stymied by a problem in SSIS. My goal was to use a T-SQL statement to generate a set of rows to represent each NHL season since 1917 as JSON and then to store the JSON in a flat file.
Specifically, this T-SQL statement:
DECLARE @seasonStart INT=1917;
DECLARE @seasonEnd INT=year(getdate());
WITH seasonYears AS (
SELECT @seasonStart AS seasonYear
UNION ALL
SELECT seasonYear+1 FROM seasonYears
WHERE seasonYear+1
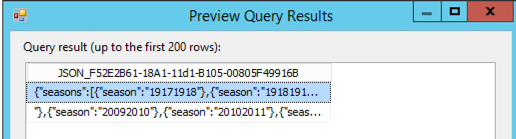
What happened? The T-SQL produces the correct results in SQL Server Management Studio (SSMS). However, in SSIS, the same T-SQL statement in an OLE DB Source in a Data Flow Task produces two rows of data which adds a line feed into the flat file and renders the JSON unusable.
The problem is visible even before sending output to the flat file. Here’s what I see when I preview the query results for the OLE DB Source:
I wound up just using SSMS to generate the JSON and using copy/paste to create the file I needed because that got the job done. Meanwhile, I learned a bit more about why I ran into this problem, and I came up with a solution that I want to share with you in this post.
Official word from Microsoft is that FOR JSON always returns output in 2-4KB chunks. Although SSMS doesn’t display these chunks in separate rows, SSIS handles it differently. I could solve this problem either by using a Script Component as a source – and that would mean I would have to write code, which I don’t want to have to do if I don’t have to. Or I could handle the T-SQL in a different way. Which I did.
The trick is to store the JSON output in a variable and then output the result of the variable. I wound up having to rewrite the T-SQL statement because I couldn’t use a CTE in the statement assigned to the variable. Here’s the revised statement that returns the same results as the original shown at the beginning of this post.
DECLARE @seasonStart INT=1917;
DECLARE @seasonEnd INT=year(getdate());
DECLARE @jsonText NVARCHAR(max) =
(SELECT CONVERT(VARCHAR(4), @seasonStart + seasonYears) +
CONVERT(VARCHAR(4), @seasonStart + seasonYears + 1) AS season
FROM
(SELECT number AS seasonYears
FROM master..spt_values
WHERE type = 'p' AND
number BETWEEN 0 AND @seasonEnd - @seasonStart) AS t
FOR JSON PATH, ROOT('seasons'));
SELECT @jsonText AS jsonOutput;
When I preview this query in SSIS, I get one row of output:
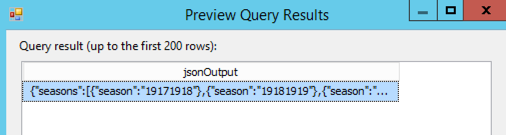
And when I produce the flat file, I get the file I wanted. Problem solved!
May 27, 2018
Using SSIS to Retrieve JSON Files
As I mentioned in my previous post, I’ve been wrangling at lot of JSON lately. And, in my spare time, I’ve been wrangling a lot of hockey data, launching a series of posts that began here.
In fact, since I started working with the hockey data exclusively in Power BI, I’m finding that the refresh process is getting slower and I haven’t even collected all the data that I’d like to analyze yet! Furthermore, I keep thinking of other ways that I would like to use the data outside of Power BI, so I really need to make a separate repository of the data. That’s what I’m up to in today’s post – making a local copy of the files.
Note: I have not yet found the NHL API terms of use explicitly, but I have seen comments made here and there that the non-commercial usage of this data is fine. As I am using this data for demonstration purposes only, I believe I’m in compliance. If I find otherwise, I’ll note it here and adjust my usage accordingly.
Planning the Approach
SQL Server Integration Services (SSIS) is my tool of choice for this task. My initial plan is to get the JSON files and store the files on a local (or network) drive. In future posts, I’ll cover what I can do with local JSON files, but for now I just want to automate retrieving them.
It turns out that I cannot use the OData Source in a Data Flow Task because the NHL data is not exposed as an OData Service. But I still have a simple way to get files from this particular API — use curl.
There are multiple ways to run curl from Windows. At the moment, I’m not interested in debating the merits of one method over another. For now, I’m using the 64-bit version of Cygwin for Windows with the curl package installed.
Downloading JSON
To use curl in SSIS to download the files, I use the Execute Process task configured with a call to the curl executable and passing arguments for the URL I want and the path and filename for the JSON returned by the API call.
Using this general approach, I create an Execute Process task as shown below. I always start with a “hard-coded” version of the operation I want to accomplish before trying to use expressions for dynamic operations so that I can make sure everything works as expected first.
Notice the Arguments property has the URL enclosed in single quotes and the -o flag with a file name to indicate the file into which the data will be saved after downloading. The WorkingDirectory property contains the folder path for the output file.
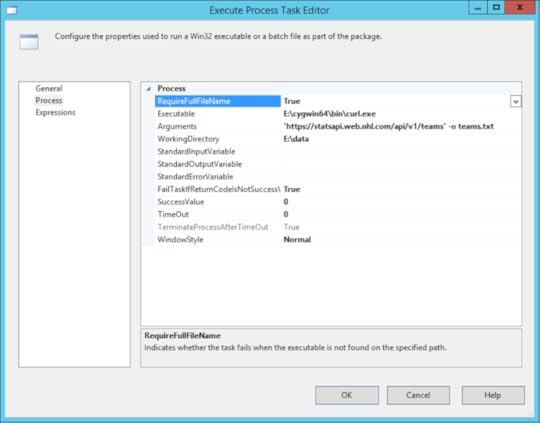
When I execute this task, I get a file where I expect one to land, so all is well.
Except that I am really lazy about creating tasks in SSIS and prefer to figure out a way to automate what I can so that I don’t have to set up a task for every file that I want to download. I need to make a change. That’s where expressions and loops come in handy.
Iterating through the API calls
One of the great features about SSIS is the ability to change behavior at runtime by using dynamic expressions. Rather than set up a task for each API call, I can set up a table, read its rows into a variable, and then use a ForEach loop container to iterate through the rows, create variables for each column in a row, and then use these variables to dynamically build out a URL.
Reviewing my queries that I created in Power BI, I can see that I have different patterns to create. (The context for these patterns is described in the series of posts that begins here). In some cases, I just need to get data from a static URL. In other cases, I need to dynamically generate the URL.
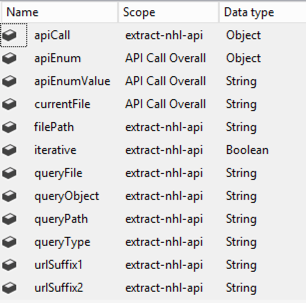
To support the use of the ForEach loop to build the URLs that I need, I created and populated the following table in a SQL Server database:

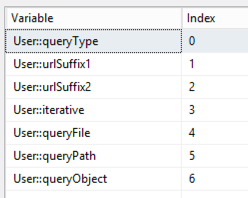
I’ll use these columns to populate variables that I’ll use in each iteration of the ForEach loop:
queryType – this value not only identifies the query (for me), but will also be used to create the filename for storing the JSON locally
urlSuffix1 – this value gets appended to the base URL, https://statsapi.web.nhl.com/api/v1/
urlSuffix2 – the final string to appended to the base URL following the urlSuffix1 and other values, as applicable
iterative – a flag to indicate which branch of the control flow to follow
queryFile – the file on which the query is dependent (e.g. to get roster data, the teams file must be read)
queryPath – the path to the data to be be retrieved (e.g. to get roster data, read the id from the teams file)
queryObject – the JSON array to which the query path is applied (e.g. to get roster data, look in the teams array – which is where the id referenced in queryPath is located)
processOrder – due to dependencies between queries, I need to control the order in which they execute
I also added variables to the package. I describe the use of these variables in the walkthrough of the package.
Then I constructed a package to read the table I created, populate variables, and then use these variables to construct the necessary URLs and output file names in an expression associated with an Execute Process task. Here’s the final package:

Let me walk you through the specifics of the package:
SQL Get apiCall: This is an Execute SQL Task that gets the data from the table I created and stores the result in the apiCall variable.
SELECT
[querytype],
[urlSuffix1],
ISNULL([urlSuffix2], '') as urlSuffix2,
[iterative],
ISNULL(queryFile, '') as queryFile,
ISNULL(queryPath, '') as queryPath,
ISNULL(queryObject, '') as queryObject,
processOrder FROM [dbo].[apiCall]
ORDER BY processOrder
API Call Overall: This is a ForEach loop that iterates through the rowset variable. That is, each row from the table that I created that identifies the different types of queries that I need to execute. I set this loop to use the ADO enumerator and reference the ADO object source variable–apiCall. Then the columns returned by the query are mapped to variables which are used inside the container:
EXP Set the control flow path: This is a placeholder task. I need a way to control whether I do a single API call (the teams query) or run through the same call iteratively (such as when I need to process each team id individually). I set the expression to 1 == 1 just to have something valid configured for this task. The real goal was to set the precedence constraints to determine which way the control flow will flow…
One path leads to the EPT API Call Non-iterative. This path has the Expression and Constraint option set with the following expression: !@[User::iterative]. This expression affects the control flow for one query type only, the teams query.
The other path leads to the Process JSON file(s) loop. This path has the Expression and Constraint option set with the following expression: @[User::iterative]. All other queries will use this control flow path.
EPT API Call Non-iterative: This is a variation of the Execute Process Task described above. In this case, I’m using expressions to dynamically generate the Arguments and WorkingDirectory values at runtime. The urlSuffix1, urlSuffix2, and queryType variables come from the current iteration of the ForEach loop and I set up the filePath variable to be able to have a single place to reference the location of the JSON files.

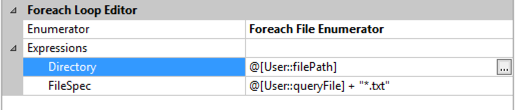
Process JSON file(s): This is a ForEach Loop container that drives looping through a list of files. The list could be a list of one (the teams.txt generated by the EPT API Call Non-iterative task) or a list of many. I’m using the Foreach File Enumerator here with expressions to determine at runtime where to find the files (Directory) and the file specification (such as teams*.txt or roster*.txt, etc.). The file name for each iteration is mapped to the currentFile variable:
Get Enumerators: This is an Execute SQL Task that reads the data from the dependent JSON file (queryFile). I use an expression to dynamically generate the SQL that gets executed using the variables associated with the current iteration of the API Call Overall loop. This technique takes advantage of the JSON support in SQL Server 2016 or higher to read specific elements out of a JSON file. For example, the first time this task executes, the file to be read is teams.txt (created by the EPT API Call Non-iterative task). The team IDs are extracted from this file and stored in the apiEnum variable as a result set.
"DECLARE @jsonData VARCHAR(MAX); SELECT @jsonData = BulkColumn FROM OPENROWSET(BULK '" + @[User::filePath] + "\\" + @[User::currentFile] + "', SINGLE_BLOB) JSON; SELECT JSON_VALUE([value],'" + @[User::queryPath] + "') as enum FROM OPENJSON(@jsonData, '" + @[User::queryObject] + "');"
Iterative API Call: This is another ForEach Loop container using the ADO Enumerator to iterate through the rows in the apiEnum variable. The single column in this rowset variable is mapped to the apiEnumValue variable.
EPT API Call Iterative: This Execute Process task is much like the EPT API Call Non-iterative task. There are two differences. First, this task is executing inside the ForEach Loop container which passes in the apiEnumValue. Second, the expression for the Argument property relies on this apiEnumValue to pass into the URL string and also to uniquely number the JSON file that gets stored locally. As an example, the first roster file based on team ID 1 is saved as roster_1.txt.
"'https://statsapi.web.nhl.com/api/v1/" + @[User::urlSuffix1] + @[User::apiEnumValue] + @[User::urlSuffix2] + "' -o " + @[User::queryType] + "_" + @[User::apiEnumValue] + ".txt"
One little problem…
Everything works great in the package above. However, I did encounter a problem that I need to research.
The one JSON file that I need to iterate through that I cannot get from the NHL API (that I know of) is the list of seasons. In Power BI, I generated a list using the {1917..2017} syntax to use as the basis for building out the 19171918 format required to request data for a specific season. I tried to use a T-SQL statement to generate a JSON document:
DECLARE @seasonStart INT=1917;
DECLARE @seasonEnd INT=year(getdate());
WITH seasonYears AS (
SELECT @seasonStart AS seasonYear
UNION ALL
SELECT seasonYear+1 FROM seasonYears WHERE seasonYear+1
This statement produces the results I want. No problem here. However, when I use this statement in an OLE DB Source for a Data Flow Task, with the intent of saving the file using a Flat File Destination (as described here), I get a weird file. Everything LOOKS right, except that there’s a stray line feed in the TXT file. I’ve tried outputting as a Unicode file or as a non-Unicode file, but either way the file can’t be read by the code in the Get Enumerators task (which I need to use to loop through the seasons).
After much experimentation, and another pair of eyes (thanks, Kerry Tyler!) , I could see the problem lies in the OLE DB Source component. Something in there is breaking the JSON stream into two rows. A careful review of the screenshots in the post to which I linked in the previous paragraph shows similar behavior, even if the post doesn’t call it out.
Honestly, I don’t really need SSIS to generate the file. It’s a one time thing. So I execute my code in SSMS and use copy/paste to put the results into the season.txt file, and I’m good to go. My package runs fine and I get all the JSON that I want/need downloaded successfully.
For the record, the package to approximately 18 minutes to run and downloaded 1,000 files. On my wimpy little laptop.
Here’s a link to the SSIS package and the code to create the apiCall table.
Mission accomplished for today. Now that I have JSON files, I can do other kinds of fun things with hockey data… Another day!
May 19, 2018
Handling JSON in SSIS
I believe the first time I ever learned JSON was a thing in the data world was when I attended SQLSaturday Washington DC in December 2012, but I never encountered it in any client projects. My clients relied solely on relational data sources for analytics, so that was my focus.
And then I had to write about it in my book Introducing Microsoft SQL Server 2016 (which is free to download) when JSON support was added to SQL Server 2016. But I still didn’t have clients using JSON. It was interesting to me that I could use SQL Server to work with JSON data, but it was still theoretical to me rather than practical.
Therefore, I never thought much about how I would handle it in SQL Server Integration Services (SSIS). I just didn’t have a reason.
Until now. This seems to be the year that I am bumping into JSON left and right. It’s everywhere!
My first client project forays into JSON this year have been to use it as a data source in Power BI. And then later I discovered how to get hockey data from JSON files into Power BI as I’ve been discussing in a series that started earlier this year here. In my last post, I decided that the refresh queries are getting too slow for my liking and I want to experiment with the data in other ways, so I need to move it into another format – starting with a relational database. Meanwhile, I started a client project that requires me to extract JSON files to load into a relational database.
I’m not one to miss the signals. It’s time for me to figure out my options for working with JSON in SSIS…. so here we are.
There are many different ways that one can acquire JSON files. The situations of interest to me at the moment is using API calls to retrieve the data and then somehow moving the data into a table. The purpose of this post is simply to review the options that I have uncovered to date.
Because every data movement situation is different, I won’t claim that any of these methods is preferred over another. The beauty of SSIS is that in many cases it’s flexible enough to handle the same process in multiple ways. At the end of the day, I have two golden rules when it comes to getting things done in SSIS:
Make sure the data is right when the process is complete.
Make sure the process completes in as timely a manner as possible.
Ideally, the end result adheres to these rules in such a way that it’s easy to troubleshoot or to adapt as needs change later. This means leaning towards an approach that matches the skills available in your organization. For example, using a Script Component with C# is not the best approach if most of your SSIS developers are more comfortable with T-SQL than C#.
Some time spent researching my options for working with JSON in SSIS turned up the following possible approaches:
Parsing JSON Data Sources Using SSIS. This technique was written for SQL Server 2012. It uses a flat file source with single column with data type of text stream (DT_TEXT), then uses a Script Component as a transformation. In the Script Component, the key is to use the JavaScript Deserialize method from System.Web.Extensions.
Use a custom component. You could write your own, acquire an open source JSON processing solution, or buy a commercial component that plugs into SSIS. I found these:
SSIS JSON Integration Pack from ZappySys
JSON Source Component from KingswaySoft
Note: I am not familiar with these companies and I have not tried these components. I’m just noting their existence in the universe of possibilities.
Bulk import JSON File Data to Table. SQL Server 2016 added JSON support to T-SQL so this technique simplifies the process quite a lot if you are using SQL Server 2016 or later.
Personally, I lean towards the last option, Bulk Import. Why?
I don’t want to have to write code in a Script Transformation if I don’t have to.
I don’t want to have to pay for a commercial component when I can find another way to accomplish my goals without a whole lot of trouble.
On the one hand, the open-source version might be useful. On the other hand, in one of client scenarios I have a slightly different than normal authentication situation. In that case, the use of the open-source component is more complicated to figure out than I want to deal with.
I understand the Bulk Import approach. It’s easy enough to translate into an SSIS workflow, so that’s what I’m going to do.
In my next post, I’ll describe how I use the bulk import option in SSIS to move hockey JSON data into a SQL Server database.
May 12, 2018
Revisiting Dynamic Web.Contents()
Thus far in my series of posts using hockey data to explore the subject of data analytics in Power BI (which began all the way back here), I have been focused on “using” the data, and was generally refreshing data whenever I opened the PBIX file. I didn’t set up a refresh schedule for the published versions of the hockey datasets that are embedded into previous posts, and was thinking that someone might come along some day and wonder why the data is old. So today I decided to fix that situation and set up a refresh schedule.
There’s just one problem. I’m using the Web.Contents() function in several queries to get the JSON data from the NHL API.
Actually, the function is not the problem. It’s the way I’m using it to dynamically construct URLs so that I can iterate through lists of players or teams or whatever to retrieve the data I want.
Clearly that technique works just fine because I have data. However, when I try to schedule the refresh in the Power BI service, I get the dreaded error: “You can’t schedule refresh for this dataset because one or more sources currently don’t support refresh.”
I explained how to solve this particular problem once upon a time. For the hockey data queries, I had to use variations on that theme to get the dynamic URLs to work. To do this, I had to fix up my queries (which are actually functions) in the Query Editor by opening up the Advanced Editor and fixing the code as noted below.
getGames and getScores
The first few lines for each of these functions looked like this originally:
(season as text) as table =>
let
Source = Json.Document(Web.Contents("https://statsapi.web.nhl.com/api/v1/s..." & season)),
I changed to this:
(seasonValue as text) as table =>
let
Source = Json.Document(Web.Contents("https://statsapi.web.nhl.com/api/v1/s...",
[Query=[season=seasonValue]])),
I had to hard-code a single season into the URL and then the value in the Query argument replaces the hard-coded value when the function is called.
I also had to change the variable for the query argument from season to seasonValue. When I tried Query=[season=season], the function worked independently. I could enter a parameter and invoike the function to see results correctly.
However, when I called the function from another query, I got the following error message: “Operation is not valid due to the current state of the object.” Not exactly a lot of information to work with that from a troubleshooting point of view. That’s when I tried changing season=season to season=seasonValue, the error message went away, and everything worked nicely.
getRoster
I changed this:
Source = Json.Document(Web.Contents("https://statsapi.web.nhl.com/api/v1/t..."
& teamid & "/roster"))
To this:
Source = Json.Document(Web.Contents("https://statsapi.web.nhl.com/api/v1/t...",
[RelativePath= teamid & "/roster"]
))
Here I use the RelativePath argument to append a string (generated dynamically) to the URL in the first argument.
getPlayer
I replaced this:
Source = Json.Document(Web.Contents("https://statsapi.web.nhl.com/api/v1/p..." & playerid))
With this:
Source = Json.Document(Web.Contents("https://statsapi.web.nhl.com/api/v1/p...",
[RelativePath= "/" &playerid ]
)),
))
In this case, it’s the same idea as the change I made in getRoster except here I had to put the static string first and follow it with the variable.
getYearlyPlayerStatistics
I went from this:
Source = Json.Document(Web.Contents("http://statsapi.web.nhl.com/api/v1/te... teamid & "?hydrate=roster(person(stats(splits=yearByYear)))"))
To this:
Source = Json.Document(Web.Contents("http://statsapi.web.nhl.com/api/v1/teams",
[RelativePath=teamid & "?hydrate=roster(person(stats(splits=yearByYear)))"]))
Technically hydrate is a query parameter, but it’s static in this case (unlike seasonValue in the getGames example). Therefore, I could just append it to the relative path argument’s value.
One more thing…
I also had hard-coded the season start years from 1917 to 2017 into the scores away and scores home queries. I don’t want to have to update this range of values each year, so I adjusted these queries also.
Instead of this:
Source = {1917..2017}
I did this:
Source = {1917..Date.Year(DateTime.LocalNow())}
Voila!
After I publish the PBIX file to the cloud, I need to update the dataset credentials and set a refresh schedule. To do this, I perform the following steps:
Open the Power BI web page, locate the dataset, point to it to display the ellipsis icon, and then click the ellipsis.
Click Schedule Refresh.
In the Data Source Credentials section, click the Edit Credentials link and click Sign In. Repeat for each link.
And… Houston, we have a problem…
Each of the links for credentials is the URL for the functions that Power BI is attempting to resolve before it allows me to schedule the refresh. Everything is fine except for the getPlayer function which is trying this URL: https://statsapi.web.nhl.com/api/v1/p....
The problem in this case is that the API returns an error message because it requires a player ID. Which the function actually returns, but it doesn’t have one when Power BI is trying it out. Because the player ID is not sent as a query parameter, I can’t hard-code a value and then override it in the Query argument for the Web.Contents() function. Stumped…
Well, this leads me to change up my priority list for working with hockey data. I’ve been thinking recently that refreshing the PBIX file is slower than I would like and it’s only going to get worse as more data is available from the NHL. I want to use the data with other tools besides Power BI, so maybe it’s time to move the data into another repository. Stay tuned!
May 5, 2018
Numerical Variable Relationships
In the previous post in this series (which began all the way back in February 2018 with Getting Started with Data Analytics in Power BI, I explained how an important part of descriptive analytics is to evaluate relationships between variables and in particular focused on categorical variables.
This time, I will shift over to a study of relationships between numerical variables. A common way to start exploring this type of relationship is to use a scatter plot.
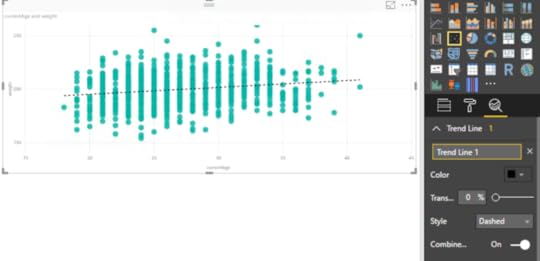
Let’s start with something easy and understandable to analyze. If I put age on the horizontal axis and weight on the vertical axis. It’s a common practice to put an explanatory variable on the horizontal axis and a response variable on the vertical axis. In other words, I’m looking to see how an increase in age (explanation) affects – or not – weight (response) for all the hockey players in the current season, regardless of team.
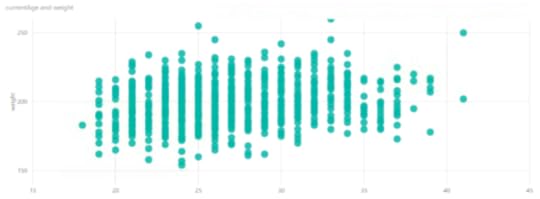
If I put age on the horizontal axis – does this explain weight? Sort of – the combinations of age and weight have some groupings. It almost appears that there is a greater number of younger, heavier players than older, heavier players, but it’s hard to tell here how the age/weight combinations are distributed because I can’t see all the individual points.
One of the analytical features that Power BI has built-in is the trend line. When I enable that feature (by clicking the magnifying glass icon to the far right below the visualization selectors and clicking Add), I can see that Power BI finds a trend statistically that moves slightly upward and to the right. In other words, as the players are getting older, they are slightly increasing in weight overall.
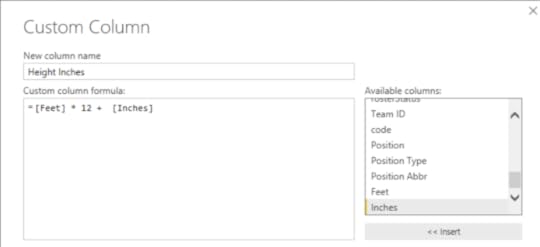
What if I looked used height on the horizontal axis? Now I need to fiddle with the players query a bit. I need numeric, continuous data for each axis in a scatter plot. However, the height is currently in my data as feet and inches, like this: 6’11”. I need all inches (because I’m American and we failed at the transitioning to the metric system in the 70s… I’m sorry), so I’ll edit the query:
Duplicate the Height column
Split the result into two columns based on the ‘ symbol
Replace ” in the second new column with an empty string
Change the data type on the new column to Whole Number
Renaming the two columns as Feet and Inches
Add a column named Height Inches to multiply the value in the Feet column by 12 to which I add the Inches column
Now when I create a scatter plot for height and weight, and add in a trend line, for good measure, I can see a more clear (and understandable) relationship between the two variables. Notice the trend line rises more sharply to the right. As players get taller, they tend to weigh more, too.
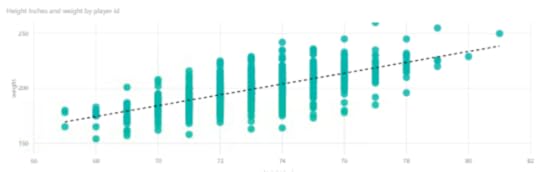
No shocking revelation here, I know. But this is a nice, simple example of a positive correlation between two variables. As height increases, so does weight – in general terms and in this data set.
And this is as good a place as any to insert the caution that correlation does not imply causation. That is, just because a player is taller does not cause the player to weigh more. In this case, the two variables happen to be related, that’s all.
I can easily do some interesting comparisons to add in Team Name as a categorical variable and use colors to differentiate between points by team. The Vegas Golden Knights are 2-2 in Round 2 of the playoffs with the San Jose Sharks, so I’m interested to compare these two in particular right now.
You can play with the data, too, to compare two or more teams by selecting different teams in the slicer on the left, although the colors won’t match teams necessarily – I hard-coded the colors for this report.
You can download the PBIX if you want to take a closer look and/or refresh the data.
In the business world, it’s common to explore relationships between numerical variables. Here are just a few examples:
Sales dollars versus advertising dollars
Sales dollars versus weeks since the first of the year (or some relevant time period)
Income versus count of a defined population (customers, geographic region, etc.)
I see that I don’t have a lot of numerical variables in my hockey data overall, so I’m doubtful that I’ll find anything interesting by creating more scatter plots. For example, if I look at player statistics, I can pretty much guess without looking that a player’s number of goals in a season are going to increase as the number of games he played increases.
I think I’ve exhausted the possibilities with basic data exploration of the data that I have thus far. It’s time to start reviewing standard hockey metrics and enhancing my data model to include them… next week! That way, I’ll have a range of options in my data for exploring more visualizations and features in Power BI.
April 29, 2018
Categorical Variable Relationships
I knew I had a lot to say in this series…and we’re still at the tip of this iceberg with this ninth post in my series that started with Getting Started with Data Analytics in Power BI. For now, Power BI continues to be my tool of choice, but the preparation I’m currently undertaking for various analytics projects gives me all sorts of wild ideas to try out with other technology later, so stay tuned.
The latest news related to this series is that my favorite hockey team Vegas Golden Knights swept the Los Angeles Kings in the first round of the 2018 Stanley Cup playoffs and won the first game against the San Jose Sharks in the second round of the playoffs. Sadly, they lost the second game in overtime last night. I’m still on a quest to determine if this overall fantastic performance was predictable, but I’m jumping the gun. I continue to have a lot to learn about the data that I have collected thus far.
In this post, my focus remains on descriptive analytics. In future posts, I’ll discuss predictive and prescriptive analytics. But for now – let’s stick to descriptive… Looking back over the prior posts, I realize that I never provided a definition of descriptive analytics. Shame on me.
In essence, we use descriptive analytics to look at historical data and use it to describe what happened. No forecasting, no what-if scenarios…just the facts, ma’am (or sir).
Descriptive analytics can use basic statistics and visualizations to summarize the data that we have to understand the historical data. In the old-school business intelligence world, we would include the ability to “slice and dice” the data in the domain of descriptive analytics.
What’s the process?
In general terms, the descriptive analytics process contains the following steps:
Exploring the data to identify numerical and categorical variables
Calculating simple statistics to get counts for categorical variables and middles/outliers for numerical variables
Assessing where data is potentially missing and figuring out why
Cleansing the data where possible
Reviewing the data distribution as I describe here, here, and even here
Reviewing relationships between key variables
This last step is the focus of this post. I’m going to continue using hockey data for exploring categorical variables, but the concept easily translates to business concepts
Categorical variable relationships
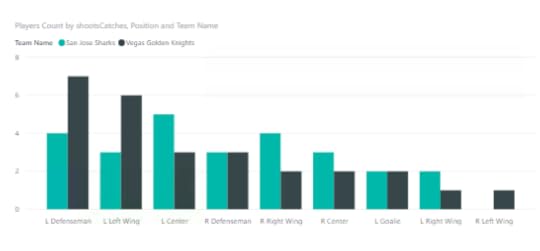
A common way to review categorical variable relationships is to create a cross tab, also known as a matrix, to evaluate the counts for each resulting combination.
For example, in my current data set, I can create a matrix to compare the number of players in two teams, say the Knights and the Sharks, by position and by handedness.
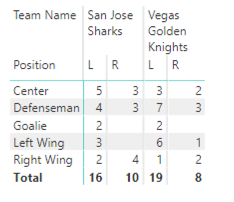
In descriptive analytics, I’m not trying to prove anything by looking at these values. I’m just reporting them. (Although I do find it interesting that there is a preponderance of lefties in these two teams.)
In the business world, I might do something similar by placing product categories on rows and customer geography (country or state) on columns.
And often it’s helpful to look at this data visually by using a column chart to compare the results. Cognitively speaking, it’s a lot easier to evaluate differences by comparing lengths of columns than to do the mental math of comparing values in a matrix.
The “problem” with pursuing descriptive analytics like this is that I have to try all the possible combinations to determine whether I have found a meaningful relationship or not. That’s when the ability to automate this process to uncover the interesting combinations becomes super important. But that’s a discussion for another day.
Meanwhile, you can explore this particular combination of categorical variables using your favorite teams:
Stacia Misner's Blog

- Stacia Misner's profile
- 2 followers

