
Stacia Misner's Blog, page 5
February 14, 2013
Dashboard Design Tip #3: Provide Context
It’s time again for another tip in my dashboard makeover series (which began here). A common approach to producing dashboards is to reuse existing reports. After all, build it once and reuse it many times, seems like a good idea, right? The problem is that a dashboard has a different purpose than a report, and you have to constantly question the purpose of the dashboard. Be clear on the message that must be communicated quickly and concisely. As an example, in the original Adventure Works dashboard that I introduced in my 24 Hours of Pass presentation Dashboard Do’s and Don’ts, you can use a table to display quarter-to-date sales like this:

The problem is that this data in this format doesn’t help me know whether those values are good or bad. And of course I need to know what defines good or bad. Do I have a sales target to compare to? Do I want to know whether the quarter-to-date sales are better than the same time last quarter or the same time last year?
Let’s assume that there is an established sales target. Without the information in the dashboard, the viewer is forced to go look up a report that lists the forecasts by territory and then do calculations to figure out how close or far away each territory is from that goal. That defeats the purpose of the dashboard which should provide information at a glance. Consider the following chart as an alternative to showing a table.
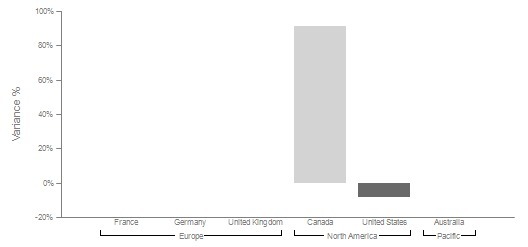
Here the only two countries for which a quarter-to-date sales target exists for the time frame represented are Canada and the United States. Notice that the column chart reflects the variance. You can see that Canada has sales that are almost 100% of the goal. Wow – not only did Canada meet its goal but has almost doubled the goal. Great news! On the other hand, the US is not meeting the goal. Whether that amount by which its not meeting the goal is a little or a lot depends on management expectations. The chart could be enhanced by adding a tooltip that displays the variance percentage value, the QTD sales, and QTD target to provide even more context without cluttering up the visualization.
This is just one way to present a visualization that provides context for sales. At a glance, it’s easy to tell where things are good and where things are not so good.
Want to learn more tips like these? Join me and a great lineup of speakers at the PASS Business Analytics Conference in Chicago on April 10-12. Here are some related sessions to help you build your skills:
Advanced Dashboards Using Excel, Excel Services, and PerformancePoint
Advanced Data Visualization with SQL Server Reporting Services
Excel Charting Tips
Hope to see you there!


February 12, 2013
Let go of my ISPAC!
Sometimes it happens. SQL Server Data Tools crashes and burns. (It’s also known as Visual Studio or SSDT but I don’t know how to pronounce that…) Was it something I said? I’m currently building a small data warehouse and building out a lot of packages in a fairly short period of time, so maybe I was wearing out good ole’ SSDT. After setting up a new package, I tried to execute it and the application hung. I waited patiently. Nothing. Waited some more, and then decided I had no choice. I had to put SSDT out of its misery and (hide the children) kill the process. Now this was something that I encountered often enough when working with earlier versions of SQL Server using Business Intelligence Development Studio (or the more pronounceable BIDS), but SSDT has been much more stable for me. Until this moment.
After reopening SSDT, I tried to run my package, but got this error:
Failed to execute package or element. Build errors were encountered. For more information, see the Output window.
I’m good at following directions. This is what I found in the Output window:
------ Build started: Project: DW_ETL, Configuration: Development ------
Build started: SQL Server Integration Services project: Incremental ...
Starting project consistency check ...
Project consistency check completed. The project is consistent.
Error : System.IO.IOException: The process cannot access the file
'C:\Users\\\\bin\Development\DW_ETL.ispac'
because it is being used by another process.
at System.IO.__Error.WinIOError(Int32 errorCode, String maybeFullPath)
at System.IO.File.Delete(String path)
at Microsoft.DataTransformationServices.Project.DataTransformationsProjectBuilder.
IncrementalBuildThroughObj(IOutputWindow outputWindow)
at Microsoft.DataTransformationServices.Project.DataTransformationsProjectBuilder.
BuildIncremental(IOutputWindow outputWindow)
Build complete -- 1 errors, 0 warnings
========== Build: 0 succeeded or up-to-date, 1 failed, 0 skipped ==========
And for good measure, I also looked in the Error window which contained essentially the same message.
The ISPAC file is necessary for deploying a project to the SSISDB catalog. It gets built automatically when you execute a package in SSDT, or you can manually build it by using the Build command in SSDT. Its purpose is to consolidate all the packages and parameters for your project (assuming you are using the default Project Deployment mode), so that you can deploy the entire project to the SSISDB database as a single unit. In other words, you can hand off one file to an administrator of the Integration Services server and they can deploy it onto the server.
During the development process, I don’t need the ISPAC file. And if it’s being used by another process, ostensibly the one I just killed, but blocking my current process, I should just kill it, too. The problem I found is that it was good at self-defense. When I tried to delete the ISPAC file, I got the following message:
Action can’t be completed because the file is open in SSIS debug host.
Okay, fine, I closed SSDT and tried to delete the ISPAC file again. Same message.
Next I went to Task Manager and found two processes. DTSDebugHost.exe and DTSDebugHost.exe *32. Can you guess what I did? I had to be pretty ruthless yesterday. I don’t feel good about it, but it had to be done. After the deed was done, I never looked back. I reopened SSDT and ran my package successfully. All’s well that ends well.
February 11, 2013
Excel 2013: Business Intelligence Goes Mainstream (If You Can Find It)
Currently I’ve been wrapping up production on Business Intelligence in Microsoft SharePoint 2013 (which includes chapters on Excel 2013) and preparing for my upcoming Deep Dive into Business Intelligence in Excel 2013′s PowerPivot and Power View eLearning event (among other things). Consequently I’m paying a bit more attention than usual to what the universe has to say about this latest release of Excel. Ok, maybe not the universe, but people are talking and one of those people is someone I happen to know, none other than Rob Collie (blog | twitter). Rob has a bit more insight than most of us because he was one of the engineers that developed the PowerPivot functionality that was originally integrated with Excel as an add-in installation in Excel 2010, but is now built directly into Excel 2013. So when Rob speaks, I listen.
In a recent Software Advice interview, Rob hits the highlights of the new Excel by answering questions about BI functionality in Excel, the message about self-service BI that it sends, the motivation for users to upgrade, the impact of Office Apps, and his vision for Excel users. I agree with Rob’s contention that having PowerPivot (and of course Power View) available directly in the product is going to help users discover this functionality faster than they would if they had to rely on finding, downloading, and installing an add-in. However, I do have a concern that this functionality still might not be obvious. Although PowerPivot is built into Excel now, it’s still considered an add-in, and furthermore it’s disabled by default. To use it, you have to enable the PowerPivot add-in, which isn’t difficult but isn’t necessarily obvious.
So I’m not sure that people are going to discover PowerPivot on their own without the PowerPivot tab of the ribbon enticing them to explore. But they might happen to notice changes to the Import Data dialog box that mentions the Data Model.
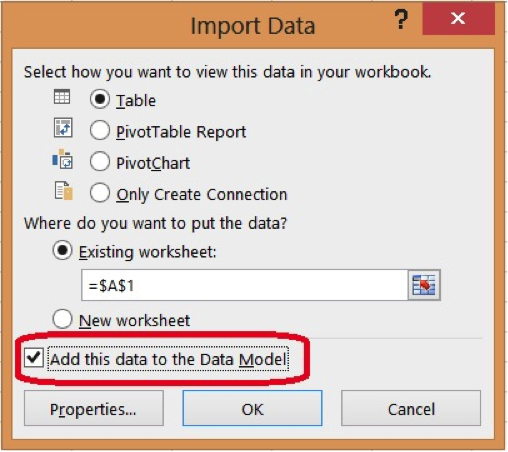
The Data Model gives you an entry-level path to PowerPivot. You can bring together data that you can use to build Power View sheets in Excel, the other great new feature in Excel 2013. Although there is also some set up required before you can use Power View, the process is a bit smoother. When you first attempt to insert a new Power View sheet, Excel prompts you to enable the add-in and also to install Silverlight. As long as you have data in the Data Model, you’re off and running.
So how does that relate to PowerPivot? Well, the Data Model is simple, based on the data you feed it. Power View allows you to build great visualizations, but what if you want to refine the model by renaming a field or adding a calculation? When users decide the basic Data Model isn’t enough, that’s when they’ll want to learn more about the Data Model and discover that PowerPivot takes them deeper into data analysis.
As Rob mentions, I don’t think this capability makes every user a data analyst, but Excel 2013 provides something for everyone. Those users who just need simple spreadsheet calculations can do just that, while others who would like to explore and enhance their data with visualizations have some amazing capabilities without having to take a week’s worth of training, and those who are already comfortable with embedding advanced formulas into a worksheet will quickly learn and take advantage of the features in PowerPivot that support richer modeling of the data. It’s great to see the evolution of Excel, and especially to see people get excited about their data when they try out this latest version.
Stacia Misner's Blog

- Stacia Misner's profile
- 2 followers

