
Barb Drozdowich's Blog, page 14
February 3, 2021
50 Social Media Stats to Help You Choose the Right Platform for Your Business [Infographic]
Welcome Back!
Happy Wednesday and welcome to my latest find! My theory of interacting on social media is to interact in the location where your peeps hang out. Because of this, looking at who hangs out where is helpful!
I hope you find today’s infographic helpful. Be sure to visit the original blog post on my favorite blog Social Media Today!

I hope you enjoyed this infographic. Please use the share buttons below to share with friends that might benefit from this information. If you haven’t already, please subscribe to my blog using the form below.
Email Address
Subscribe
The post 50 Social Media Stats to Help You Choose the Right Platform for Your Business [Infographic] appeared first on Bakerview Consulting.


January 27, 2021
Under the Influence – 84 Influencer Marketing Stats [Infographic]
Welcome Back!
I field a lot of questions on the topic of Inflencers and using them to scale marketing efforts. This is a complicated subject, but today’s infographic does a great job of clarifying parts of the topic. Specifically, it addresses expectations.
I hope you learn a lot from today’s share and be sure to read the original post on my favorite blog – Social Media Today.

I hope you enjoyed this infographic. Please use the share buttons below to share with friends that might benefit from this information. If you haven’t already, please subscribe to my blog using the form below.
Email Address
Subscribe
The post Under the Influence – 84 Influencer Marketing Stats [Infographic] appeared first on Bakerview Consulting.
January 20, 2021
Image Formats (Infographic)
Welcome Back!
Another gem of an infographic to share today! Do you know the difference and the use of the various image formats or file types? What is their source? What is their use?
This simple infographic summarizes the answers to all these questions – feel free to bookmark for future use! And be sure to read the original post where I found today’s share.

I hope you enjoyed this infographic. Please use the share buttons below to share with friends that might benefit from this information. If you haven’t already, please subscribe to my blog using the form below.
Email Address
Subscribe
The post Image Formats (Infographic) appeared first on Bakerview Consulting.
January 13, 2021
Fonts – What Marketers Need to Know
Welcome back!
The topic of Fonts is one that seems to bring out strong opinions. Are you a fan of Serif fonts or San-Serif fonts? Do you know why you would use each? Do you understand why you would not use various fonts?
Today’s infographic – from my favorite blog Social Media Today – does a great job of covering some of the top questions I field on a regular basis. I look forward to your thoughts on today’s share.

I hope you enjoyed this infographic. Please use the share buttons below to share with friends that might benefit from this information. If you haven’t already, please subscribe to my blog using the form below.
Email Address
Subscribe
The post Fonts – What Marketers Need to Know appeared first on Bakerview Consulting.
January 6, 2021
Mastering Pinterest for Small Business Owners
Welcome back!
Pinterest seems to be a constant subject for me for a variety of reasons. I get a lot of questions about Pinterest from authors/bloggers I work with and Pinterest seems to be the most finicky of the social media platforms to verify.
I found today’s infographic here and just had to share it. I look forward to your thoughts about today’s subject.

I hope you enjoyed this infographic. Please use the share buttons below to share with friends that might benefit from this information. If you haven’t already, please subscribe to my blog using the form below.
Email Address
Subscribe
The post Mastering Pinterest for Small Business Owners appeared first on Bakerview Consulting.
December 30, 2020
Marketing to Millennials: 8 Email Marketing Stats & Facts Retailers Need to Know [Infographic]
Welcome Back!
Welcome to the last infographic of 2020! I thought we’d finish off the year with an infographic that combines 2 of my favorite subjects – marketing to millennials and email tips.
I hope you find a few actionable tidbits and be sure to visit Social Media Today to read the original post!

I hope you enjoyed this infographic. Please use the share buttons below to share with friends that might benefit from this information. If you haven’t already, please subscribe to my blog using the form below.
Email Address
Subscribe
The post Marketing to Millennials: 8 Email Marketing Stats & Facts Retailers Need to Know [Infographic] appeared first on Bakerview Consulting.
December 16, 2020
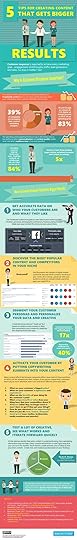
5 Tips for Creating Content that Gets Bigger Results
Welcome Back!
For those of you who regularly read my blog, you will realize that I frequently write on the subject of stats. How do we figure out what our readers like? How do we track their movements on our site.
Today’s infographic outlines 5 great tips for creating great content! Some of the tips are simple, others require a little bit more work. All the tips are clear!
Hope you enjoy today’s “find” and be sure to read the original post on my favorite blog – Social Media Today.
I hope you enjoyed this infographic. Please use the share buttons below to share with friends that might benefit from this information. If you haven’t already, please subscribe to my blog using the form below.
Email Address
Subscribe
The post 5 Tips for Creating Content that Gets Bigger Results appeared first on Bakerview Consulting.
December 9, 2020
10 Essential On-Page SEO Factors for Google Success in 2020 and Beyond [Infographic]
Welcome Back!
For long time readers of this blog, you will realize that I’m a frequent teacher of SEO and am constantly reading on the subject. I do understand that many don’t share my interests, but I like sharing infographics like this one for those who do!
If you have enjoyed this infographic and want more information, check out the full post here.

I hope you enjoyed this infographic. Please use the share buttons below to share with friends that might benefit from this information. If you haven’t already, please subscribe to my blog using the form below.
Email Address
Subscribe
The post 10 Essential On-Page SEO Factors for Google Success in 2020 and Beyond [Infographic] appeared first on Bakerview Consulting.
December 2, 2020
7 Rules of Social Media Automation [Infographic]
Welcome Back!
I automate a lot of my social media. My primary reason is my “shiny red squirrel” issue. Logging into live Facebook or Twitter can result in me losing an hour or two of getting lost in clicking on links and reading content. Like you, I’m really busy and I don’t have a couple of hours to lose. Using social media tools allows me to bypass live social media and focus on only what I need to and hopefully avoid being distracted.
Be sure to drop by here and read the full blog post!
[image error]
I hope you enjoyed this infographic. Please use the share buttons below to share with friends that might benefit from this information. If you haven’t already, please subscribe to my blog using the form below.
Email Address
Subscribe
The post 7 Rules of Social Media Automation [Infographic] appeared first on Bakerview Consulting.
November 29, 2020
Happy Cyber Monday!
Welcome back!
This Cyber Monday, I’m celebrating by putting two of my books on sale and offering a giveaway to win a $20 Amazon gift card.
I’m using the Kindle Countdown feature, so these two books will only be on sale on Amazon.com and Amazon.co.uk for 99 cents.
[image error]
[image error]
Let’s move on to the Giveaway! I’m giving away a $20 Amazon gift card. To enter the giveaway, enter information in the Rafflecopter below. The winner will be drawn on Dec 3rd.
a Rafflecopter giveaway
Happy Cyber Monday – happy online shopping!
Please feel free to share this blog post with anyone who could use some sale books or the chance to win a gift card this year. Share buttons are below.
The post Happy Cyber Monday! appeared first on Bakerview Consulting.


