
Barb Drozdowich's Blog, page 12
July 21, 2021
10 Facebook Statistics Every Business Owner & Marketer Should Know In 2021 [Infographic]
Welcome back!
Are you curious as to what to pay attention to on your Facebook account? What matters? What doesn’t matter? I thought today’s infographic gives plenty of details to think about. Be sure to read the full post on my favorite social media blog, Social Media Today.

I hope you enjoyed this infographic. Please use the share buttons below to share with friends that might benefit from this information. If you haven’t already, please subscribe to my mailing list and receive some technical hints focused at your needs!
@import url(https://static.mailerlite.com/assets/... .ml-form-embedSubmitLoad{display:inline-block;width:20px;height:20px}.sr-only{position:absolute;width:1px;height:1px;padding:0;margin:-1px;overflow:hidden;clip:rect(0,0,0,0);border:0}.ml-form-embedSubmitLoad:after{content:" ";display:block;width:11px;height:11px;margin:1px;border-radius:50%;border:4px solid #fff;border-color:#fff #fff #fff transparent;animation:ml-form-embedSubmitLoad 1.2s linear infinite}@keyframes ml-form-embedSubmitLoad{0%{transform:rotate(0)}100%{transform:rotate(360deg)}}#mlb2-1709472.ml-form-embedContainer{box-sizing:border-box;display:table;margin:0 auto;position:static;width:100%!important}#mlb2-1709472.ml-form-embedContainer button,#mlb2-1709472.ml-form-embedContainer h4,#mlb2-1709472.ml-form-embedContainer p,#mlb2-1709472.ml-form-embedContainer span{text-transform:none!important;letter-spacing:normal!important}#mlb2-1709472.ml-form-embedContainer .ml-form-embedWrapper{background-color:#f6f6f6;border-width:0;border-color:transparent;border-radius:4px;border-style:solid;box-sizing:border-box;display:inline-block!important;margin:0;padding:0;position:relative}#mlb2-1709472.ml-form-embedContainer .ml-form-embedWrapper.embedDefault,#mlb2-1709472.ml-form-embedContainer .ml-form-embedWrapper.embedPopup{width:400px}#mlb2-1709472.ml-form-embedContainer .ml-form-embedWrapper.embedForm{max-width:400px;width:100%}#mlb2-1709472.ml-form-embedContainer .ml-form-align-left{text-align:left}#mlb2-1709472.ml-form-embedContainer .ml-form-align-center{text-align:center}#mlb2-1709472.ml-form-embedContainer .ml-form-align-default{display:table-cell!important;vertical-align:middle!important;text-align:center!important}#mlb2-1709472.ml-form-embedContainer .ml-form-align-right{text-align:right}#mlb2-1709472.ml-form-embedContainer .ml-form-embedWrapper .ml-form-embedHeader img{border-top-left-radius:4px;border-top-right-radius:4px;height:auto;margin:0 auto!important;max-width:100%;width:undefinedpx}#mlb2-1709472.ml-form-embedContainer .ml-form-embedWrapper .ml-form-embedBody,#mlb2-1709472.ml-form-embedContainer .ml-form-embedWrapper .ml-form-successBody{padding:20px 20px 0 20px}#mlb2-1709472.ml-form-embedContainer .ml-form-embedWrapper .ml-form-embedBody.ml-form-embedBodyHorizontal{padding-bottom:0}#mlb2-1709472.ml-form-embedContainer .ml-form-embedWrapper .ml-form-embedBody .ml-form-embedContent,#mlb2-1709472.ml-form-embedContainer .ml-form-embedWrapper .ml-form-successBody .ml-form-successContent{text-align:left;margin:0 0 20px 0}#mlb2-1709472.ml-form-embedContainer .ml-form-embedWrapper .ml-form-embedBody .ml-form-embedContent h4,#mlb2-1709472.ml-form-embedContainer .ml-form-embedWrapper .ml-form-successBody .ml-form-successContent h4{color:#000;font-family:'Open Sans',Arial,Helvetica,sans-serif;font-size:30px;font-weight:400;margin:0 0 10px 0;text-align:left;word-break:break-word}#mlb2-1709472.ml-form-embedContainer .ml-form-embedWrapper .ml-form-embedBody .ml-form-embedContent p,#mlb2-1709472.ml-form-embedContainer .ml-form-embedWrapper .ml-form-successBody .ml-form-successContent p{color:#000;font-family:'Open Sans',Arial,Helvetica,sans-serif;font-size:14px;font-weight:400;line-height:20px;margin:0 0 10px 0;text-align:left}#mlb2-1709472.ml-form-embedContainer .ml-form-embedWrapper .ml-form-embedBody .ml-form-embedContent ol,#mlb2-1709472.ml-form-embedContainer .ml-form-embedWrapper .ml-form-embedBody .ml-form-embedContent ul,#mlb2-1709472.ml-form-embedContainer .ml-form-embedWrapper .ml-form-successBody .ml-form-successContent ol,#mlb2-1709472.ml-form-embedContainer .ml-form-embedWrapper .ml-form-successBody .ml-form-successContent ul{color:#000;font-family:'Open Sans',Arial,Helvetica,sans-serif;font-size:14px}#mlb2-1709472.ml-form-embedContainer .ml-form-embedWrapper .ml-form-embedBody .ml-form-embedContent ol ol,#mlb2-1709472.ml-form-embedContainer .ml-form-embedWrapper .ml-form-successBody .ml-form-successContent ol ol{list-style-type:lower-alpha}#mlb2-1709472.ml-form-embedContainer .ml-form-embedWrapper .ml-form-embedBody .ml-form-embedContent ol ol ol,#mlb2-1709472.ml-form-embedContainer .ml-form-embedWrapper .ml-form-successBody .ml-form-successContent ol ol ol{list-style-type:lower-roman}#mlb2-1709472.ml-form-embedContainer .ml-form-embedWrapper .ml-form-embedBody .ml-form-embedContent p a,#mlb2-1709472.ml-form-embedContainer .ml-form-embedWrapper .ml-form-successBody .ml-form-successContent p a{color:#000;text-decoration:underline}#mlb2-1709472.ml-form-embedContainer .ml-form-embedWrapper .ml-block-form .ml-field-group{text-align:left!important}#mlb2-1709472.ml-form-embedContainer .ml-form-embedWrapper .ml-block-form .ml-field-group label{margin-bottom:5px;color:#333;font-size:14px;font-family:'Open Sans',Arial,Helvetica,sans-serif;font-weight:700;font-style:normal;text-decoration:none;display:inline-block;line-height:20px}#mlb2-1709472.ml-form-embedContainer .ml-form-embedWrapper .ml-form-embedBody .ml-form-embedContent p:last-child,#mlb2-1709472.ml-form-embedContainer .ml-form-embedWrapper .ml-form-successBody .ml-form-successContent p:last-child{margin:0}#mlb2-1709472.ml-form-embedContainer .ml-form-embedWrapper .ml-form-embedBody form{margin:0;width:100%}#mlb2-1709472.ml-form-embedContainer .ml-form-embedWrapper .ml-form-embedBody .ml-form-checkboxRow,#mlb2-1709472.ml-form-embedContainer .ml-form-embedWrapper .ml-form-embedBody .ml-form-formContent{margin:0 0 20px 0;width:100%}#mlb2-1709472.ml-form-embedContainer .ml-form-embedWrapper .ml-form-embedBody .ml-form-checkboxRow{float:left}#mlb2-1709472.ml-form-embedContainer .ml-form-embedWrapper .ml-form-embedBody .ml-form-formContent.horozintalForm{margin:0;padding:0 0 20px 0;width:100%;height:auto;float:left}#mlb2-1709472.ml-form-embedContainer .ml-form-embedWrapper .ml-form-embedBody .ml-form-fieldRow{margin:0 0 10px 0;width:100%}#mlb2-1709472.ml-form-embedContainer .ml-form-embedWrapper .ml-form-embedBody .ml-form-fieldRow.ml-last-item{margin:0}#mlb2-1709472.ml-form-embedContainer .ml-form-embedWrapper .ml-form-embedBody .ml-form-fieldRow.ml-formfieldHorizintal{margin:0}#mlb2-1709472.ml-form-embedContainer .ml-form-embedWrapper .ml-form-embedBody .ml-form-fieldRow input{background-color:#fff!important;color:#333!important;border-color:#ccc;border-radius:4px!important;border-style:solid!important;border-width:1px!important;font-family:'Open Sans',Arial,Helvetica,sans-serif;font-size:14px!important;height:auto;line-height:21px!important;margin-bottom:0;margin-top:0;margin-left:0;margin-right:0;padding:10px 10px!important;width:100%!important;box-sizing:border-box!important;max-width:100%!important}#mlb2-1709472.ml-form-embedContainer .ml-form-embedWrapper .ml-form-embedBody .ml-form-fieldRow input::-webkit-input-placeholder,#mlb2-1709472.ml-form-embedContainer .ml-form-embedWrapper .ml-form-embedBody .ml-form-horizontalRow input::-webkit-input-placeholder{color:#333}#mlb2-1709472.ml-form-embedContainer .ml-form-embedWrapper .ml-form-embedBody .ml-form-fieldRow input::-moz-placeholder,#mlb2-1709472.ml-form-embedContainer .ml-form-embedWrapper .ml-form-embedBody .ml-form-horizontalRow input::-moz-placeholder{color:#333}#mlb2-1709472.ml-form-embedContainer .ml-form-embedWrapper .ml-form-embedBody .ml-form-fieldRow input:-ms-input-placeholder,#mlb2-1709472.ml-form-embedContainer .ml-form-embedWrapper .ml-form-embedBody .ml-form-horizontalRow input:-ms-input-placeholder{color:#333}#mlb2-1709472.ml-form-embedContainer .ml-form-embedWrapper .ml-form-embedBody .ml-form-fieldRow input:-moz-placeholder,#mlb2-1709472.ml-form-embedContainer .ml-form-embedWrapper .ml-form-embedBody .ml-form-horizontalRow input:-moz-placeholder{color:#333}#mlb2-1709472.ml-form-embedContainer .ml-form-embedWrapper .ml-form-embedBody .ml-form-fieldRow textarea,#mlb2-1709472.ml-form-embedContainer .ml-form-embedWrapper .ml-form-embedBody .ml-form-horizontalRow textarea{background-color:#fff!important;color:#333!important;border-color:#ccc!important;border-radius:4px!important;border-style:solid!important;border-width:1px!important;font-family:'Open Sans',Arial,Helvetica,sans-serif;font-size:14px!important;height:auto;line-height:21px!important;margin-bottom:0;margin-top:0;padding:10px 10px!important;width:100%!important;box-sizing:border-box!important;max-width:100%!important}#mlb2-1709472.ml-form-embedContainer .ml-form-embedWrapper .ml-form-embedBody .ml-form-checkboxRow .label-description::before,#mlb2-1709472.ml-form-embedContainer .ml-form-embedWrapper .ml-form-embedBody .ml-form-embedPermissions .ml-form-embedPermissionsOptionsCheckbox .label-description::before,#mlb2-1709472.ml-form-embedContainer .ml-form-embedWrapper .ml-form-embedBody .ml-form-fieldRow .custom-checkbox .custom-control-label::before,#mlb2-1709472.ml-form-embedContainer .ml-form-embedWrapper .ml-form-embedBody .ml-form-fieldRow .custom-radio .custom-control-label::before,#mlb2-1709472.ml-form-embedContainer .ml-form-embedWrapper .ml-form-embedBody .ml-form-horizontalRow .custom-checkbox .custom-control-label::before,#mlb2-1709472.ml-form-embedContainer .ml-form-embedWrapper .ml-form-embedBody .ml-form-horizontalRow .custom-radio .custom-control-label::before,#mlb2-1709472.ml-form-embedContainer .ml-form-embedWrapper .ml-form-embedBody .ml-form-interestGroupsRow .ml-form-interestGroupsRowCheckbox .label-description::before{border-color:#ccc!important;background-color:#fff!important}#mlb2-1709472.ml-form-embedContainer .ml-form-embedWrapper .ml-form-embedBody .ml-form-fieldRow input.custom-control-input[type=checkbox]{box-sizing:border-box;padding:0;position:absolute;z-index:-1;opacity:0;margin-top:5px;margin-left:-1.5rem;overflow:visible}#mlb2-1709472.ml-form-embedContainer .ml-form-embedWrapper .ml-form-embedBody .ml-form-checkboxRow .label-description::before,#mlb2-1709472.ml-form-embedContainer .ml-form-embedWrapper .ml-form-embedBody .ml-form-embedPermissions .ml-form-embedPermissionsOptionsCheckbox .label-description::before,#mlb2-1709472.ml-form-embedContainer .ml-form-embedWrapper .ml-form-embedBody .ml-form-fieldRow .custom-checkbox .custom-control-label::before,#mlb2-1709472.ml-form-embedContainer .ml-form-embedWrapper .ml-form-embedBody .ml-form-horizontalRow .custom-checkbox .custom-control-label::before,#mlb2-1709472.ml-form-embedContainer .ml-form-embedWrapper .ml-form-embedBody .ml-form-interestGroupsRow .ml-form-interestGroupsRowCheckbox .label-description::before{border-radius:4px!important}#mlb2-1709472.ml-form-embedContainer .ml-form-embedWrapper .ml-form-embedBody .ml-form-checkboxRow input[type=checkbox]:checked~.label-description::after,#mlb2-1709472.ml-form-embedContainer .ml-form-embedWrapper .ml-form-embedBody .ml-form-embedPermissions .ml-form-embedPermissionsOptionsCheckbox input[type=checkbox]:checked~.label-description::after,#mlb2-1709472.ml-form-embedContainer .ml-form-embedWrapper .ml-form-embedBody .ml-form-fieldRow .custom-checkbox .custom-control-input:checked~.custom-control-label::after,#mlb2-1709472.ml-form-embedContainer .ml-form-embedWrapper .ml-form-embedBody .ml-form-horizontalRow .custom-checkbox .custom-control-input:checked~.custom-control-label::after,#mlb2-1709472.ml-form-embedContainer .ml-form-embedWrapper .ml-form-embedBody .ml-form-interestGroupsRow .ml-form-interestGroupsRowCheckbox input[type=checkbox]:checked~.label-description::after{background-image:url("data:image/svg+xml,%3csvg xmlns='http://www.w3.org/2000/svg' viewBox='0 0 8 8'%3e%3cpath fill='%23fff' d='M6.564.75l-3.59 3.612-1.538-1.55L0 4.26 2.974 7.25 8 2.193z'/%3e%3c/svg%3e")}#mlb2-1709472.ml-form-embedContainer .ml-form-embedWrapper .ml-form-embedBody .ml-form-fieldRow .custom-radio .custom-control-input:checked~.custom-control-label::after{background-image:url("data:image/svg+xml,%3csvg xmlns='http://www.w3.org/2000/svg' viewBox='-4 -4 8 8'%3e%3ccircle r='3' fill='%23fff'/%3e%3c/svg%3e")}#mlb2-1709472.ml-form-embedContainer .ml-form-embedWrapper .ml-form-embedBody .ml-form-checkboxRow input[type=checkbox]:checked~.label-description::before,#mlb2-1709472.ml-form-embedContainer .ml-form-embedWrapper .ml-form-embedBody .ml-form-embedPermissions .ml-form-embedPermissionsOptionsCheckbox input[type=checkbox]:checked~.label-description::before,#mlb2-1709472.ml-form-embedContainer .ml-form-embedWrapper .ml-form-embedBody .ml-form-fieldRow .custom-checkbox .custom-control-input:checked~.custom-control-label::before,#mlb2-1709472.ml-form-embedContainer .ml-form-embedWrapper .ml-form-embedBody .ml-form-fieldRow .custom-radio .custom-control-input:checked~.custom-control-label::before,#mlb2-1709472.ml-form-embedContainer .ml-form-embedWrapper .ml-form-embedBody .ml-form-horizontalRow .custom-checkbox .custom-control-input:checked~.custom-control-label::before,#mlb2-1709472.ml-form-embedContainer .ml-form-embedWrapper .ml-form-embedBody .ml-form-horizontalRow .custom-radio .custom-control-input:checked~.custom-control-label::before,#mlb2-1709472.ml-form-embedContainer .ml-form-embedWrapper .ml-form-embedBody .ml-form-interestGroupsRow .ml-form-interestGroupsRowCheckbox input[type=checkbox]:checked~.label-description::before{border-color:#000!important;background-color:#000!important;color:#fff!important}#mlb2-1709472.ml-form-embedContainer .ml-form-embedWrapper .ml-form-embedBody .ml-form-fieldRow .custom-checkbox .custom-control-label::after,#mlb2-1709472.ml-form-embedContainer .ml-form-embedWrapper .ml-form-embedBody .ml-form-fieldRow .custom-checkbox .custom-control-label::before,#mlb2-1709472.ml-form-embedContainer .ml-form-embedWrapper .ml-form-embedBody .ml-form-fieldRow .custom-radio .custom-control-label::after,#mlb2-1709472.ml-form-embedContainer .ml-form-embedWrapper .ml-form-embedBody .ml-form-fieldRow .custom-radio .custom-control-label::before,#mlb2-1709472.ml-form-embedContainer .ml-form-embedWrapper .ml-form-embedBody .ml-form-horizontalRow .custom-checkbox .custom-control-label::after,#mlb2-1709472.ml-form-embedContainer .ml-form-embedWrapper .ml-form-embedBody .ml-form-horizontalRow .custom-checkbox .custom-control-label::before,#mlb2-1709472.ml-form-embedContainer .ml-form-embedWrapper .ml-form-embedBody .ml-form-horizontalRow .custom-radio .custom-control-label::after,#mlb2-1709472.ml-form-embedContainer .ml-form-embedWrapper .ml-form-embedBody .ml-form-horizontalRow .custom-radio .custom-control-label::before{top:2px;box-sizing:border-box}#mlb2-1709472.ml-form-embedContainer .ml-form-embedWrapper .ml-form-embedBody .ml-form-checkboxRow .label-description::after,#mlb2-1709472.ml-form-embedContainer .ml-form-embedWrapper .ml-form-embedBody .ml-form-checkboxRow .label-description::before,#mlb2-1709472.ml-form-embedContainer .ml-form-embedWrapper .ml-form-embedBody .ml-form-embedPermissions .ml-form-embedPermissionsOptionsCheckbox .label-description::after,#mlb2-1709472.ml-form-embedContainer .ml-form-embedWrapper .ml-form-embedBody .ml-form-embedPermissions .ml-form-embedPermissionsOptionsCheckbox .label-description::before{top:0!important;box-sizing:border-box!important}#mlb2-1709472.ml-form-embedContainer .ml-form-embedWrapper .ml-form-embedBody .ml-form-checkboxRow .label-description::after,#mlb2-1709472.ml-form-embedContainer .ml-form-embedWrapper .ml-form-embedBody .ml-form-checkboxRow .label-description::before{top:0!important;box-sizing:border-box!important}#mlb2-1709472.ml-form-embedContainer .ml-form-embedWrapper .ml-form-embedBody .ml-form-interestGroupsRow .ml-form-interestGroupsRowCheckbox .label-description::after{top:0!important;box-sizing:border-box!important;position:absolute;left:-1.5rem;display:block;width:1rem;height:1rem;content:""}#mlb2-1709472.ml-form-embedContainer .ml-form-embedWrapper .ml-form-embedBody .ml-form-interestGroupsRow .ml-form-interestGroupsRowCheckbox .label-description::before{top:0!important;box-sizing:border-box!important}#mlb2-1709472.ml-form-embedContainer .ml-form-embedWrapper .ml-form-embedBody .custom-control-label::before{position:absolute;top:4px;left:-1.5rem;display:block;width:16px;height:16px;pointer-events:none;content:"";background-color:#fff;border:#adb5bd solid 1px;border-radius:50%}#mlb2-1709472.ml-form-embedContainer .ml-form-embedWrapper .ml-form-embedBody .custom-control-label::after{position:absolute;top:2px!important;left:-1.5rem;display:block;width:1rem;height:1rem;content:""}#mlb2-1709472.ml-form-embedContainer .ml-form-embedWrapper .ml-form-embedBody .ml-form-checkboxRow .label-description::before,#mlb2-1709472.ml-form-embedContainer .ml-form-embedWrapper .ml-form-embedBody .ml-form-embedPermissions .ml-form-embedPermissionsOptionsCheckbox .label-description::before,#mlb2-1709472.ml-form-embedContainer .ml-form-embedWrapper .ml-form-embedBody .ml-form-interestGroupsRow .ml-form-interestGroupsRowCheckbox .label-description::before{position:absolute;top:4px;left:-1.5rem;display:block;width:16px;height:16px;pointer-events:none;content:"";background-color:#fff;border:#adb5bd solid 1px;border-radius:50%}#mlb2-1709472.ml-form-embedContainer .ml-form-embedWrapper .ml-form-embedBody .ml-form-embedPermissions .ml-form-embedPermissionsOptionsCheckbox .label-description::after{position:absolute;top:0!important;left:-1.5rem;display:block;width:1rem;height:1rem;content:""}#mlb2-1709472.ml-form-embedContainer .ml-form-embedWrapper .ml-form-embedBody .ml-form-checkboxRow .label-description::after{position:absolute;top:0!important;left:-1.5rem;display:block;width:1rem;height:1rem;content:""}#mlb2-1709472.ml-form-embedContainer .ml-form-embedWrapper .ml-form-embedBody .custom-radio .custom-control-label::after{background:no-repeat 50%/50% 50%}#mlb2-1709472.ml-form-embedContainer .ml-form-embedWrapper .ml-form-embedBody .custom-checkbox .custom-control-label::after,#mlb2-1709472.ml-form-embedContainer .ml-form-embedWrapper .ml-form-embedBody .ml-form-checkboxRow .label-description::after,#mlb2-1709472.ml-form-embedContainer .ml-form-embedWrapper .ml-form-embedBody .ml-form-embedPermissions .ml-form-embedPermissionsOptionsCheckbox .label-description::after,#mlb2-1709472.ml-form-embedContainer .ml-form-embedWrapper .ml-form-embedBody .ml-form-interestGroupsRow .ml-form-interestGroupsRowCheckbox .label-description::after{background:no-repeat 50%/50% 50%}#mlb2-1709472.ml-form-embedContainer .ml-form-embedWrapper .ml-form-embedBody .ml-form-fieldRow .custom-control,#mlb2-1709472.ml-form-embedContainer .ml-form-embedWrapper .ml-form-embedBody .ml-form-horizontalRow .custom-control{position:relative;display:block;min-height:1.5rem;padding-left:1.5rem}#mlb2-1709472.ml-form-embedContainer .ml-form-embedWrapper .ml-form-embedBody .ml-form-fieldRow .custom-checkbox .custom-control-input,#mlb2-1709472.ml-form-embedContainer .ml-form-embedWrapper .ml-form-embedBody .ml-form-fieldRow .custom-radio .custom-control-input,#mlb2-1709472.ml-form-embedContainer .ml-form-embedWrapper .ml-form-embedBody .ml-form-horizontalRow .custom-checkbox .custom-control-input,#mlb2-1709472.ml-form-embedContainer .ml-form-embedWrapper .ml-form-embedBody .ml-form-horizontalRow .custom-radio .custom-control-input{position:absolute;z-index:-1;opacity:0;box-sizing:border-box;padding:0}#mlb2-1709472.ml-form-embedContainer .ml-form-embedWrapper .ml-form-embedBody .ml-form-fieldRow .custom-checkbox .custom-control-label,#mlb2-1709472.ml-form-embedContainer .ml-form-embedWrapper .ml-form-embedBody .ml-form-fieldRow .custom-radio .custom-control-label,#mlb2-1709472.ml-form-embedContainer .ml-form-embedWrapper .ml-form-embedBody .ml-form-horizontalRow .custom-checkbox .custom-control-label,#mlb2-1709472.ml-form-embedContainer .ml-form-embedWrapper .ml-form-embedBody .ml-form-horizontalRow .custom-radio .custom-control-label{color:#000;font-size:12px!important;font-family:'Open Sans',Arial,Helvetica,sans-serif;line-height:22px;margin-bottom:0;position:relative;vertical-align:top;font-style:normal;font-weight:700}#mlb2-1709472.ml-form-embedContainer .ml-form-embedWrapper .ml-form-embedBody .ml-form-fieldRow .custom-select,#mlb2-1709472.ml-form-embedContainer .ml-form-embedWrapper .ml-form-embedBody .ml-form-horizontalRow .custom-select{background-color:#fff!important;color:#333!important;border-color:#ccc!important;border-radius:4px!important;border-style:solid!important;border-width:1px!important;font-family:'Open Sans',Arial,Helvetica,sans-serif;font-size:14px!important;line-height:20px!important;margin-bottom:0;margin-top:0;padding:10px 28px 10px 12px!important;width:100%!important;box-sizing:border-box!important;max-width:100%!important;height:auto;display:inline-block;vertical-align:middle;background:url(https://cdn.mailerlite.com/images/def...) no-repeat right .75rem center/8px 10px;-webkit-appearance:none;-moz-appearance:none;appearance:none}#mlb2-1709472.ml-form-embedContainer .ml-form-embedWrapper .ml-form-embedBody .ml-form-horizontalRow{height:auto;width:100%;float:left}.ml-form-formContent.horozintalForm .ml-form-horizontalRow .ml-input-horizontal{width:70%;float:left}.ml-form-formContent.horozintalForm .ml-form-horizontalRow .ml-button-horizontal{width:30%;float:left}.ml-form-formContent.horozintalForm .ml-form-horizontalRow .ml-button-horizontal.labelsOn{padding-top:25px}.ml-form-formContent.horozintalForm .ml-form-horizontalRow .horizontal-fields{box-sizing:border-box;float:left;padding-right:10px}#mlb2-1709472.ml-form-embedContainer .ml-form-embedWrapper .ml-form-embedBody .ml-form-horizontalRow input{background-color:#fff;color:#333;border-color:#ccc;border-radius:4px;border-style:solid;border-width:1px;font-family:'Open Sans',Arial,Helvetica,sans-serif;font-size:14px;line-height:20px;margin-bottom:0;margin-top:0;padding:10px 10px;width:100%;box-sizing:border-box;overflow-y:initial}#mlb2-1709472.ml-form-embedContainer .ml-form-embedWrapper .ml-form-embedBody .ml-form-horizontalRow button{background-color:#000!important;border-color:#000;border-style:solid;border-width:1px;border-radius:4px;box-shadow:none;color:#fff!important;cursor:pointer;font-family:'Open Sans',Arial,Helvetica,sans-serif;font-size:14px!important;font-weight:700;line-height:20px;margin:0!important;padding:10px!important;width:100%;height:auto}#mlb2-1709472.ml-form-embedContainer .ml-form-embedWrapper .ml-form-embedBody .ml-form-horizontalRow button:hover{background-color:#333!important;border-color:#333!important}#mlb2-1709472.ml-form-embedContainer .ml-form-embedWrapper .ml-form-embedBody .ml-form-checkboxRow input[type=checkbox]{box-sizing:border-box;padding:0;position:absolute;z-index:-1;opacity:0;margin-top:5px;margin-left:-1.5rem;overflow:visible}#mlb2-1709472.ml-form-embedContainer .ml-form-embedWrapper .ml-form-embedBody .ml-form-checkboxRow .label-description{color:#000;display:block;font-family:'Open Sans',Arial,Helvetica,sans-serif;font-size:12px;text-align:left;margin-bottom:0;position:relative;vertical-align:top}#mlb2-1709472.ml-form-embedContainer .ml-form-embedWrapper .ml-form-embedBody .ml-form-checkboxRow label{font-weight:400;margin:0;padding:0;position:relative;display:block;min-height:24px;padding-left:24px}#mlb2-1709472.ml-form-embedContainer .ml-form-embedWrapper .ml-form-embedBody .ml-form-checkboxRow label a{color:#000;text-decoration:underline}#mlb2-1709472.ml-form-embedContainer .ml-form-embedWrapper .ml-form-embedBody .ml-form-checkboxRow label p{color:#000!important;font-family:'Open Sans',Arial,Helvetica,sans-serif!important;font-size:12px!important;font-weight:400!important;line-height:18px!important;padding:0!important;margin:0 5px 0 0!important}#mlb2-1709472.ml-form-embedContainer .ml-form-embedWrapper .ml-form-embedBody .ml-form-checkboxRow label p:last-child{margin:0}#mlb2-1709472.ml-form-embedContainer .ml-form-embedWrapper .ml-form-embedBody .ml-form-embedSubmit{margin:0 0 20px 0;float:left;width:100%}#mlb2-1709472.ml-form-embedContainer .ml-form-embedWrapper .ml-form-embedBody .ml-form-embedSubmit button{background-color:#000!important;border:none!important;border-radius:4px!important;box-shadow:none!important;color:#fff!important;cursor:pointer;font-family:'Open Sans',Arial,Helvetica,sans-serif!important;font-size:14px!important;font-weight:700!important;line-height:21px!important;height:auto;padding:10px!important;width:100%!important;box-sizing:border-box!important}#mlb2-1709472.ml-form-embedContainer .ml-form-embedWrapper .ml-form-embedBody .ml-form-embedSubmit button.loading{display:none}#mlb2-1709472.ml-form-embedContainer .ml-form-embedWrapper .ml-form-embedBody .ml-form-embedSubmit button:hover{background-color:#333!important}.ml-subscribe-close{width:30px;height:30px;background:url(https://cdn.mailerlite.com/images/def...) no-repeat;background-size:30px;cursor:pointer;margin-top:-10px;margin-right:-10px;position:absolute;top:0;right:0}.ml-error input{border-color:red!important}.ml-error .label-description,.ml-error .label-description p,.ml-error .label-description p a,.ml-error label:first-child{color:red!important}#mlb2-1709472.ml-form-embedContainer .ml-form-embedWrapper .ml-form-embedBody .ml-form-checkboxRow.ml-error .label-description p,#mlb2-1709472.ml-form-embedContainer .ml-form-embedWrapper .ml-form-embedBody .ml-form-checkboxRow.ml-error .label-description p:first-letter{color:red!important}@media only screen and (max-width:400px){.ml-form-embedWrapper.embedDefault,.ml-form-embedWrapper.embedPopup{width:100%!important}.ml-form-formContent.horozintalForm{float:left!important}.ml-form-formContent.horozintalForm .ml-form-horizontalRow{height:auto!important;width:100%!important;float:left!important}.ml-form-formContent.horozintalForm .ml-form-horizontalRow .ml-input-horizontal{width:100%!important}.ml-form-formContent.horozintalForm .ml-form-horizontalRow .ml-input-horizontal>div{padding-right:0!important;padding-bottom:10px}.ml-form-formContent.horozintalForm .ml-button-horizontal{width:100%!important}.ml-form-formContent.horozintalForm .ml-button-horizontal.labelsOn{padding-top:0!important}} Tired of struggling with the TECHNICAL ASPECTS of being an author? Receive a monthly newsletter filled with tech hints and helpful pearls of wisdom. No spam – only valuable information.Subscribe Loading… Thank you!
You have successfully joined our subscriber list.
function ml_webform_success_1709472(){var r=ml_jQuery||jQuery;r(".ml-subscribe-form-1709472 .row-success").show(),r(".ml-subscribe-form-1709472 .row-form").hide()}
The post 10 Facebook Statistics Every Business Owner & Marketer Should Know In 2021 [Infographic] appeared first on Bakerview Consulting.


July 14, 2021
19+ Interesting Instagram Facts And Figures [Infographic 2021]
Welcome Back!
Today’s infographic can build on what we discussed in last week’s post. As I frequently say, knowledge is power. See if some of these facts and figures help you harness Instagram better. Be sure to visit the original blog that posted this information and read the full post.
[image error]I hope you enjoyed this infographic. Please use the share buttons below to share with friends that might benefit from this information. If you haven’t already, please subscribe to my mailing list and receive some technical hints focused at your needs!
@import url(https://static.mailerlite.com/assets/... .ml-form-embedSubmitLoad{display:inline-block;width:20px;height:20px}.sr-only{position:absolute;width:1px;height:1px;padding:0;margin:-1px;overflow:hidden;clip:rect(0,0,0,0);border:0}.ml-form-embedSubmitLoad:after{content:" ";display:block;width:11px;height:11px;margin:1px;border-radius:50%;border:4px solid #fff;border-color:#fff #fff #fff transparent;animation:ml-form-embedSubmitLoad 1.2s linear infinite}@keyframes ml-form-embedSubmitLoad{0%{transform:rotate(0)}100%{transform:rotate(360deg)}}#mlb2-1709472.ml-form-embedContainer{box-sizing:border-box;display:table;margin:0 auto;position:static;width:100%!important}#mlb2-1709472.ml-form-embedContainer button,#mlb2-1709472.ml-form-embedContainer h4,#mlb2-1709472.ml-form-embedContainer p,#mlb2-1709472.ml-form-embedContainer span{text-transform:none!important;letter-spacing:normal!important}#mlb2-1709472.ml-form-embedContainer .ml-form-embedWrapper{background-color:#f6f6f6;border-width:0;border-color:transparent;border-radius:4px;border-style:solid;box-sizing:border-box;display:inline-block!important;margin:0;padding:0;position:relative}#mlb2-1709472.ml-form-embedContainer .ml-form-embedWrapper.embedDefault,#mlb2-1709472.ml-form-embedContainer .ml-form-embedWrapper.embedPopup{width:400px}#mlb2-1709472.ml-form-embedContainer .ml-form-embedWrapper.embedForm{max-width:400px;width:100%}#mlb2-1709472.ml-form-embedContainer .ml-form-align-left{text-align:left}#mlb2-1709472.ml-form-embedContainer .ml-form-align-center{text-align:center}#mlb2-1709472.ml-form-embedContainer .ml-form-align-default{display:table-cell!important;vertical-align:middle!important;text-align:center!important}#mlb2-1709472.ml-form-embedContainer .ml-form-align-right{text-align:right}#mlb2-1709472.ml-form-embedContainer .ml-form-embedWrapper .ml-form-embedHeader img{border-top-left-radius:4px;border-top-right-radius:4px;height:auto;margin:0 auto!important;max-width:100%;width:undefinedpx}#mlb2-1709472.ml-form-embedContainer .ml-form-embedWrapper .ml-form-embedBody,#mlb2-1709472.ml-form-embedContainer .ml-form-embedWrapper .ml-form-successBody{padding:20px 20px 0 20px}#mlb2-1709472.ml-form-embedContainer .ml-form-embedWrapper .ml-form-embedBody.ml-form-embedBodyHorizontal{padding-bottom:0}#mlb2-1709472.ml-form-embedContainer .ml-form-embedWrapper .ml-form-embedBody .ml-form-embedContent,#mlb2-1709472.ml-form-embedContainer .ml-form-embedWrapper .ml-form-successBody .ml-form-successContent{text-align:left;margin:0 0 20px 0}#mlb2-1709472.ml-form-embedContainer .ml-form-embedWrapper .ml-form-embedBody .ml-form-embedContent h4,#mlb2-1709472.ml-form-embedContainer .ml-form-embedWrapper .ml-form-successBody .ml-form-successContent h4{color:#000;font-family:'Open Sans',Arial,Helvetica,sans-serif;font-size:30px;font-weight:400;margin:0 0 10px 0;text-align:left;word-break:break-word}#mlb2-1709472.ml-form-embedContainer .ml-form-embedWrapper .ml-form-embedBody .ml-form-embedContent p,#mlb2-1709472.ml-form-embedContainer .ml-form-embedWrapper .ml-form-successBody .ml-form-successContent p{color:#000;font-family:'Open Sans',Arial,Helvetica,sans-serif;font-size:14px;font-weight:400;line-height:20px;margin:0 0 10px 0;text-align:left}#mlb2-1709472.ml-form-embedContainer .ml-form-embedWrapper .ml-form-embedBody .ml-form-embedContent ol,#mlb2-1709472.ml-form-embedContainer .ml-form-embedWrapper .ml-form-embedBody .ml-form-embedContent ul,#mlb2-1709472.ml-form-embedContainer .ml-form-embedWrapper .ml-form-successBody .ml-form-successContent ol,#mlb2-1709472.ml-form-embedContainer .ml-form-embedWrapper .ml-form-successBody .ml-form-successContent ul{color:#000;font-family:'Open Sans',Arial,Helvetica,sans-serif;font-size:14px}#mlb2-1709472.ml-form-embedContainer .ml-form-embedWrapper .ml-form-embedBody .ml-form-embedContent ol ol,#mlb2-1709472.ml-form-embedContainer .ml-form-embedWrapper .ml-form-successBody .ml-form-successContent ol ol{list-style-type:lower-alpha}#mlb2-1709472.ml-form-embedContainer .ml-form-embedWrapper .ml-form-embedBody .ml-form-embedContent ol ol ol,#mlb2-1709472.ml-form-embedContainer .ml-form-embedWrapper .ml-form-successBody .ml-form-successContent ol ol ol{list-style-type:lower-roman}#mlb2-1709472.ml-form-embedContainer .ml-form-embedWrapper .ml-form-embedBody .ml-form-embedContent p a,#mlb2-1709472.ml-form-embedContainer .ml-form-embedWrapper .ml-form-successBody .ml-form-successContent p a{color:#000;text-decoration:underline}#mlb2-1709472.ml-form-embedContainer .ml-form-embedWrapper .ml-block-form .ml-field-group{text-align:left!important}#mlb2-1709472.ml-form-embedContainer .ml-form-embedWrapper .ml-block-form .ml-field-group label{margin-bottom:5px;color:#333;font-size:14px;font-family:'Open Sans',Arial,Helvetica,sans-serif;font-weight:700;font-style:normal;text-decoration:none;display:inline-block;line-height:20px}#mlb2-1709472.ml-form-embedContainer .ml-form-embedWrapper .ml-form-embedBody .ml-form-embedContent p:last-child,#mlb2-1709472.ml-form-embedContainer .ml-form-embedWrapper .ml-form-successBody .ml-form-successContent p:last-child{margin:0}#mlb2-1709472.ml-form-embedContainer .ml-form-embedWrapper .ml-form-embedBody form{margin:0;width:100%}#mlb2-1709472.ml-form-embedContainer .ml-form-embedWrapper .ml-form-embedBody .ml-form-checkboxRow,#mlb2-1709472.ml-form-embedContainer .ml-form-embedWrapper .ml-form-embedBody .ml-form-formContent{margin:0 0 20px 0;width:100%}#mlb2-1709472.ml-form-embedContainer .ml-form-embedWrapper .ml-form-embedBody .ml-form-checkboxRow{float:left}#mlb2-1709472.ml-form-embedContainer .ml-form-embedWrapper .ml-form-embedBody .ml-form-formContent.horozintalForm{margin:0;padding:0 0 20px 0;width:100%;height:auto;float:left}#mlb2-1709472.ml-form-embedContainer .ml-form-embedWrapper .ml-form-embedBody .ml-form-fieldRow{margin:0 0 10px 0;width:100%}#mlb2-1709472.ml-form-embedContainer .ml-form-embedWrapper .ml-form-embedBody .ml-form-fieldRow.ml-last-item{margin:0}#mlb2-1709472.ml-form-embedContainer .ml-form-embedWrapper .ml-form-embedBody .ml-form-fieldRow.ml-formfieldHorizintal{margin:0}#mlb2-1709472.ml-form-embedContainer .ml-form-embedWrapper .ml-form-embedBody .ml-form-fieldRow input{background-color:#fff!important;color:#333!important;border-color:#ccc;border-radius:4px!important;border-style:solid!important;border-width:1px!important;font-family:'Open Sans',Arial,Helvetica,sans-serif;font-size:14px!important;height:auto;line-height:21px!important;margin-bottom:0;margin-top:0;margin-left:0;margin-right:0;padding:10px 10px!important;width:100%!important;box-sizing:border-box!important;max-width:100%!important}#mlb2-1709472.ml-form-embedContainer .ml-form-embedWrapper .ml-form-embedBody .ml-form-fieldRow input::-webkit-input-placeholder,#mlb2-1709472.ml-form-embedContainer .ml-form-embedWrapper .ml-form-embedBody .ml-form-horizontalRow input::-webkit-input-placeholder{color:#333}#mlb2-1709472.ml-form-embedContainer .ml-form-embedWrapper .ml-form-embedBody .ml-form-fieldRow input::-moz-placeholder,#mlb2-1709472.ml-form-embedContainer .ml-form-embedWrapper .ml-form-embedBody .ml-form-horizontalRow input::-moz-placeholder{color:#333}#mlb2-1709472.ml-form-embedContainer .ml-form-embedWrapper .ml-form-embedBody .ml-form-fieldRow input:-ms-input-placeholder,#mlb2-1709472.ml-form-embedContainer .ml-form-embedWrapper .ml-form-embedBody .ml-form-horizontalRow input:-ms-input-placeholder{color:#333}#mlb2-1709472.ml-form-embedContainer .ml-form-embedWrapper .ml-form-embedBody .ml-form-fieldRow input:-moz-placeholder,#mlb2-1709472.ml-form-embedContainer .ml-form-embedWrapper .ml-form-embedBody .ml-form-horizontalRow input:-moz-placeholder{color:#333}#mlb2-1709472.ml-form-embedContainer .ml-form-embedWrapper .ml-form-embedBody .ml-form-fieldRow textarea,#mlb2-1709472.ml-form-embedContainer .ml-form-embedWrapper .ml-form-embedBody .ml-form-horizontalRow textarea{background-color:#fff!important;color:#333!important;border-color:#ccc!important;border-radius:4px!important;border-style:solid!important;border-width:1px!important;font-family:'Open Sans',Arial,Helvetica,sans-serif;font-size:14px!important;height:auto;line-height:21px!important;margin-bottom:0;margin-top:0;padding:10px 10px!important;width:100%!important;box-sizing:border-box!important;max-width:100%!important}#mlb2-1709472.ml-form-embedContainer .ml-form-embedWrapper .ml-form-embedBody .ml-form-checkboxRow .label-description::before,#mlb2-1709472.ml-form-embedContainer .ml-form-embedWrapper .ml-form-embedBody .ml-form-embedPermissions .ml-form-embedPermissionsOptionsCheckbox .label-description::before,#mlb2-1709472.ml-form-embedContainer .ml-form-embedWrapper .ml-form-embedBody .ml-form-fieldRow .custom-checkbox .custom-control-label::before,#mlb2-1709472.ml-form-embedContainer .ml-form-embedWrapper .ml-form-embedBody .ml-form-fieldRow .custom-radio .custom-control-label::before,#mlb2-1709472.ml-form-embedContainer .ml-form-embedWrapper .ml-form-embedBody .ml-form-horizontalRow .custom-checkbox .custom-control-label::before,#mlb2-1709472.ml-form-embedContainer .ml-form-embedWrapper .ml-form-embedBody .ml-form-horizontalRow .custom-radio .custom-control-label::before,#mlb2-1709472.ml-form-embedContainer .ml-form-embedWrapper .ml-form-embedBody .ml-form-interestGroupsRow .ml-form-interestGroupsRowCheckbox .label-description::before{border-color:#ccc!important;background-color:#fff!important}#mlb2-1709472.ml-form-embedContainer .ml-form-embedWrapper .ml-form-embedBody .ml-form-fieldRow input.custom-control-input[type=checkbox]{box-sizing:border-box;padding:0;position:absolute;z-index:-1;opacity:0;margin-top:5px;margin-left:-1.5rem;overflow:visible}#mlb2-1709472.ml-form-embedContainer .ml-form-embedWrapper .ml-form-embedBody .ml-form-checkboxRow .label-description::before,#mlb2-1709472.ml-form-embedContainer .ml-form-embedWrapper .ml-form-embedBody .ml-form-embedPermissions .ml-form-embedPermissionsOptionsCheckbox .label-description::before,#mlb2-1709472.ml-form-embedContainer .ml-form-embedWrapper .ml-form-embedBody .ml-form-fieldRow .custom-checkbox .custom-control-label::before,#mlb2-1709472.ml-form-embedContainer .ml-form-embedWrapper .ml-form-embedBody .ml-form-horizontalRow .custom-checkbox .custom-control-label::before,#mlb2-1709472.ml-form-embedContainer .ml-form-embedWrapper .ml-form-embedBody .ml-form-interestGroupsRow .ml-form-interestGroupsRowCheckbox .label-description::before{border-radius:4px!important}#mlb2-1709472.ml-form-embedContainer .ml-form-embedWrapper .ml-form-embedBody .ml-form-checkboxRow input[type=checkbox]:checked~.label-description::after,#mlb2-1709472.ml-form-embedContainer .ml-form-embedWrapper .ml-form-embedBody .ml-form-embedPermissions .ml-form-embedPermissionsOptionsCheckbox input[type=checkbox]:checked~.label-description::after,#mlb2-1709472.ml-form-embedContainer .ml-form-embedWrapper .ml-form-embedBody .ml-form-fieldRow .custom-checkbox .custom-control-input:checked~.custom-control-label::after,#mlb2-1709472.ml-form-embedContainer .ml-form-embedWrapper .ml-form-embedBody .ml-form-horizontalRow .custom-checkbox .custom-control-input:checked~.custom-control-label::after,#mlb2-1709472.ml-form-embedContainer .ml-form-embedWrapper .ml-form-embedBody .ml-form-interestGroupsRow .ml-form-interestGroupsRowCheckbox input[type=checkbox]:checked~.label-description::after{background-image:url("data:image/svg+xml,%3csvg xmlns='http://www.w3.org/2000/svg' viewBox='0 0 8 8'%3e%3cpath fill='%23fff' d='M6.564.75l-3.59 3.612-1.538-1.55L0 4.26 2.974 7.25 8 2.193z'/%3e%3c/svg%3e")}#mlb2-1709472.ml-form-embedContainer .ml-form-embedWrapper .ml-form-embedBody .ml-form-fieldRow .custom-radio .custom-control-input:checked~.custom-control-label::after{background-image:url("data:image/svg+xml,%3csvg xmlns='http://www.w3.org/2000/svg' viewBox='-4 -4 8 8'%3e%3ccircle r='3' fill='%23fff'/%3e%3c/svg%3e")}#mlb2-1709472.ml-form-embedContainer .ml-form-embedWrapper .ml-form-embedBody .ml-form-checkboxRow input[type=checkbox]:checked~.label-description::before,#mlb2-1709472.ml-form-embedContainer .ml-form-embedWrapper .ml-form-embedBody .ml-form-embedPermissions .ml-form-embedPermissionsOptionsCheckbox input[type=checkbox]:checked~.label-description::before,#mlb2-1709472.ml-form-embedContainer .ml-form-embedWrapper .ml-form-embedBody .ml-form-fieldRow .custom-checkbox .custom-control-input:checked~.custom-control-label::before,#mlb2-1709472.ml-form-embedContainer .ml-form-embedWrapper .ml-form-embedBody .ml-form-fieldRow .custom-radio .custom-control-input:checked~.custom-control-label::before,#mlb2-1709472.ml-form-embedContainer .ml-form-embedWrapper .ml-form-embedBody .ml-form-horizontalRow .custom-checkbox .custom-control-input:checked~.custom-control-label::before,#mlb2-1709472.ml-form-embedContainer .ml-form-embedWrapper .ml-form-embedBody .ml-form-horizontalRow .custom-radio .custom-control-input:checked~.custom-control-label::before,#mlb2-1709472.ml-form-embedContainer .ml-form-embedWrapper .ml-form-embedBody .ml-form-interestGroupsRow .ml-form-interestGroupsRowCheckbox input[type=checkbox]:checked~.label-description::before{border-color:#000!important;background-color:#000!important;color:#fff!important}#mlb2-1709472.ml-form-embedContainer .ml-form-embedWrapper .ml-form-embedBody .ml-form-fieldRow .custom-checkbox .custom-control-label::after,#mlb2-1709472.ml-form-embedContainer .ml-form-embedWrapper .ml-form-embedBody .ml-form-fieldRow .custom-checkbox .custom-control-label::before,#mlb2-1709472.ml-form-embedContainer .ml-form-embedWrapper .ml-form-embedBody .ml-form-fieldRow .custom-radio .custom-control-label::after,#mlb2-1709472.ml-form-embedContainer .ml-form-embedWrapper .ml-form-embedBody .ml-form-fieldRow .custom-radio .custom-control-label::before,#mlb2-1709472.ml-form-embedContainer .ml-form-embedWrapper .ml-form-embedBody .ml-form-horizontalRow .custom-checkbox .custom-control-label::after,#mlb2-1709472.ml-form-embedContainer .ml-form-embedWrapper .ml-form-embedBody .ml-form-horizontalRow .custom-checkbox .custom-control-label::before,#mlb2-1709472.ml-form-embedContainer .ml-form-embedWrapper .ml-form-embedBody .ml-form-horizontalRow .custom-radio .custom-control-label::after,#mlb2-1709472.ml-form-embedContainer .ml-form-embedWrapper .ml-form-embedBody .ml-form-horizontalRow .custom-radio .custom-control-label::before{top:2px;box-sizing:border-box}#mlb2-1709472.ml-form-embedContainer .ml-form-embedWrapper .ml-form-embedBody .ml-form-checkboxRow .label-description::after,#mlb2-1709472.ml-form-embedContainer .ml-form-embedWrapper .ml-form-embedBody .ml-form-checkboxRow .label-description::before,#mlb2-1709472.ml-form-embedContainer .ml-form-embedWrapper .ml-form-embedBody .ml-form-embedPermissions .ml-form-embedPermissionsOptionsCheckbox .label-description::after,#mlb2-1709472.ml-form-embedContainer .ml-form-embedWrapper .ml-form-embedBody .ml-form-embedPermissions .ml-form-embedPermissionsOptionsCheckbox .label-description::before{top:0!important;box-sizing:border-box!important}#mlb2-1709472.ml-form-embedContainer .ml-form-embedWrapper .ml-form-embedBody .ml-form-checkboxRow .label-description::after,#mlb2-1709472.ml-form-embedContainer .ml-form-embedWrapper .ml-form-embedBody .ml-form-checkboxRow .label-description::before{top:0!important;box-sizing:border-box!important}#mlb2-1709472.ml-form-embedContainer .ml-form-embedWrapper .ml-form-embedBody .ml-form-interestGroupsRow .ml-form-interestGroupsRowCheckbox .label-description::after{top:0!important;box-sizing:border-box!important;position:absolute;left:-1.5rem;display:block;width:1rem;height:1rem;content:""}#mlb2-1709472.ml-form-embedContainer .ml-form-embedWrapper .ml-form-embedBody .ml-form-interestGroupsRow .ml-form-interestGroupsRowCheckbox .label-description::before{top:0!important;box-sizing:border-box!important}#mlb2-1709472.ml-form-embedContainer .ml-form-embedWrapper .ml-form-embedBody .custom-control-label::before{position:absolute;top:4px;left:-1.5rem;display:block;width:16px;height:16px;pointer-events:none;content:"";background-color:#fff;border:#adb5bd solid 1px;border-radius:50%}#mlb2-1709472.ml-form-embedContainer .ml-form-embedWrapper .ml-form-embedBody .custom-control-label::after{position:absolute;top:2px!important;left:-1.5rem;display:block;width:1rem;height:1rem;content:""}#mlb2-1709472.ml-form-embedContainer .ml-form-embedWrapper .ml-form-embedBody .ml-form-checkboxRow .label-description::before,#mlb2-1709472.ml-form-embedContainer .ml-form-embedWrapper .ml-form-embedBody .ml-form-embedPermissions .ml-form-embedPermissionsOptionsCheckbox .label-description::before,#mlb2-1709472.ml-form-embedContainer .ml-form-embedWrapper .ml-form-embedBody .ml-form-interestGroupsRow .ml-form-interestGroupsRowCheckbox .label-description::before{position:absolute;top:4px;left:-1.5rem;display:block;width:16px;height:16px;pointer-events:none;content:"";background-color:#fff;border:#adb5bd solid 1px;border-radius:50%}#mlb2-1709472.ml-form-embedContainer .ml-form-embedWrapper .ml-form-embedBody .ml-form-embedPermissions .ml-form-embedPermissionsOptionsCheckbox .label-description::after{position:absolute;top:0!important;left:-1.5rem;display:block;width:1rem;height:1rem;content:""}#mlb2-1709472.ml-form-embedContainer .ml-form-embedWrapper .ml-form-embedBody .ml-form-checkboxRow .label-description::after{position:absolute;top:0!important;left:-1.5rem;display:block;width:1rem;height:1rem;content:""}#mlb2-1709472.ml-form-embedContainer .ml-form-embedWrapper .ml-form-embedBody .custom-radio .custom-control-label::after{background:no-repeat 50%/50% 50%}#mlb2-1709472.ml-form-embedContainer .ml-form-embedWrapper .ml-form-embedBody .custom-checkbox .custom-control-label::after,#mlb2-1709472.ml-form-embedContainer .ml-form-embedWrapper .ml-form-embedBody .ml-form-checkboxRow .label-description::after,#mlb2-1709472.ml-form-embedContainer .ml-form-embedWrapper .ml-form-embedBody .ml-form-embedPermissions .ml-form-embedPermissionsOptionsCheckbox .label-description::after,#mlb2-1709472.ml-form-embedContainer .ml-form-embedWrapper .ml-form-embedBody .ml-form-interestGroupsRow .ml-form-interestGroupsRowCheckbox .label-description::after{background:no-repeat 50%/50% 50%}#mlb2-1709472.ml-form-embedContainer .ml-form-embedWrapper .ml-form-embedBody .ml-form-fieldRow .custom-control,#mlb2-1709472.ml-form-embedContainer .ml-form-embedWrapper .ml-form-embedBody .ml-form-horizontalRow .custom-control{position:relative;display:block;min-height:1.5rem;padding-left:1.5rem}#mlb2-1709472.ml-form-embedContainer .ml-form-embedWrapper .ml-form-embedBody .ml-form-fieldRow .custom-checkbox .custom-control-input,#mlb2-1709472.ml-form-embedContainer .ml-form-embedWrapper .ml-form-embedBody .ml-form-fieldRow .custom-radio .custom-control-input,#mlb2-1709472.ml-form-embedContainer .ml-form-embedWrapper .ml-form-embedBody .ml-form-horizontalRow .custom-checkbox .custom-control-input,#mlb2-1709472.ml-form-embedContainer .ml-form-embedWrapper .ml-form-embedBody .ml-form-horizontalRow .custom-radio .custom-control-input{position:absolute;z-index:-1;opacity:0;box-sizing:border-box;padding:0}#mlb2-1709472.ml-form-embedContainer .ml-form-embedWrapper .ml-form-embedBody .ml-form-fieldRow .custom-checkbox .custom-control-label,#mlb2-1709472.ml-form-embedContainer .ml-form-embedWrapper .ml-form-embedBody .ml-form-fieldRow .custom-radio .custom-control-label,#mlb2-1709472.ml-form-embedContainer .ml-form-embedWrapper .ml-form-embedBody .ml-form-horizontalRow .custom-checkbox .custom-control-label,#mlb2-1709472.ml-form-embedContainer .ml-form-embedWrapper .ml-form-embedBody .ml-form-horizontalRow .custom-radio .custom-control-label{color:#000;font-size:12px!important;font-family:'Open Sans',Arial,Helvetica,sans-serif;line-height:22px;margin-bottom:0;position:relative;vertical-align:top;font-style:normal;font-weight:700}#mlb2-1709472.ml-form-embedContainer .ml-form-embedWrapper .ml-form-embedBody .ml-form-fieldRow .custom-select,#mlb2-1709472.ml-form-embedContainer .ml-form-embedWrapper .ml-form-embedBody .ml-form-horizontalRow .custom-select{background-color:#fff!important;color:#333!important;border-color:#ccc!important;border-radius:4px!important;border-style:solid!important;border-width:1px!important;font-family:'Open Sans',Arial,Helvetica,sans-serif;font-size:14px!important;line-height:20px!important;margin-bottom:0;margin-top:0;padding:10px 28px 10px 12px!important;width:100%!important;box-sizing:border-box!important;max-width:100%!important;height:auto;display:inline-block;vertical-align:middle;background:url(https://cdn.mailerlite.com/images/def...) no-repeat right .75rem center/8px 10px;-webkit-appearance:none;-moz-appearance:none;appearance:none}#mlb2-1709472.ml-form-embedContainer .ml-form-embedWrapper .ml-form-embedBody .ml-form-horizontalRow{height:auto;width:100%;float:left}.ml-form-formContent.horozintalForm .ml-form-horizontalRow .ml-input-horizontal{width:70%;float:left}.ml-form-formContent.horozintalForm .ml-form-horizontalRow .ml-button-horizontal{width:30%;float:left}.ml-form-formContent.horozintalForm .ml-form-horizontalRow .ml-button-horizontal.labelsOn{padding-top:25px}.ml-form-formContent.horozintalForm .ml-form-horizontalRow .horizontal-fields{box-sizing:border-box;float:left;padding-right:10px}#mlb2-1709472.ml-form-embedContainer .ml-form-embedWrapper .ml-form-embedBody .ml-form-horizontalRow input{background-color:#fff;color:#333;border-color:#ccc;border-radius:4px;border-style:solid;border-width:1px;font-family:'Open Sans',Arial,Helvetica,sans-serif;font-size:14px;line-height:20px;margin-bottom:0;margin-top:0;padding:10px 10px;width:100%;box-sizing:border-box;overflow-y:initial}#mlb2-1709472.ml-form-embedContainer .ml-form-embedWrapper .ml-form-embedBody .ml-form-horizontalRow button{background-color:#000!important;border-color:#000;border-style:solid;border-width:1px;border-radius:4px;box-shadow:none;color:#fff!important;cursor:pointer;font-family:'Open Sans',Arial,Helvetica,sans-serif;font-size:14px!important;font-weight:700;line-height:20px;margin:0!important;padding:10px!important;width:100%;height:auto}#mlb2-1709472.ml-form-embedContainer .ml-form-embedWrapper .ml-form-embedBody .ml-form-horizontalRow button:hover{background-color:#333!important;border-color:#333!important}#mlb2-1709472.ml-form-embedContainer .ml-form-embedWrapper .ml-form-embedBody .ml-form-checkboxRow input[type=checkbox]{box-sizing:border-box;padding:0;position:absolute;z-index:-1;opacity:0;margin-top:5px;margin-left:-1.5rem;overflow:visible}#mlb2-1709472.ml-form-embedContainer .ml-form-embedWrapper .ml-form-embedBody .ml-form-checkboxRow .label-description{color:#000;display:block;font-family:'Open Sans',Arial,Helvetica,sans-serif;font-size:12px;text-align:left;margin-bottom:0;position:relative;vertical-align:top}#mlb2-1709472.ml-form-embedContainer .ml-form-embedWrapper .ml-form-embedBody .ml-form-checkboxRow label{font-weight:400;margin:0;padding:0;position:relative;display:block;min-height:24px;padding-left:24px}#mlb2-1709472.ml-form-embedContainer .ml-form-embedWrapper .ml-form-embedBody .ml-form-checkboxRow label a{color:#000;text-decoration:underline}#mlb2-1709472.ml-form-embedContainer .ml-form-embedWrapper .ml-form-embedBody .ml-form-checkboxRow label p{color:#000!important;font-family:'Open Sans',Arial,Helvetica,sans-serif!important;font-size:12px!important;font-weight:400!important;line-height:18px!important;padding:0!important;margin:0 5px 0 0!important}#mlb2-1709472.ml-form-embedContainer .ml-form-embedWrapper .ml-form-embedBody .ml-form-checkboxRow label p:last-child{margin:0}#mlb2-1709472.ml-form-embedContainer .ml-form-embedWrapper .ml-form-embedBody .ml-form-embedSubmit{margin:0 0 20px 0;float:left;width:100%}#mlb2-1709472.ml-form-embedContainer .ml-form-embedWrapper .ml-form-embedBody .ml-form-embedSubmit button{background-color:#000!important;border:none!important;border-radius:4px!important;box-shadow:none!important;color:#fff!important;cursor:pointer;font-family:'Open Sans',Arial,Helvetica,sans-serif!important;font-size:14px!important;font-weight:700!important;line-height:21px!important;height:auto;padding:10px!important;width:100%!important;box-sizing:border-box!important}#mlb2-1709472.ml-form-embedContainer .ml-form-embedWrapper .ml-form-embedBody .ml-form-embedSubmit button.loading{display:none}#mlb2-1709472.ml-form-embedContainer .ml-form-embedWrapper .ml-form-embedBody .ml-form-embedSubmit button:hover{background-color:#333!important}.ml-subscribe-close{width:30px;height:30px;background:url(https://cdn.mailerlite.com/images/def...) no-repeat;background-size:30px;cursor:pointer;margin-top:-10px;margin-right:-10px;position:absolute;top:0;right:0}.ml-error input{border-color:red!important}.ml-error .label-description,.ml-error .label-description p,.ml-error .label-description p a,.ml-error label:first-child{color:red!important}#mlb2-1709472.ml-form-embedContainer .ml-form-embedWrapper .ml-form-embedBody .ml-form-checkboxRow.ml-error .label-description p,#mlb2-1709472.ml-form-embedContainer .ml-form-embedWrapper .ml-form-embedBody .ml-form-checkboxRow.ml-error .label-description p:first-letter{color:red!important}@media only screen and (max-width:400px){.ml-form-embedWrapper.embedDefault,.ml-form-embedWrapper.embedPopup{width:100%!important}.ml-form-formContent.horozintalForm{float:left!important}.ml-form-formContent.horozintalForm .ml-form-horizontalRow{height:auto!important;width:100%!important;float:left!important}.ml-form-formContent.horozintalForm .ml-form-horizontalRow .ml-input-horizontal{width:100%!important}.ml-form-formContent.horozintalForm .ml-form-horizontalRow .ml-input-horizontal>div{padding-right:0!important;padding-bottom:10px}.ml-form-formContent.horozintalForm .ml-button-horizontal{width:100%!important}.ml-form-formContent.horozintalForm .ml-button-horizontal.labelsOn{padding-top:0!important}} Tired of struggling with the TECHNICAL ASPECTS of being an author? Receive a monthly newsletter filled with tech hints and helpful pearls of wisdom. No spam – only valuable information.Subscribe Loading… Thank you!
You have successfully joined our subscriber list.
function ml_webform_success_1709472(){var r=ml_jQuery||jQuery;r(".ml-subscribe-form-1709472 .row-success").show(),r(".ml-subscribe-form-1709472 .row-form").hide()}The post 19+ Interesting Instagram Facts And Figures [Infographic 2021] appeared first on Bakerview Consulting.
July 8, 2021
How To Sell Your Book On Amazon [70 Book Marketing Tips]

Are you a fan of Kindlepreneur? Have you subscribed and receive their posts by email?
I am and I do. I don’t always read the posts right away – I’m frequently busy and save them for when I have some time to concentrate. And concentration is needed – these posts are filled with detail!
One question I answer frequently is “How do I market my book?” Like there is a formula that one just needs to work their way through and a million copies of your book will sell. This is, of course, not true.
The post that I’m sharing here, is a list of 70 ideas. Great ideas – not throwaway, stupid things – actionable, helpful ideas. I just had to share!
If you haven’t already subscribed to Dave’s site, please do, when you jump over to read this great list of ideas!
Hope you are enjoying your summer weather! Please use the share buttons below to share with friends that might benefit from this information. If you haven’t already, please subscribe to my mailing list and receive some technical hints focused at your needs!
I hope you enjoyed this infographic. Please use the share buttons below to share with friends that might benefit from this information. If you haven’t already, please subscribe to my mailing list and receive some technical hints focused at your needs!
@import url(https://static.mailerlite.com/assets/... .ml-form-embedSubmitLoad{display:inline-block;width:20px;height:20px}.sr-only{position:absolute;width:1px;height:1px;padding:0;margin:-1px;overflow:hidden;clip:rect(0,0,0,0);border:0}.ml-form-embedSubmitLoad:after{content:" ";display:block;width:11px;height:11px;margin:1px;border-radius:50%;border:4px solid #fff;border-color:#fff #fff #fff transparent;animation:ml-form-embedSubmitLoad 1.2s linear infinite}@keyframes ml-form-embedSubmitLoad{0%{transform:rotate(0)}100%{transform:rotate(360deg)}}#mlb2-1709472.ml-form-embedContainer{box-sizing:border-box;display:table;margin:0 auto;position:static;width:100%!important}#mlb2-1709472.ml-form-embedContainer button,#mlb2-1709472.ml-form-embedContainer h4,#mlb2-1709472.ml-form-embedContainer p,#mlb2-1709472.ml-form-embedContainer span{text-transform:none!important;letter-spacing:normal!important}#mlb2-1709472.ml-form-embedContainer .ml-form-embedWrapper{background-color:#f6f6f6;border-width:0;border-color:transparent;border-radius:4px;border-style:solid;box-sizing:border-box;display:inline-block!important;margin:0;padding:0;position:relative}#mlb2-1709472.ml-form-embedContainer .ml-form-embedWrapper.embedDefault,#mlb2-1709472.ml-form-embedContainer .ml-form-embedWrapper.embedPopup{width:400px}#mlb2-1709472.ml-form-embedContainer .ml-form-embedWrapper.embedForm{max-width:400px;width:100%}#mlb2-1709472.ml-form-embedContainer .ml-form-align-left{text-align:left}#mlb2-1709472.ml-form-embedContainer .ml-form-align-center{text-align:center}#mlb2-1709472.ml-form-embedContainer .ml-form-align-default{display:table-cell!important;vertical-align:middle!important;text-align:center!important}#mlb2-1709472.ml-form-embedContainer .ml-form-align-right{text-align:right}#mlb2-1709472.ml-form-embedContainer .ml-form-embedWrapper .ml-form-embedHeader img{border-top-left-radius:4px;border-top-right-radius:4px;height:auto;margin:0 auto!important;max-width:100%;width:undefinedpx}#mlb2-1709472.ml-form-embedContainer .ml-form-embedWrapper .ml-form-embedBody,#mlb2-1709472.ml-form-embedContainer .ml-form-embedWrapper .ml-form-successBody{padding:20px 20px 0 20px}#mlb2-1709472.ml-form-embedContainer .ml-form-embedWrapper .ml-form-embedBody.ml-form-embedBodyHorizontal{padding-bottom:0}#mlb2-1709472.ml-form-embedContainer .ml-form-embedWrapper .ml-form-embedBody .ml-form-embedContent,#mlb2-1709472.ml-form-embedContainer .ml-form-embedWrapper .ml-form-successBody .ml-form-successContent{text-align:left;margin:0 0 20px 0}#mlb2-1709472.ml-form-embedContainer .ml-form-embedWrapper .ml-form-embedBody .ml-form-embedContent h4,#mlb2-1709472.ml-form-embedContainer .ml-form-embedWrapper .ml-form-successBody .ml-form-successContent h4{color:#000;font-family:'Open Sans',Arial,Helvetica,sans-serif;font-size:30px;font-weight:400;margin:0 0 10px 0;text-align:left;word-break:break-word}#mlb2-1709472.ml-form-embedContainer .ml-form-embedWrapper .ml-form-embedBody .ml-form-embedContent p,#mlb2-1709472.ml-form-embedContainer .ml-form-embedWrapper .ml-form-successBody .ml-form-successContent p{color:#000;font-family:'Open Sans',Arial,Helvetica,sans-serif;font-size:14px;font-weight:400;line-height:20px;margin:0 0 10px 0;text-align:left}#mlb2-1709472.ml-form-embedContainer .ml-form-embedWrapper .ml-form-embedBody .ml-form-embedContent ol,#mlb2-1709472.ml-form-embedContainer .ml-form-embedWrapper .ml-form-embedBody .ml-form-embedContent ul,#mlb2-1709472.ml-form-embedContainer .ml-form-embedWrapper .ml-form-successBody .ml-form-successContent ol,#mlb2-1709472.ml-form-embedContainer .ml-form-embedWrapper .ml-form-successBody .ml-form-successContent ul{color:#000;font-family:'Open Sans',Arial,Helvetica,sans-serif;font-size:14px}#mlb2-1709472.ml-form-embedContainer .ml-form-embedWrapper .ml-form-embedBody .ml-form-embedContent ol ol,#mlb2-1709472.ml-form-embedContainer .ml-form-embedWrapper .ml-form-successBody .ml-form-successContent ol ol{list-style-type:lower-alpha}#mlb2-1709472.ml-form-embedContainer .ml-form-embedWrapper .ml-form-embedBody .ml-form-embedContent ol ol ol,#mlb2-1709472.ml-form-embedContainer .ml-form-embedWrapper .ml-form-successBody .ml-form-successContent ol ol ol{list-style-type:lower-roman}#mlb2-1709472.ml-form-embedContainer .ml-form-embedWrapper .ml-form-embedBody .ml-form-embedContent p a,#mlb2-1709472.ml-form-embedContainer .ml-form-embedWrapper .ml-form-successBody .ml-form-successContent p a{color:#000;text-decoration:underline}#mlb2-1709472.ml-form-embedContainer .ml-form-embedWrapper .ml-block-form .ml-field-group{text-align:left!important}#mlb2-1709472.ml-form-embedContainer .ml-form-embedWrapper .ml-block-form .ml-field-group label{margin-bottom:5px;color:#333;font-size:14px;font-family:'Open Sans',Arial,Helvetica,sans-serif;font-weight:700;font-style:normal;text-decoration:none;display:inline-block;line-height:20px}#mlb2-1709472.ml-form-embedContainer .ml-form-embedWrapper .ml-form-embedBody .ml-form-embedContent p:last-child,#mlb2-1709472.ml-form-embedContainer .ml-form-embedWrapper .ml-form-successBody .ml-form-successContent p:last-child{margin:0}#mlb2-1709472.ml-form-embedContainer .ml-form-embedWrapper .ml-form-embedBody form{margin:0;width:100%}#mlb2-1709472.ml-form-embedContainer .ml-form-embedWrapper .ml-form-embedBody .ml-form-checkboxRow,#mlb2-1709472.ml-form-embedContainer .ml-form-embedWrapper .ml-form-embedBody .ml-form-formContent{margin:0 0 20px 0;width:100%}#mlb2-1709472.ml-form-embedContainer .ml-form-embedWrapper .ml-form-embedBody .ml-form-checkboxRow{float:left}#mlb2-1709472.ml-form-embedContainer .ml-form-embedWrapper .ml-form-embedBody .ml-form-formContent.horozintalForm{margin:0;padding:0 0 20px 0;width:100%;height:auto;float:left}#mlb2-1709472.ml-form-embedContainer .ml-form-embedWrapper .ml-form-embedBody .ml-form-fieldRow{margin:0 0 10px 0;width:100%}#mlb2-1709472.ml-form-embedContainer .ml-form-embedWrapper .ml-form-embedBody .ml-form-fieldRow.ml-last-item{margin:0}#mlb2-1709472.ml-form-embedContainer .ml-form-embedWrapper .ml-form-embedBody .ml-form-fieldRow.ml-formfieldHorizintal{margin:0}#mlb2-1709472.ml-form-embedContainer .ml-form-embedWrapper .ml-form-embedBody .ml-form-fieldRow input{background-color:#fff!important;color:#333!important;border-color:#ccc;border-radius:4px!important;border-style:solid!important;border-width:1px!important;font-family:'Open Sans',Arial,Helvetica,sans-serif;font-size:14px!important;height:auto;line-height:21px!important;margin-bottom:0;margin-top:0;margin-left:0;margin-right:0;padding:10px 10px!important;width:100%!important;box-sizing:border-box!important;max-width:100%!important}#mlb2-1709472.ml-form-embedContainer .ml-form-embedWrapper .ml-form-embedBody .ml-form-fieldRow input::-webkit-input-placeholder,#mlb2-1709472.ml-form-embedContainer .ml-form-embedWrapper .ml-form-embedBody .ml-form-horizontalRow input::-webkit-input-placeholder{color:#333}#mlb2-1709472.ml-form-embedContainer .ml-form-embedWrapper .ml-form-embedBody .ml-form-fieldRow input::-moz-placeholder,#mlb2-1709472.ml-form-embedContainer .ml-form-embedWrapper .ml-form-embedBody .ml-form-horizontalRow input::-moz-placeholder{color:#333}#mlb2-1709472.ml-form-embedContainer .ml-form-embedWrapper .ml-form-embedBody .ml-form-fieldRow input:-ms-input-placeholder,#mlb2-1709472.ml-form-embedContainer .ml-form-embedWrapper .ml-form-embedBody .ml-form-horizontalRow input:-ms-input-placeholder{color:#333}#mlb2-1709472.ml-form-embedContainer .ml-form-embedWrapper .ml-form-embedBody .ml-form-fieldRow input:-moz-placeholder,#mlb2-1709472.ml-form-embedContainer .ml-form-embedWrapper .ml-form-embedBody .ml-form-horizontalRow input:-moz-placeholder{color:#333}#mlb2-1709472.ml-form-embedContainer .ml-form-embedWrapper .ml-form-embedBody .ml-form-fieldRow textarea,#mlb2-1709472.ml-form-embedContainer .ml-form-embedWrapper .ml-form-embedBody .ml-form-horizontalRow textarea{background-color:#fff!important;color:#333!important;border-color:#ccc!important;border-radius:4px!important;border-style:solid!important;border-width:1px!important;font-family:'Open Sans',Arial,Helvetica,sans-serif;font-size:14px!important;height:auto;line-height:21px!important;margin-bottom:0;margin-top:0;padding:10px 10px!important;width:100%!important;box-sizing:border-box!important;max-width:100%!important}#mlb2-1709472.ml-form-embedContainer .ml-form-embedWrapper .ml-form-embedBody .ml-form-checkboxRow .label-description::before,#mlb2-1709472.ml-form-embedContainer .ml-form-embedWrapper .ml-form-embedBody .ml-form-embedPermissions .ml-form-embedPermissionsOptionsCheckbox .label-description::before,#mlb2-1709472.ml-form-embedContainer .ml-form-embedWrapper .ml-form-embedBody .ml-form-fieldRow .custom-checkbox .custom-control-label::before,#mlb2-1709472.ml-form-embedContainer .ml-form-embedWrapper .ml-form-embedBody .ml-form-fieldRow .custom-radio .custom-control-label::before,#mlb2-1709472.ml-form-embedContainer .ml-form-embedWrapper .ml-form-embedBody .ml-form-horizontalRow .custom-checkbox .custom-control-label::before,#mlb2-1709472.ml-form-embedContainer .ml-form-embedWrapper .ml-form-embedBody .ml-form-horizontalRow .custom-radio .custom-control-label::before,#mlb2-1709472.ml-form-embedContainer .ml-form-embedWrapper .ml-form-embedBody .ml-form-interestGroupsRow .ml-form-interestGroupsRowCheckbox .label-description::before{border-color:#ccc!important;background-color:#fff!important}#mlb2-1709472.ml-form-embedContainer .ml-form-embedWrapper .ml-form-embedBody .ml-form-fieldRow input.custom-control-input[type=checkbox]{box-sizing:border-box;padding:0;position:absolute;z-index:-1;opacity:0;margin-top:5px;margin-left:-1.5rem;overflow:visible}#mlb2-1709472.ml-form-embedContainer .ml-form-embedWrapper .ml-form-embedBody .ml-form-checkboxRow .label-description::before,#mlb2-1709472.ml-form-embedContainer .ml-form-embedWrapper .ml-form-embedBody .ml-form-embedPermissions .ml-form-embedPermissionsOptionsCheckbox .label-description::before,#mlb2-1709472.ml-form-embedContainer .ml-form-embedWrapper .ml-form-embedBody .ml-form-fieldRow .custom-checkbox .custom-control-label::before,#mlb2-1709472.ml-form-embedContainer .ml-form-embedWrapper .ml-form-embedBody .ml-form-horizontalRow .custom-checkbox .custom-control-label::before,#mlb2-1709472.ml-form-embedContainer .ml-form-embedWrapper .ml-form-embedBody .ml-form-interestGroupsRow .ml-form-interestGroupsRowCheckbox .label-description::before{border-radius:4px!important}#mlb2-1709472.ml-form-embedContainer .ml-form-embedWrapper .ml-form-embedBody .ml-form-checkboxRow input[type=checkbox]:checked~.label-description::after,#mlb2-1709472.ml-form-embedContainer .ml-form-embedWrapper .ml-form-embedBody .ml-form-embedPermissions .ml-form-embedPermissionsOptionsCheckbox input[type=checkbox]:checked~.label-description::after,#mlb2-1709472.ml-form-embedContainer .ml-form-embedWrapper .ml-form-embedBody .ml-form-fieldRow .custom-checkbox .custom-control-input:checked~.custom-control-label::after,#mlb2-1709472.ml-form-embedContainer .ml-form-embedWrapper .ml-form-embedBody .ml-form-horizontalRow .custom-checkbox .custom-control-input:checked~.custom-control-label::after,#mlb2-1709472.ml-form-embedContainer .ml-form-embedWrapper .ml-form-embedBody .ml-form-interestGroupsRow .ml-form-interestGroupsRowCheckbox input[type=checkbox]:checked~.label-description::after{background-image:url("data:image/svg+xml,%3csvg xmlns='http://www.w3.org/2000/svg' viewBox='0 0 8 8'%3e%3cpath fill='%23fff' d='M6.564.75l-3.59 3.612-1.538-1.55L0 4.26 2.974 7.25 8 2.193z'/%3e%3c/svg%3e")}#mlb2-1709472.ml-form-embedContainer .ml-form-embedWrapper .ml-form-embedBody .ml-form-fieldRow .custom-radio .custom-control-input:checked~.custom-control-label::after{background-image:url("data:image/svg+xml,%3csvg xmlns='http://www.w3.org/2000/svg' viewBox='-4 -4 8 8'%3e%3ccircle r='3' fill='%23fff'/%3e%3c/svg%3e")}#mlb2-1709472.ml-form-embedContainer .ml-form-embedWrapper .ml-form-embedBody .ml-form-checkboxRow input[type=checkbox]:checked~.label-description::before,#mlb2-1709472.ml-form-embedContainer .ml-form-embedWrapper .ml-form-embedBody .ml-form-embedPermissions .ml-form-embedPermissionsOptionsCheckbox input[type=checkbox]:checked~.label-description::before,#mlb2-1709472.ml-form-embedContainer .ml-form-embedWrapper .ml-form-embedBody .ml-form-fieldRow .custom-checkbox .custom-control-input:checked~.custom-control-label::before,#mlb2-1709472.ml-form-embedContainer .ml-form-embedWrapper .ml-form-embedBody .ml-form-fieldRow .custom-radio .custom-control-input:checked~.custom-control-label::before,#mlb2-1709472.ml-form-embedContainer .ml-form-embedWrapper .ml-form-embedBody .ml-form-horizontalRow .custom-checkbox .custom-control-input:checked~.custom-control-label::before,#mlb2-1709472.ml-form-embedContainer .ml-form-embedWrapper .ml-form-embedBody .ml-form-horizontalRow .custom-radio .custom-control-input:checked~.custom-control-label::before,#mlb2-1709472.ml-form-embedContainer .ml-form-embedWrapper .ml-form-embedBody .ml-form-interestGroupsRow .ml-form-interestGroupsRowCheckbox input[type=checkbox]:checked~.label-description::before{border-color:#000!important;background-color:#000!important;color:#fff!important}#mlb2-1709472.ml-form-embedContainer .ml-form-embedWrapper .ml-form-embedBody .ml-form-fieldRow .custom-checkbox .custom-control-label::after,#mlb2-1709472.ml-form-embedContainer .ml-form-embedWrapper .ml-form-embedBody .ml-form-fieldRow .custom-checkbox .custom-control-label::before,#mlb2-1709472.ml-form-embedContainer .ml-form-embedWrapper .ml-form-embedBody .ml-form-fieldRow .custom-radio .custom-control-label::after,#mlb2-1709472.ml-form-embedContainer .ml-form-embedWrapper .ml-form-embedBody .ml-form-fieldRow .custom-radio .custom-control-label::before,#mlb2-1709472.ml-form-embedContainer .ml-form-embedWrapper .ml-form-embedBody .ml-form-horizontalRow .custom-checkbox .custom-control-label::after,#mlb2-1709472.ml-form-embedContainer .ml-form-embedWrapper .ml-form-embedBody .ml-form-horizontalRow .custom-checkbox .custom-control-label::before,#mlb2-1709472.ml-form-embedContainer .ml-form-embedWrapper .ml-form-embedBody .ml-form-horizontalRow .custom-radio .custom-control-label::after,#mlb2-1709472.ml-form-embedContainer .ml-form-embedWrapper .ml-form-embedBody .ml-form-horizontalRow .custom-radio .custom-control-label::before{top:2px;box-sizing:border-box}#mlb2-1709472.ml-form-embedContainer .ml-form-embedWrapper .ml-form-embedBody .ml-form-checkboxRow .label-description::after,#mlb2-1709472.ml-form-embedContainer .ml-form-embedWrapper .ml-form-embedBody .ml-form-checkboxRow .label-description::before,#mlb2-1709472.ml-form-embedContainer .ml-form-embedWrapper .ml-form-embedBody .ml-form-embedPermissions .ml-form-embedPermissionsOptionsCheckbox .label-description::after,#mlb2-1709472.ml-form-embedContainer .ml-form-embedWrapper .ml-form-embedBody .ml-form-embedPermissions .ml-form-embedPermissionsOptionsCheckbox .label-description::before{top:0!important;box-sizing:border-box!important}#mlb2-1709472.ml-form-embedContainer .ml-form-embedWrapper .ml-form-embedBody .ml-form-checkboxRow .label-description::after,#mlb2-1709472.ml-form-embedContainer .ml-form-embedWrapper .ml-form-embedBody .ml-form-checkboxRow .label-description::before{top:0!important;box-sizing:border-box!important}#mlb2-1709472.ml-form-embedContainer .ml-form-embedWrapper .ml-form-embedBody .ml-form-interestGroupsRow .ml-form-interestGroupsRowCheckbox .label-description::after{top:0!important;box-sizing:border-box!important;position:absolute;left:-1.5rem;display:block;width:1rem;height:1rem;content:""}#mlb2-1709472.ml-form-embedContainer .ml-form-embedWrapper .ml-form-embedBody .ml-form-interestGroupsRow .ml-form-interestGroupsRowCheckbox .label-description::before{top:0!important;box-sizing:border-box!important}#mlb2-1709472.ml-form-embedContainer .ml-form-embedWrapper .ml-form-embedBody .custom-control-label::before{position:absolute;top:4px;left:-1.5rem;display:block;width:16px;height:16px;pointer-events:none;content:"";background-color:#fff;border:#adb5bd solid 1px;border-radius:50%}#mlb2-1709472.ml-form-embedContainer .ml-form-embedWrapper .ml-form-embedBody .custom-control-label::after{position:absolute;top:2px!important;left:-1.5rem;display:block;width:1rem;height:1rem;content:""}#mlb2-1709472.ml-form-embedContainer .ml-form-embedWrapper .ml-form-embedBody .ml-form-checkboxRow .label-description::before,#mlb2-1709472.ml-form-embedContainer .ml-form-embedWrapper .ml-form-embedBody .ml-form-embedPermissions .ml-form-embedPermissionsOptionsCheckbox .label-description::before,#mlb2-1709472.ml-form-embedContainer .ml-form-embedWrapper .ml-form-embedBody .ml-form-interestGroupsRow .ml-form-interestGroupsRowCheckbox .label-description::before{position:absolute;top:4px;left:-1.5rem;display:block;width:16px;height:16px;pointer-events:none;content:"";background-color:#fff;border:#adb5bd solid 1px;border-radius:50%}#mlb2-1709472.ml-form-embedContainer .ml-form-embedWrapper .ml-form-embedBody .ml-form-embedPermissions .ml-form-embedPermissionsOptionsCheckbox .label-description::after{position:absolute;top:0!important;left:-1.5rem;display:block;width:1rem;height:1rem;content:""}#mlb2-1709472.ml-form-embedContainer .ml-form-embedWrapper .ml-form-embedBody .ml-form-checkboxRow .label-description::after{position:absolute;top:0!important;left:-1.5rem;display:block;width:1rem;height:1rem;content:""}#mlb2-1709472.ml-form-embedContainer .ml-form-embedWrapper .ml-form-embedBody .custom-radio .custom-control-label::after{background:no-repeat 50%/50% 50%}#mlb2-1709472.ml-form-embedContainer .ml-form-embedWrapper .ml-form-embedBody .custom-checkbox .custom-control-label::after,#mlb2-1709472.ml-form-embedContainer .ml-form-embedWrapper .ml-form-embedBody .ml-form-checkboxRow .label-description::after,#mlb2-1709472.ml-form-embedContainer .ml-form-embedWrapper .ml-form-embedBody .ml-form-embedPermissions .ml-form-embedPermissionsOptionsCheckbox .label-description::after,#mlb2-1709472.ml-form-embedContainer .ml-form-embedWrapper .ml-form-embedBody .ml-form-interestGroupsRow .ml-form-interestGroupsRowCheckbox .label-description::after{background:no-repeat 50%/50% 50%}#mlb2-1709472.ml-form-embedContainer .ml-form-embedWrapper .ml-form-embedBody .ml-form-fieldRow .custom-control,#mlb2-1709472.ml-form-embedContainer .ml-form-embedWrapper .ml-form-embedBody .ml-form-horizontalRow .custom-control{position:relative;display:block;min-height:1.5rem;padding-left:1.5rem}#mlb2-1709472.ml-form-embedContainer .ml-form-embedWrapper .ml-form-embedBody .ml-form-fieldRow .custom-checkbox .custom-control-input,#mlb2-1709472.ml-form-embedContainer .ml-form-embedWrapper .ml-form-embedBody .ml-form-fieldRow .custom-radio .custom-control-input,#mlb2-1709472.ml-form-embedContainer .ml-form-embedWrapper .ml-form-embedBody .ml-form-horizontalRow .custom-checkbox .custom-control-input,#mlb2-1709472.ml-form-embedContainer .ml-form-embedWrapper .ml-form-embedBody .ml-form-horizontalRow .custom-radio .custom-control-input{position:absolute;z-index:-1;opacity:0;box-sizing:border-box;padding:0}#mlb2-1709472.ml-form-embedContainer .ml-form-embedWrapper .ml-form-embedBody .ml-form-fieldRow .custom-checkbox .custom-control-label,#mlb2-1709472.ml-form-embedContainer .ml-form-embedWrapper .ml-form-embedBody .ml-form-fieldRow .custom-radio .custom-control-label,#mlb2-1709472.ml-form-embedContainer .ml-form-embedWrapper .ml-form-embedBody .ml-form-horizontalRow .custom-checkbox .custom-control-label,#mlb2-1709472.ml-form-embedContainer .ml-form-embedWrapper .ml-form-embedBody .ml-form-horizontalRow .custom-radio .custom-control-label{color:#000;font-size:12px!important;font-family:'Open Sans',Arial,Helvetica,sans-serif;line-height:22px;margin-bottom:0;position:relative;vertical-align:top;font-style:normal;font-weight:700}#mlb2-1709472.ml-form-embedContainer .ml-form-embedWrapper .ml-form-embedBody .ml-form-fieldRow .custom-select,#mlb2-1709472.ml-form-embedContainer .ml-form-embedWrapper .ml-form-embedBody .ml-form-horizontalRow .custom-select{background-color:#fff!important;color:#333!important;border-color:#ccc!important;border-radius:4px!important;border-style:solid!important;border-width:1px!important;font-family:'Open Sans',Arial,Helvetica,sans-serif;font-size:14px!important;line-height:20px!important;margin-bottom:0;margin-top:0;padding:10px 28px 10px 12px!important;width:100%!important;box-sizing:border-box!important;max-width:100%!important;height:auto;display:inline-block;vertical-align:middle;background:url(https://cdn.mailerlite.com/images/def...) no-repeat right .75rem center/8px 10px;-webkit-appearance:none;-moz-appearance:none;appearance:none}#mlb2-1709472.ml-form-embedContainer .ml-form-embedWrapper .ml-form-embedBody .ml-form-horizontalRow{height:auto;width:100%;float:left}.ml-form-formContent.horozintalForm .ml-form-horizontalRow .ml-input-horizontal{width:70%;float:left}.ml-form-formContent.horozintalForm .ml-form-horizontalRow .ml-button-horizontal{width:30%;float:left}.ml-form-formContent.horozintalForm .ml-form-horizontalRow .ml-button-horizontal.labelsOn{padding-top:25px}.ml-form-formContent.horozintalForm .ml-form-horizontalRow .horizontal-fields{box-sizing:border-box;float:left;padding-right:10px}#mlb2-1709472.ml-form-embedContainer .ml-form-embedWrapper .ml-form-embedBody .ml-form-horizontalRow input{background-color:#fff;color:#333;border-color:#ccc;border-radius:4px;border-style:solid;border-width:1px;font-family:'Open Sans',Arial,Helvetica,sans-serif;font-size:14px;line-height:20px;margin-bottom:0;margin-top:0;padding:10px 10px;width:100%;box-sizing:border-box;overflow-y:initial}#mlb2-1709472.ml-form-embedContainer .ml-form-embedWrapper .ml-form-embedBody .ml-form-horizontalRow button{background-color:#000!important;border-color:#000;border-style:solid;border-width:1px;border-radius:4px;box-shadow:none;color:#fff!important;cursor:pointer;font-family:'Open Sans',Arial,Helvetica,sans-serif;font-size:14px!important;font-weight:700;line-height:20px;margin:0!important;padding:10px!important;width:100%;height:auto}#mlb2-1709472.ml-form-embedContainer .ml-form-embedWrapper .ml-form-embedBody .ml-form-horizontalRow button:hover{background-color:#333!important;border-color:#333!important}#mlb2-1709472.ml-form-embedContainer .ml-form-embedWrapper .ml-form-embedBody .ml-form-checkboxRow input[type=checkbox]{box-sizing:border-box;padding:0;position:absolute;z-index:-1;opacity:0;margin-top:5px;margin-left:-1.5rem;overflow:visible}#mlb2-1709472.ml-form-embedContainer .ml-form-embedWrapper .ml-form-embedBody .ml-form-checkboxRow .label-description{color:#000;display:block;font-family:'Open Sans',Arial,Helvetica,sans-serif;font-size:12px;text-align:left;margin-bottom:0;position:relative;vertical-align:top}#mlb2-1709472.ml-form-embedContainer .ml-form-embedWrapper .ml-form-embedBody .ml-form-checkboxRow label{font-weight:400;margin:0;padding:0;position:relative;display:block;min-height:24px;padding-left:24px}#mlb2-1709472.ml-form-embedContainer .ml-form-embedWrapper .ml-form-embedBody .ml-form-checkboxRow label a{color:#000;text-decoration:underline}#mlb2-1709472.ml-form-embedContainer .ml-form-embedWrapper .ml-form-embedBody .ml-form-checkboxRow label p{color:#000!important;font-family:'Open Sans',Arial,Helvetica,sans-serif!important;font-size:12px!important;font-weight:400!important;line-height:18px!important;padding:0!important;margin:0 5px 0 0!important}#mlb2-1709472.ml-form-embedContainer .ml-form-embedWrapper .ml-form-embedBody .ml-form-checkboxRow label p:last-child{margin:0}#mlb2-1709472.ml-form-embedContainer .ml-form-embedWrapper .ml-form-embedBody .ml-form-embedSubmit{margin:0 0 20px 0;float:left;width:100%}#mlb2-1709472.ml-form-embedContainer .ml-form-embedWrapper .ml-form-embedBody .ml-form-embedSubmit button{background-color:#000!important;border:none!important;border-radius:4px!important;box-shadow:none!important;color:#fff!important;cursor:pointer;font-family:'Open Sans',Arial,Helvetica,sans-serif!important;font-size:14px!important;font-weight:700!important;line-height:21px!important;height:auto;padding:10px!important;width:100%!important;box-sizing:border-box!important}#mlb2-1709472.ml-form-embedContainer .ml-form-embedWrapper .ml-form-embedBody .ml-form-embedSubmit button.loading{display:none}#mlb2-1709472.ml-form-embedContainer .ml-form-embedWrapper .ml-form-embedBody .ml-form-embedSubmit button:hover{background-color:#333!important}.ml-subscribe-close{width:30px;height:30px;background:url(https://cdn.mailerlite.com/images/def...) no-repeat;background-size:30px;cursor:pointer;margin-top:-10px;margin-right:-10px;position:absolute;top:0;right:0}.ml-error input{border-color:red!important}.ml-error .label-description,.ml-error .label-description p,.ml-error .label-description p a,.ml-error label:first-child{color:red!important}#mlb2-1709472.ml-form-embedContainer .ml-form-embedWrapper .ml-form-embedBody .ml-form-checkboxRow.ml-error .label-description p,#mlb2-1709472.ml-form-embedContainer .ml-form-embedWrapper .ml-form-embedBody .ml-form-checkboxRow.ml-error .label-description p:first-letter{color:red!important}@media only screen and (max-width:400px){.ml-form-embedWrapper.embedDefault,.ml-form-embedWrapper.embedPopup{width:100%!important}.ml-form-formContent.horozintalForm{float:left!important}.ml-form-formContent.horozintalForm .ml-form-horizontalRow{height:auto!important;width:100%!important;float:left!important}.ml-form-formContent.horozintalForm .ml-form-horizontalRow .ml-input-horizontal{width:100%!important}.ml-form-formContent.horozintalForm .ml-form-horizontalRow .ml-input-horizontal>div{padding-right:0!important;padding-bottom:10px}.ml-form-formContent.horozintalForm .ml-button-horizontal{width:100%!important}.ml-form-formContent.horozintalForm .ml-button-horizontal.labelsOn{padding-top:0!important}} Tired of struggling with the TECHNICAL ASPECTS of being an author? Receive a monthly newsletter filled with tech hints and helpful pearls of wisdom. No spam – only valuable information.Subscribe Loading… Thank you!
You have successfully joined our subscriber list.
function ml_webform_success_1709472(){var r=ml_jQuery||jQuery;r(".ml-subscribe-form-1709472 .row-success").show(),r(".ml-subscribe-form-1709472 .row-form").hide()}The post How To Sell Your Book On Amazon [70 Book Marketing Tips] appeared first on Bakerview Consulting.
July 7, 2021
New Study Looks at Instagram Engagement Rates
Welcome back!
Are you curious how to leverage your presence on Instagram? Today’s infographic contains several interesting pieces of information that you can put to work! Be sure to visit Social Media Today and read the full post for other details.

I hope you enjoyed this infographic. Please use the share buttons below to share with friends that might benefit from this information. If you haven’t already, please subscribe to my mailing list and receive some technical hints focused at your needs!
@import url(https://static.mailerlite.com/assets/... .ml-form-embedSubmitLoad{display:inline-block;width:20px;height:20px}.sr-only{position:absolute;width:1px;height:1px;padding:0;margin:-1px;overflow:hidden;clip:rect(0,0,0,0);border:0}.ml-form-embedSubmitLoad:after{content:" ";display:block;width:11px;height:11px;margin:1px;border-radius:50%;border:4px solid #fff;border-color:#fff #fff #fff transparent;animation:ml-form-embedSubmitLoad 1.2s linear infinite}@keyframes ml-form-embedSubmitLoad{0%{transform:rotate(0)}100%{transform:rotate(360deg)}}#mlb2-1709472.ml-form-embedContainer{box-sizing:border-box;display:table;margin:0 auto;position:static;width:100%!important}#mlb2-1709472.ml-form-embedContainer button,#mlb2-1709472.ml-form-embedContainer h4,#mlb2-1709472.ml-form-embedContainer p,#mlb2-1709472.ml-form-embedContainer span{text-transform:none!important;letter-spacing:normal!important}#mlb2-1709472.ml-form-embedContainer .ml-form-embedWrapper{background-color:#f6f6f6;border-width:0;border-color:transparent;border-radius:4px;border-style:solid;box-sizing:border-box;display:inline-block!important;margin:0;padding:0;position:relative}#mlb2-1709472.ml-form-embedContainer .ml-form-embedWrapper.embedDefault,#mlb2-1709472.ml-form-embedContainer .ml-form-embedWrapper.embedPopup{width:400px}#mlb2-1709472.ml-form-embedContainer .ml-form-embedWrapper.embedForm{max-width:400px;width:100%}#mlb2-1709472.ml-form-embedContainer .ml-form-align-left{text-align:left}#mlb2-1709472.ml-form-embedContainer .ml-form-align-center{text-align:center}#mlb2-1709472.ml-form-embedContainer .ml-form-align-default{display:table-cell!important;vertical-align:middle!important;text-align:center!important}#mlb2-1709472.ml-form-embedContainer .ml-form-align-right{text-align:right}#mlb2-1709472.ml-form-embedContainer .ml-form-embedWrapper .ml-form-embedHeader img{border-top-left-radius:4px;border-top-right-radius:4px;height:auto;margin:0 auto!important;max-width:100%;width:undefinedpx}#mlb2-1709472.ml-form-embedContainer .ml-form-embedWrapper .ml-form-embedBody,#mlb2-1709472.ml-form-embedContainer .ml-form-embedWrapper .ml-form-successBody{padding:20px 20px 0 20px}#mlb2-1709472.ml-form-embedContainer .ml-form-embedWrapper .ml-form-embedBody.ml-form-embedBodyHorizontal{padding-bottom:0}#mlb2-1709472.ml-form-embedContainer .ml-form-embedWrapper .ml-form-embedBody .ml-form-embedContent,#mlb2-1709472.ml-form-embedContainer .ml-form-embedWrapper .ml-form-successBody .ml-form-successContent{text-align:left;margin:0 0 20px 0}#mlb2-1709472.ml-form-embedContainer .ml-form-embedWrapper .ml-form-embedBody .ml-form-embedContent h4,#mlb2-1709472.ml-form-embedContainer .ml-form-embedWrapper .ml-form-successBody .ml-form-successContent h4{color:#000;font-family:'Open Sans',Arial,Helvetica,sans-serif;font-size:30px;font-weight:400;margin:0 0 10px 0;text-align:left;word-break:break-word}#mlb2-1709472.ml-form-embedContainer .ml-form-embedWrapper .ml-form-embedBody .ml-form-embedContent p,#mlb2-1709472.ml-form-embedContainer .ml-form-embedWrapper .ml-form-successBody .ml-form-successContent p{color:#000;font-family:'Open Sans',Arial,Helvetica,sans-serif;font-size:14px;font-weight:400;line-height:20px;margin:0 0 10px 0;text-align:left}#mlb2-1709472.ml-form-embedContainer .ml-form-embedWrapper .ml-form-embedBody .ml-form-embedContent ol,#mlb2-1709472.ml-form-embedContainer .ml-form-embedWrapper .ml-form-embedBody .ml-form-embedContent ul,#mlb2-1709472.ml-form-embedContainer .ml-form-embedWrapper .ml-form-successBody .ml-form-successContent ol,#mlb2-1709472.ml-form-embedContainer .ml-form-embedWrapper .ml-form-successBody .ml-form-successContent ul{color:#000;font-family:'Open Sans',Arial,Helvetica,sans-serif;font-size:14px}#mlb2-1709472.ml-form-embedContainer .ml-form-embedWrapper .ml-form-embedBody .ml-form-embedContent ol ol,#mlb2-1709472.ml-form-embedContainer .ml-form-embedWrapper .ml-form-successBody .ml-form-successContent ol ol{list-style-type:lower-alpha}#mlb2-1709472.ml-form-embedContainer .ml-form-embedWrapper .ml-form-embedBody .ml-form-embedContent ol ol ol,#mlb2-1709472.ml-form-embedContainer .ml-form-embedWrapper .ml-form-successBody .ml-form-successContent ol ol ol{list-style-type:lower-roman}#mlb2-1709472.ml-form-embedContainer .ml-form-embedWrapper .ml-form-embedBody .ml-form-embedContent p a,#mlb2-1709472.ml-form-embedContainer .ml-form-embedWrapper .ml-form-successBody .ml-form-successContent p a{color:#000;text-decoration:underline}#mlb2-1709472.ml-form-embedContainer .ml-form-embedWrapper .ml-block-form .ml-field-group{text-align:left!important}#mlb2-1709472.ml-form-embedContainer .ml-form-embedWrapper .ml-block-form .ml-field-group label{margin-bottom:5px;color:#333;font-size:14px;font-family:'Open Sans',Arial,Helvetica,sans-serif;font-weight:700;font-style:normal;text-decoration:none;display:inline-block;line-height:20px}#mlb2-1709472.ml-form-embedContainer .ml-form-embedWrapper .ml-form-embedBody .ml-form-embedContent p:last-child,#mlb2-1709472.ml-form-embedContainer .ml-form-embedWrapper .ml-form-successBody .ml-form-successContent p:last-child{margin:0}#mlb2-1709472.ml-form-embedContainer .ml-form-embedWrapper .ml-form-embedBody form{margin:0;width:100%}#mlb2-1709472.ml-form-embedContainer .ml-form-embedWrapper .ml-form-embedBody .ml-form-checkboxRow,#mlb2-1709472.ml-form-embedContainer .ml-form-embedWrapper .ml-form-embedBody .ml-form-formContent{margin:0 0 20px 0;width:100%}#mlb2-1709472.ml-form-embedContainer .ml-form-embedWrapper .ml-form-embedBody .ml-form-checkboxRow{float:left}#mlb2-1709472.ml-form-embedContainer .ml-form-embedWrapper .ml-form-embedBody .ml-form-formContent.horozintalForm{margin:0;padding:0 0 20px 0;width:100%;height:auto;float:left}#mlb2-1709472.ml-form-embedContainer .ml-form-embedWrapper .ml-form-embedBody .ml-form-fieldRow{margin:0 0 10px 0;width:100%}#mlb2-1709472.ml-form-embedContainer .ml-form-embedWrapper .ml-form-embedBody .ml-form-fieldRow.ml-last-item{margin:0}#mlb2-1709472.ml-form-embedContainer .ml-form-embedWrapper .ml-form-embedBody .ml-form-fieldRow.ml-formfieldHorizintal{margin:0}#mlb2-1709472.ml-form-embedContainer .ml-form-embedWrapper .ml-form-embedBody .ml-form-fieldRow input{background-color:#fff!important;color:#333!important;border-color:#ccc;border-radius:4px!important;border-style:solid!important;border-width:1px!important;font-family:'Open Sans',Arial,Helvetica,sans-serif;font-size:14px!important;height:auto;line-height:21px!important;margin-bottom:0;margin-top:0;margin-left:0;margin-right:0;padding:10px 10px!important;width:100%!important;box-sizing:border-box!important;max-width:100%!important}#mlb2-1709472.ml-form-embedContainer .ml-form-embedWrapper .ml-form-embedBody .ml-form-fieldRow input::-webkit-input-placeholder,#mlb2-1709472.ml-form-embedContainer .ml-form-embedWrapper .ml-form-embedBody .ml-form-horizontalRow input::-webkit-input-placeholder{color:#333}#mlb2-1709472.ml-form-embedContainer .ml-form-embedWrapper .ml-form-embedBody .ml-form-fieldRow input::-moz-placeholder,#mlb2-1709472.ml-form-embedContainer .ml-form-embedWrapper .ml-form-embedBody .ml-form-horizontalRow input::-moz-placeholder{color:#333}#mlb2-1709472.ml-form-embedContainer .ml-form-embedWrapper .ml-form-embedBody .ml-form-fieldRow input:-ms-input-placeholder,#mlb2-1709472.ml-form-embedContainer .ml-form-embedWrapper .ml-form-embedBody .ml-form-horizontalRow input:-ms-input-placeholder{color:#333}#mlb2-1709472.ml-form-embedContainer .ml-form-embedWrapper .ml-form-embedBody .ml-form-fieldRow input:-moz-placeholder,#mlb2-1709472.ml-form-embedContainer .ml-form-embedWrapper .ml-form-embedBody .ml-form-horizontalRow input:-moz-placeholder{color:#333}#mlb2-1709472.ml-form-embedContainer .ml-form-embedWrapper .ml-form-embedBody .ml-form-fieldRow textarea,#mlb2-1709472.ml-form-embedContainer .ml-form-embedWrapper .ml-form-embedBody .ml-form-horizontalRow textarea{background-color:#fff!important;color:#333!important;border-color:#ccc!important;border-radius:4px!important;border-style:solid!important;border-width:1px!important;font-family:'Open Sans',Arial,Helvetica,sans-serif;font-size:14px!important;height:auto;line-height:21px!important;margin-bottom:0;margin-top:0;padding:10px 10px!important;width:100%!important;box-sizing:border-box!important;max-width:100%!important}#mlb2-1709472.ml-form-embedContainer .ml-form-embedWrapper .ml-form-embedBody .ml-form-checkboxRow .label-description::before,#mlb2-1709472.ml-form-embedContainer .ml-form-embedWrapper .ml-form-embedBody .ml-form-embedPermissions .ml-form-embedPermissionsOptionsCheckbox .label-description::before,#mlb2-1709472.ml-form-embedContainer .ml-form-embedWrapper .ml-form-embedBody .ml-form-fieldRow .custom-checkbox .custom-control-label::before,#mlb2-1709472.ml-form-embedContainer .ml-form-embedWrapper .ml-form-embedBody .ml-form-fieldRow .custom-radio .custom-control-label::before,#mlb2-1709472.ml-form-embedContainer .ml-form-embedWrapper .ml-form-embedBody .ml-form-horizontalRow .custom-checkbox .custom-control-label::before,#mlb2-1709472.ml-form-embedContainer .ml-form-embedWrapper .ml-form-embedBody .ml-form-horizontalRow .custom-radio .custom-control-label::before,#mlb2-1709472.ml-form-embedContainer .ml-form-embedWrapper .ml-form-embedBody .ml-form-interestGroupsRow .ml-form-interestGroupsRowCheckbox .label-description::before{border-color:#ccc!important;background-color:#fff!important}#mlb2-1709472.ml-form-embedContainer .ml-form-embedWrapper .ml-form-embedBody .ml-form-fieldRow input.custom-control-input[type=checkbox]{box-sizing:border-box;padding:0;position:absolute;z-index:-1;opacity:0;margin-top:5px;margin-left:-1.5rem;overflow:visible}#mlb2-1709472.ml-form-embedContainer .ml-form-embedWrapper .ml-form-embedBody .ml-form-checkboxRow .label-description::before,#mlb2-1709472.ml-form-embedContainer .ml-form-embedWrapper .ml-form-embedBody .ml-form-embedPermissions .ml-form-embedPermissionsOptionsCheckbox .label-description::before,#mlb2-1709472.ml-form-embedContainer .ml-form-embedWrapper .ml-form-embedBody .ml-form-fieldRow .custom-checkbox .custom-control-label::before,#mlb2-1709472.ml-form-embedContainer .ml-form-embedWrapper .ml-form-embedBody .ml-form-horizontalRow .custom-checkbox .custom-control-label::before,#mlb2-1709472.ml-form-embedContainer .ml-form-embedWrapper .ml-form-embedBody .ml-form-interestGroupsRow .ml-form-interestGroupsRowCheckbox .label-description::before{border-radius:4px!important}#mlb2-1709472.ml-form-embedContainer .ml-form-embedWrapper .ml-form-embedBody .ml-form-checkboxRow input[type=checkbox]:checked~.label-description::after,#mlb2-1709472.ml-form-embedContainer .ml-form-embedWrapper .ml-form-embedBody .ml-form-embedPermissions .ml-form-embedPermissionsOptionsCheckbox input[type=checkbox]:checked~.label-description::after,#mlb2-1709472.ml-form-embedContainer .ml-form-embedWrapper .ml-form-embedBody .ml-form-fieldRow .custom-checkbox .custom-control-input:checked~.custom-control-label::after,#mlb2-1709472.ml-form-embedContainer .ml-form-embedWrapper .ml-form-embedBody .ml-form-horizontalRow .custom-checkbox .custom-control-input:checked~.custom-control-label::after,#mlb2-1709472.ml-form-embedContainer .ml-form-embedWrapper .ml-form-embedBody .ml-form-interestGroupsRow .ml-form-interestGroupsRowCheckbox input[type=checkbox]:checked~.label-description::after{background-image:url("data:image/svg+xml,%3csvg xmlns='http://www.w3.org/2000/svg' viewBox='0 0 8 8'%3e%3cpath fill='%23fff' d='M6.564.75l-3.59 3.612-1.538-1.55L0 4.26 2.974 7.25 8 2.193z'/%3e%3c/svg%3e")}#mlb2-1709472.ml-form-embedContainer .ml-form-embedWrapper .ml-form-embedBody .ml-form-fieldRow .custom-radio .custom-control-input:checked~.custom-control-label::after{background-image:url("data:image/svg+xml,%3csvg xmlns='http://www.w3.org/2000/svg' viewBox='-4 -4 8 8'%3e%3ccircle r='3' fill='%23fff'/%3e%3c/svg%3e")}#mlb2-1709472.ml-form-embedContainer .ml-form-embedWrapper .ml-form-embedBody .ml-form-checkboxRow input[type=checkbox]:checked~.label-description::before,#mlb2-1709472.ml-form-embedContainer .ml-form-embedWrapper .ml-form-embedBody .ml-form-embedPermissions .ml-form-embedPermissionsOptionsCheckbox input[type=checkbox]:checked~.label-description::before,#mlb2-1709472.ml-form-embedContainer .ml-form-embedWrapper .ml-form-embedBody .ml-form-fieldRow .custom-checkbox .custom-control-input:checked~.custom-control-label::before,#mlb2-1709472.ml-form-embedContainer .ml-form-embedWrapper .ml-form-embedBody .ml-form-fieldRow .custom-radio .custom-control-input:checked~.custom-control-label::before,#mlb2-1709472.ml-form-embedContainer .ml-form-embedWrapper .ml-form-embedBody .ml-form-horizontalRow .custom-checkbox .custom-control-input:checked~.custom-control-label::before,#mlb2-1709472.ml-form-embedContainer .ml-form-embedWrapper .ml-form-embedBody .ml-form-horizontalRow .custom-radio .custom-control-input:checked~.custom-control-label::before,#mlb2-1709472.ml-form-embedContainer .ml-form-embedWrapper .ml-form-embedBody .ml-form-interestGroupsRow .ml-form-interestGroupsRowCheckbox input[type=checkbox]:checked~.label-description::before{border-color:#000!important;background-color:#000!important;color:#fff!important}#mlb2-1709472.ml-form-embedContainer .ml-form-embedWrapper .ml-form-embedBody .ml-form-fieldRow .custom-checkbox .custom-control-label::after,#mlb2-1709472.ml-form-embedContainer .ml-form-embedWrapper .ml-form-embedBody .ml-form-fieldRow .custom-checkbox .custom-control-label::before,#mlb2-1709472.ml-form-embedContainer .ml-form-embedWrapper .ml-form-embedBody .ml-form-fieldRow .custom-radio .custom-control-label::after,#mlb2-1709472.ml-form-embedContainer .ml-form-embedWrapper .ml-form-embedBody .ml-form-fieldRow .custom-radio .custom-control-label::before,#mlb2-1709472.ml-form-embedContainer .ml-form-embedWrapper .ml-form-embedBody .ml-form-horizontalRow .custom-checkbox .custom-control-label::after,#mlb2-1709472.ml-form-embedContainer .ml-form-embedWrapper .ml-form-embedBody .ml-form-horizontalRow .custom-checkbox .custom-control-label::before,#mlb2-1709472.ml-form-embedContainer .ml-form-embedWrapper .ml-form-embedBody .ml-form-horizontalRow .custom-radio .custom-control-label::after,#mlb2-1709472.ml-form-embedContainer .ml-form-embedWrapper .ml-form-embedBody .ml-form-horizontalRow .custom-radio .custom-control-label::before{top:2px;box-sizing:border-box}#mlb2-1709472.ml-form-embedContainer .ml-form-embedWrapper .ml-form-embedBody .ml-form-checkboxRow .label-description::after,#mlb2-1709472.ml-form-embedContainer .ml-form-embedWrapper .ml-form-embedBody .ml-form-checkboxRow .label-description::before,#mlb2-1709472.ml-form-embedContainer .ml-form-embedWrapper .ml-form-embedBody .ml-form-embedPermissions .ml-form-embedPermissionsOptionsCheckbox .label-description::after,#mlb2-1709472.ml-form-embedContainer .ml-form-embedWrapper .ml-form-embedBody .ml-form-embedPermissions .ml-form-embedPermissionsOptionsCheckbox .label-description::before{top:0!important;box-sizing:border-box!important}#mlb2-1709472.ml-form-embedContainer .ml-form-embedWrapper .ml-form-embedBody .ml-form-checkboxRow .label-description::after,#mlb2-1709472.ml-form-embedContainer .ml-form-embedWrapper .ml-form-embedBody .ml-form-checkboxRow .label-description::before{top:0!important;box-sizing:border-box!important}#mlb2-1709472.ml-form-embedContainer .ml-form-embedWrapper .ml-form-embedBody .ml-form-interestGroupsRow .ml-form-interestGroupsRowCheckbox .label-description::after{top:0!important;box-sizing:border-box!important;position:absolute;left:-1.5rem;display:block;width:1rem;height:1rem;content:""}#mlb2-1709472.ml-form-embedContainer .ml-form-embedWrapper .ml-form-embedBody .ml-form-interestGroupsRow .ml-form-interestGroupsRowCheckbox .label-description::before{top:0!important;box-sizing:border-box!important}#mlb2-1709472.ml-form-embedContainer .ml-form-embedWrapper .ml-form-embedBody .custom-control-label::before{position:absolute;top:4px;left:-1.5rem;display:block;width:16px;height:16px;pointer-events:none;content:"";background-color:#fff;border:#adb5bd solid 1px;border-radius:50%}#mlb2-1709472.ml-form-embedContainer .ml-form-embedWrapper .ml-form-embedBody .custom-control-label::after{position:absolute;top:2px!important;left:-1.5rem;display:block;width:1rem;height:1rem;content:""}#mlb2-1709472.ml-form-embedContainer .ml-form-embedWrapper .ml-form-embedBody .ml-form-checkboxRow .label-description::before,#mlb2-1709472.ml-form-embedContainer .ml-form-embedWrapper .ml-form-embedBody .ml-form-embedPermissions .ml-form-embedPermissionsOptionsCheckbox .label-description::before,#mlb2-1709472.ml-form-embedContainer .ml-form-embedWrapper .ml-form-embedBody .ml-form-interestGroupsRow .ml-form-interestGroupsRowCheckbox .label-description::before{position:absolute;top:4px;left:-1.5rem;display:block;width:16px;height:16px;pointer-events:none;content:"";background-color:#fff;border:#adb5bd solid 1px;border-radius:50%}#mlb2-1709472.ml-form-embedContainer .ml-form-embedWrapper .ml-form-embedBody .ml-form-embedPermissions .ml-form-embedPermissionsOptionsCheckbox .label-description::after{position:absolute;top:0!important;left:-1.5rem;display:block;width:1rem;height:1rem;content:""}#mlb2-1709472.ml-form-embedContainer .ml-form-embedWrapper .ml-form-embedBody .ml-form-checkboxRow .label-description::after{position:absolute;top:0!important;left:-1.5rem;display:block;width:1rem;height:1rem;content:""}#mlb2-1709472.ml-form-embedContainer .ml-form-embedWrapper .ml-form-embedBody .custom-radio .custom-control-label::after{background:no-repeat 50%/50% 50%}#mlb2-1709472.ml-form-embedContainer .ml-form-embedWrapper .ml-form-embedBody .custom-checkbox .custom-control-label::after,#mlb2-1709472.ml-form-embedContainer .ml-form-embedWrapper .ml-form-embedBody .ml-form-checkboxRow .label-description::after,#mlb2-1709472.ml-form-embedContainer .ml-form-embedWrapper .ml-form-embedBody .ml-form-embedPermissions .ml-form-embedPermissionsOptionsCheckbox .label-description::after,#mlb2-1709472.ml-form-embedContainer .ml-form-embedWrapper .ml-form-embedBody .ml-form-interestGroupsRow .ml-form-interestGroupsRowCheckbox .label-description::after{background:no-repeat 50%/50% 50%}#mlb2-1709472.ml-form-embedContainer .ml-form-embedWrapper .ml-form-embedBody .ml-form-fieldRow .custom-control,#mlb2-1709472.ml-form-embedContainer .ml-form-embedWrapper .ml-form-embedBody .ml-form-horizontalRow .custom-control{position:relative;display:block;min-height:1.5rem;padding-left:1.5rem}#mlb2-1709472.ml-form-embedContainer .ml-form-embedWrapper .ml-form-embedBody .ml-form-fieldRow .custom-checkbox .custom-control-input,#mlb2-1709472.ml-form-embedContainer .ml-form-embedWrapper .ml-form-embedBody .ml-form-fieldRow .custom-radio .custom-control-input,#mlb2-1709472.ml-form-embedContainer .ml-form-embedWrapper .ml-form-embedBody .ml-form-horizontalRow .custom-checkbox .custom-control-input,#mlb2-1709472.ml-form-embedContainer .ml-form-embedWrapper .ml-form-embedBody .ml-form-horizontalRow .custom-radio .custom-control-input{position:absolute;z-index:-1;opacity:0;box-sizing:border-box;padding:0}#mlb2-1709472.ml-form-embedContainer .ml-form-embedWrapper .ml-form-embedBody .ml-form-fieldRow .custom-checkbox .custom-control-label,#mlb2-1709472.ml-form-embedContainer .ml-form-embedWrapper .ml-form-embedBody .ml-form-fieldRow .custom-radio .custom-control-label,#mlb2-1709472.ml-form-embedContainer .ml-form-embedWrapper .ml-form-embedBody .ml-form-horizontalRow .custom-checkbox .custom-control-label,#mlb2-1709472.ml-form-embedContainer .ml-form-embedWrapper .ml-form-embedBody .ml-form-horizontalRow .custom-radio .custom-control-label{color:#000;font-size:12px!important;font-family:'Open Sans',Arial,Helvetica,sans-serif;line-height:22px;margin-bottom:0;position:relative;vertical-align:top;font-style:normal;font-weight:700}#mlb2-1709472.ml-form-embedContainer .ml-form-embedWrapper .ml-form-embedBody .ml-form-fieldRow .custom-select,#mlb2-1709472.ml-form-embedContainer .ml-form-embedWrapper .ml-form-embedBody .ml-form-horizontalRow .custom-select{background-color:#fff!important;color:#333!important;border-color:#ccc!important;border-radius:4px!important;border-style:solid!important;border-width:1px!important;font-family:'Open Sans',Arial,Helvetica,sans-serif;font-size:14px!important;line-height:20px!important;margin-bottom:0;margin-top:0;padding:10px 28px 10px 12px!important;width:100%!important;box-sizing:border-box!important;max-width:100%!important;height:auto;display:inline-block;vertical-align:middle;background:url(https://cdn.mailerlite.com/images/def...) no-repeat right .75rem center/8px 10px;-webkit-appearance:none;-moz-appearance:none;appearance:none}#mlb2-1709472.ml-form-embedContainer .ml-form-embedWrapper .ml-form-embedBody .ml-form-horizontalRow{height:auto;width:100%;float:left}.ml-form-formContent.horozintalForm .ml-form-horizontalRow .ml-input-horizontal{width:70%;float:left}.ml-form-formContent.horozintalForm .ml-form-horizontalRow .ml-button-horizontal{width:30%;float:left}.ml-form-formContent.horozintalForm .ml-form-horizontalRow .ml-button-horizontal.labelsOn{padding-top:25px}.ml-form-formContent.horozintalForm .ml-form-horizontalRow .horizontal-fields{box-sizing:border-box;float:left;padding-right:10px}#mlb2-1709472.ml-form-embedContainer .ml-form-embedWrapper .ml-form-embedBody .ml-form-horizontalRow input{background-color:#fff;color:#333;border-color:#ccc;border-radius:4px;border-style:solid;border-width:1px;font-family:'Open Sans',Arial,Helvetica,sans-serif;font-size:14px;line-height:20px;margin-bottom:0;margin-top:0;padding:10px 10px;width:100%;box-sizing:border-box;overflow-y:initial}#mlb2-1709472.ml-form-embedContainer .ml-form-embedWrapper .ml-form-embedBody .ml-form-horizontalRow button{background-color:#000!important;border-color:#000;border-style:solid;border-width:1px;border-radius:4px;box-shadow:none;color:#fff!important;cursor:pointer;font-family:'Open Sans',Arial,Helvetica,sans-serif;font-size:14px!important;font-weight:700;line-height:20px;margin:0!important;padding:10px!important;width:100%;height:auto}#mlb2-1709472.ml-form-embedContainer .ml-form-embedWrapper .ml-form-embedBody .ml-form-horizontalRow button:hover{background-color:#333!important;border-color:#333!important}#mlb2-1709472.ml-form-embedContainer .ml-form-embedWrapper .ml-form-embedBody .ml-form-checkboxRow input[type=checkbox]{box-sizing:border-box;padding:0;position:absolute;z-index:-1;opacity:0;margin-top:5px;margin-left:-1.5rem;overflow:visible}#mlb2-1709472.ml-form-embedContainer .ml-form-embedWrapper .ml-form-embedBody .ml-form-checkboxRow .label-description{color:#000;display:block;font-family:'Open Sans',Arial,Helvetica,sans-serif;font-size:12px;text-align:left;margin-bottom:0;position:relative;vertical-align:top}#mlb2-1709472.ml-form-embedContainer .ml-form-embedWrapper .ml-form-embedBody .ml-form-checkboxRow label{font-weight:400;margin:0;padding:0;position:relative;display:block;min-height:24px;padding-left:24px}#mlb2-1709472.ml-form-embedContainer .ml-form-embedWrapper .ml-form-embedBody .ml-form-checkboxRow label a{color:#000;text-decoration:underline}#mlb2-1709472.ml-form-embedContainer .ml-form-embedWrapper .ml-form-embedBody .ml-form-checkboxRow label p{color:#000!important;font-family:'Open Sans',Arial,Helvetica,sans-serif!important;font-size:12px!important;font-weight:400!important;line-height:18px!important;padding:0!important;margin:0 5px 0 0!important}#mlb2-1709472.ml-form-embedContainer .ml-form-embedWrapper .ml-form-embedBody .ml-form-checkboxRow label p:last-child{margin:0}#mlb2-1709472.ml-form-embedContainer .ml-form-embedWrapper .ml-form-embedBody .ml-form-embedSubmit{margin:0 0 20px 0;float:left;width:100%}#mlb2-1709472.ml-form-embedContainer .ml-form-embedWrapper .ml-form-embedBody .ml-form-embedSubmit button{background-color:#000!important;border:none!important;border-radius:4px!important;box-shadow:none!important;color:#fff!important;cursor:pointer;font-family:'Open Sans',Arial,Helvetica,sans-serif!important;font-size:14px!important;font-weight:700!important;line-height:21px!important;height:auto;padding:10px!important;width:100%!important;box-sizing:border-box!important}#mlb2-1709472.ml-form-embedContainer .ml-form-embedWrapper .ml-form-embedBody .ml-form-embedSubmit button.loading{display:none}#mlb2-1709472.ml-form-embedContainer .ml-form-embedWrapper .ml-form-embedBody .ml-form-embedSubmit button:hover{background-color:#333!important}.ml-subscribe-close{width:30px;height:30px;background:url(https://cdn.mailerlite.com/images/def...) no-repeat;background-size:30px;cursor:pointer;margin-top:-10px;margin-right:-10px;position:absolute;top:0;right:0}.ml-error input{border-color:red!important}.ml-error .label-description,.ml-error .label-description p,.ml-error .label-description p a,.ml-error label:first-child{color:red!important}#mlb2-1709472.ml-form-embedContainer .ml-form-embedWrapper .ml-form-embedBody .ml-form-checkboxRow.ml-error .label-description p,#mlb2-1709472.ml-form-embedContainer .ml-form-embedWrapper .ml-form-embedBody .ml-form-checkboxRow.ml-error .label-description p:first-letter{color:red!important}@media only screen and (max-width:400px){.ml-form-embedWrapper.embedDefault,.ml-form-embedWrapper.embedPopup{width:100%!important}.ml-form-formContent.horozintalForm{float:left!important}.ml-form-formContent.horozintalForm .ml-form-horizontalRow{height:auto!important;width:100%!important;float:left!important}.ml-form-formContent.horozintalForm .ml-form-horizontalRow .ml-input-horizontal{width:100%!important}.ml-form-formContent.horozintalForm .ml-form-horizontalRow .ml-input-horizontal>div{padding-right:0!important;padding-bottom:10px}.ml-form-formContent.horozintalForm .ml-button-horizontal{width:100%!important}.ml-form-formContent.horozintalForm .ml-button-horizontal.labelsOn{padding-top:0!important}} Tired of struggling with the TECHNICAL ASPECTS of being an author? Receive a monthly newsletter filled with tech hints and helpful pearls of wisdom. No spam – only valuable information.Subscribe Loading… Thank you!
You have successfully joined our subscriber list.
function ml_webform_success_1709472(){var r=ml_jQuery||jQuery;r(".ml-subscribe-form-1709472 .row-success").show(),r(".ml-subscribe-form-1709472 .row-form").hide()}The post New Study Looks at Instagram Engagement Rates appeared first on Bakerview Consulting.
June 30, 2021
The Rise of Social Commerce [Infographic]
Welcome Back!
With the growth of shopping from home during this pandemic, there is more attention on website e-commerce. When I stumbled on this infographic I knew I just had to share it. Hope this is helpful in your understanding. As always, I encourage you to visit Social Media Today and read the full post.

I hope you enjoyed this infographic. Please use the share buttons below to share with friends that might benefit from this information. If you haven’t already, please subscribe to my mailing list and receive some technical hints focused at your needs!
@import url(https://static.mailerlite.com/assets/... .ml-form-embedSubmitLoad{display:inline-block;width:20px;height:20px}.sr-only{position:absolute;width:1px;height:1px;padding:0;margin:-1px;overflow:hidden;clip:rect(0,0,0,0);border:0}.ml-form-embedSubmitLoad:after{content:" ";display:block;width:11px;height:11px;margin:1px;border-radius:50%;border:4px solid #fff;border-color:#fff #fff #fff transparent;animation:ml-form-embedSubmitLoad 1.2s linear infinite}@keyframes ml-form-embedSubmitLoad{0%{transform:rotate(0)}100%{transform:rotate(360deg)}}#mlb2-1709472.ml-form-embedContainer{box-sizing:border-box;display:table;margin:0 auto;position:static;width:100%!important}#mlb2-1709472.ml-form-embedContainer button,#mlb2-1709472.ml-form-embedContainer h4,#mlb2-1709472.ml-form-embedContainer p,#mlb2-1709472.ml-form-embedContainer span{text-transform:none!important;letter-spacing:normal!important}#mlb2-1709472.ml-form-embedContainer .ml-form-embedWrapper{background-color:#f6f6f6;border-width:0;border-color:transparent;border-radius:4px;border-style:solid;box-sizing:border-box;display:inline-block!important;margin:0;padding:0;position:relative}#mlb2-1709472.ml-form-embedContainer .ml-form-embedWrapper.embedDefault,#mlb2-1709472.ml-form-embedContainer .ml-form-embedWrapper.embedPopup{width:400px}#mlb2-1709472.ml-form-embedContainer .ml-form-embedWrapper.embedForm{max-width:400px;width:100%}#mlb2-1709472.ml-form-embedContainer .ml-form-align-left{text-align:left}#mlb2-1709472.ml-form-embedContainer .ml-form-align-center{text-align:center}#mlb2-1709472.ml-form-embedContainer .ml-form-align-default{display:table-cell!important;vertical-align:middle!important;text-align:center!important}#mlb2-1709472.ml-form-embedContainer .ml-form-align-right{text-align:right}#mlb2-1709472.ml-form-embedContainer .ml-form-embedWrapper .ml-form-embedHeader img{border-top-left-radius:4px;border-top-right-radius:4px;height:auto;margin:0 auto!important;max-width:100%;width:undefinedpx}#mlb2-1709472.ml-form-embedContainer .ml-form-embedWrapper .ml-form-embedBody,#mlb2-1709472.ml-form-embedContainer .ml-form-embedWrapper .ml-form-successBody{padding:20px 20px 0 20px}#mlb2-1709472.ml-form-embedContainer .ml-form-embedWrapper .ml-form-embedBody.ml-form-embedBodyHorizontal{padding-bottom:0}#mlb2-1709472.ml-form-embedContainer .ml-form-embedWrapper .ml-form-embedBody .ml-form-embedContent,#mlb2-1709472.ml-form-embedContainer .ml-form-embedWrapper .ml-form-successBody .ml-form-successContent{text-align:left;margin:0 0 20px 0}#mlb2-1709472.ml-form-embedContainer .ml-form-embedWrapper .ml-form-embedBody .ml-form-embedContent h4,#mlb2-1709472.ml-form-embedContainer .ml-form-embedWrapper .ml-form-successBody .ml-form-successContent h4{color:#000;font-family:'Open Sans',Arial,Helvetica,sans-serif;font-size:30px;font-weight:400;margin:0 0 10px 0;text-align:left;word-break:break-word}#mlb2-1709472.ml-form-embedContainer .ml-form-embedWrapper .ml-form-embedBody .ml-form-embedContent p,#mlb2-1709472.ml-form-embedContainer .ml-form-embedWrapper .ml-form-successBody .ml-form-successContent p{color:#000;font-family:'Open Sans',Arial,Helvetica,sans-serif;font-size:14px;font-weight:400;line-height:20px;margin:0 0 10px 0;text-align:left}#mlb2-1709472.ml-form-embedContainer .ml-form-embedWrapper .ml-form-embedBody .ml-form-embedContent ol,#mlb2-1709472.ml-form-embedContainer .ml-form-embedWrapper .ml-form-embedBody .ml-form-embedContent ul,#mlb2-1709472.ml-form-embedContainer .ml-form-embedWrapper .ml-form-successBody .ml-form-successContent ol,#mlb2-1709472.ml-form-embedContainer .ml-form-embedWrapper .ml-form-successBody .ml-form-successContent ul{color:#000;font-family:'Open Sans',Arial,Helvetica,sans-serif;font-size:14px}#mlb2-1709472.ml-form-embedContainer .ml-form-embedWrapper .ml-form-embedBody .ml-form-embedContent ol ol,#mlb2-1709472.ml-form-embedContainer .ml-form-embedWrapper .ml-form-successBody .ml-form-successContent ol ol{list-style-type:lower-alpha}#mlb2-1709472.ml-form-embedContainer .ml-form-embedWrapper .ml-form-embedBody .ml-form-embedContent ol ol ol,#mlb2-1709472.ml-form-embedContainer .ml-form-embedWrapper .ml-form-successBody .ml-form-successContent ol ol ol{list-style-type:lower-roman}#mlb2-1709472.ml-form-embedContainer .ml-form-embedWrapper .ml-form-embedBody .ml-form-embedContent p a,#mlb2-1709472.ml-form-embedContainer .ml-form-embedWrapper .ml-form-successBody .ml-form-successContent p a{color:#000;text-decoration:underline}#mlb2-1709472.ml-form-embedContainer .ml-form-embedWrapper .ml-block-form .ml-field-group{text-align:left!important}#mlb2-1709472.ml-form-embedContainer .ml-form-embedWrapper .ml-block-form .ml-field-group label{margin-bottom:5px;color:#333;font-size:14px;font-family:'Open Sans',Arial,Helvetica,sans-serif;font-weight:700;font-style:normal;text-decoration:none;display:inline-block;line-height:20px}#mlb2-1709472.ml-form-embedContainer .ml-form-embedWrapper .ml-form-embedBody .ml-form-embedContent p:last-child,#mlb2-1709472.ml-form-embedContainer .ml-form-embedWrapper .ml-form-successBody .ml-form-successContent p:last-child{margin:0}#mlb2-1709472.ml-form-embedContainer .ml-form-embedWrapper .ml-form-embedBody form{margin:0;width:100%}#mlb2-1709472.ml-form-embedContainer .ml-form-embedWrapper .ml-form-embedBody .ml-form-checkboxRow,#mlb2-1709472.ml-form-embedContainer .ml-form-embedWrapper .ml-form-embedBody .ml-form-formContent{margin:0 0 20px 0;width:100%}#mlb2-1709472.ml-form-embedContainer .ml-form-embedWrapper .ml-form-embedBody .ml-form-checkboxRow{float:left}#mlb2-1709472.ml-form-embedContainer .ml-form-embedWrapper .ml-form-embedBody .ml-form-formContent.horozintalForm{margin:0;padding:0 0 20px 0;width:100%;height:auto;float:left}#mlb2-1709472.ml-form-embedContainer .ml-form-embedWrapper .ml-form-embedBody .ml-form-fieldRow{margin:0 0 10px 0;width:100%}#mlb2-1709472.ml-form-embedContainer .ml-form-embedWrapper .ml-form-embedBody .ml-form-fieldRow.ml-last-item{margin:0}#mlb2-1709472.ml-form-embedContainer .ml-form-embedWrapper .ml-form-embedBody .ml-form-fieldRow.ml-formfieldHorizintal{margin:0}#mlb2-1709472.ml-form-embedContainer .ml-form-embedWrapper .ml-form-embedBody .ml-form-fieldRow input{background-color:#fff!important;color:#333!important;border-color:#ccc;border-radius:4px!important;border-style:solid!important;border-width:1px!important;font-family:'Open Sans',Arial,Helvetica,sans-serif;font-size:14px!important;height:auto;line-height:21px!important;margin-bottom:0;margin-top:0;margin-left:0;margin-right:0;padding:10px 10px!important;width:100%!important;box-sizing:border-box!important;max-width:100%!important}#mlb2-1709472.ml-form-embedContainer .ml-form-embedWrapper .ml-form-embedBody .ml-form-fieldRow input::-webkit-input-placeholder,#mlb2-1709472.ml-form-embedContainer .ml-form-embedWrapper .ml-form-embedBody .ml-form-horizontalRow input::-webkit-input-placeholder{color:#333}#mlb2-1709472.ml-form-embedContainer .ml-form-embedWrapper .ml-form-embedBody .ml-form-fieldRow input::-moz-placeholder,#mlb2-1709472.ml-form-embedContainer .ml-form-embedWrapper .ml-form-embedBody .ml-form-horizontalRow input::-moz-placeholder{color:#333}#mlb2-1709472.ml-form-embedContainer .ml-form-embedWrapper .ml-form-embedBody .ml-form-fieldRow input:-ms-input-placeholder,#mlb2-1709472.ml-form-embedContainer .ml-form-embedWrapper .ml-form-embedBody .ml-form-horizontalRow input:-ms-input-placeholder{color:#333}#mlb2-1709472.ml-form-embedContainer .ml-form-embedWrapper .ml-form-embedBody .ml-form-fieldRow input:-moz-placeholder,#mlb2-1709472.ml-form-embedContainer .ml-form-embedWrapper .ml-form-embedBody .ml-form-horizontalRow input:-moz-placeholder{color:#333}#mlb2-1709472.ml-form-embedContainer .ml-form-embedWrapper .ml-form-embedBody .ml-form-fieldRow textarea,#mlb2-1709472.ml-form-embedContainer .ml-form-embedWrapper .ml-form-embedBody .ml-form-horizontalRow textarea{background-color:#fff!important;color:#333!important;border-color:#ccc!important;border-radius:4px!important;border-style:solid!important;border-width:1px!important;font-family:'Open Sans',Arial,Helvetica,sans-serif;font-size:14px!important;height:auto;line-height:21px!important;margin-bottom:0;margin-top:0;padding:10px 10px!important;width:100%!important;box-sizing:border-box!important;max-width:100%!important}#mlb2-1709472.ml-form-embedContainer .ml-form-embedWrapper .ml-form-embedBody .ml-form-checkboxRow .label-description::before,#mlb2-1709472.ml-form-embedContainer .ml-form-embedWrapper .ml-form-embedBody .ml-form-embedPermissions .ml-form-embedPermissionsOptionsCheckbox .label-description::before,#mlb2-1709472.ml-form-embedContainer .ml-form-embedWrapper .ml-form-embedBody .ml-form-fieldRow .custom-checkbox .custom-control-label::before,#mlb2-1709472.ml-form-embedContainer .ml-form-embedWrapper .ml-form-embedBody .ml-form-fieldRow .custom-radio .custom-control-label::before,#mlb2-1709472.ml-form-embedContainer .ml-form-embedWrapper .ml-form-embedBody .ml-form-horizontalRow .custom-checkbox .custom-control-label::before,#mlb2-1709472.ml-form-embedContainer .ml-form-embedWrapper .ml-form-embedBody .ml-form-horizontalRow .custom-radio .custom-control-label::before,#mlb2-1709472.ml-form-embedContainer .ml-form-embedWrapper .ml-form-embedBody .ml-form-interestGroupsRow .ml-form-interestGroupsRowCheckbox .label-description::before{border-color:#ccc!important;background-color:#fff!important}#mlb2-1709472.ml-form-embedContainer .ml-form-embedWrapper .ml-form-embedBody .ml-form-fieldRow input.custom-control-input[type=checkbox]{box-sizing:border-box;padding:0;position:absolute;z-index:-1;opacity:0;margin-top:5px;margin-left:-1.5rem;overflow:visible}#mlb2-1709472.ml-form-embedContainer .ml-form-embedWrapper .ml-form-embedBody .ml-form-checkboxRow .label-description::before,#mlb2-1709472.ml-form-embedContainer .ml-form-embedWrapper .ml-form-embedBody .ml-form-embedPermissions .ml-form-embedPermissionsOptionsCheckbox .label-description::before,#mlb2-1709472.ml-form-embedContainer .ml-form-embedWrapper .ml-form-embedBody .ml-form-fieldRow .custom-checkbox .custom-control-label::before,#mlb2-1709472.ml-form-embedContainer .ml-form-embedWrapper .ml-form-embedBody .ml-form-horizontalRow .custom-checkbox .custom-control-label::before,#mlb2-1709472.ml-form-embedContainer .ml-form-embedWrapper .ml-form-embedBody .ml-form-interestGroupsRow .ml-form-interestGroupsRowCheckbox .label-description::before{border-radius:4px!important}#mlb2-1709472.ml-form-embedContainer .ml-form-embedWrapper .ml-form-embedBody .ml-form-checkboxRow input[type=checkbox]:checked~.label-description::after,#mlb2-1709472.ml-form-embedContainer .ml-form-embedWrapper .ml-form-embedBody .ml-form-embedPermissions .ml-form-embedPermissionsOptionsCheckbox input[type=checkbox]:checked~.label-description::after,#mlb2-1709472.ml-form-embedContainer .ml-form-embedWrapper .ml-form-embedBody .ml-form-fieldRow .custom-checkbox .custom-control-input:checked~.custom-control-label::after,#mlb2-1709472.ml-form-embedContainer .ml-form-embedWrapper .ml-form-embedBody .ml-form-horizontalRow .custom-checkbox .custom-control-input:checked~.custom-control-label::after,#mlb2-1709472.ml-form-embedContainer .ml-form-embedWrapper .ml-form-embedBody .ml-form-interestGroupsRow .ml-form-interestGroupsRowCheckbox input[type=checkbox]:checked~.label-description::after{background-image:url("data:image/svg+xml,%3csvg xmlns='http://www.w3.org/2000/svg' viewBox='0 0 8 8'%3e%3cpath fill='%23fff' d='M6.564.75l-3.59 3.612-1.538-1.55L0 4.26 2.974 7.25 8 2.193z'/%3e%3c/svg%3e")}#mlb2-1709472.ml-form-embedContainer .ml-form-embedWrapper .ml-form-embedBody .ml-form-fieldRow .custom-radio .custom-control-input:checked~.custom-control-label::after{background-image:url("data:image/svg+xml,%3csvg xmlns='http://www.w3.org/2000/svg' viewBox='-4 -4 8 8'%3e%3ccircle r='3' fill='%23fff'/%3e%3c/svg%3e")}#mlb2-1709472.ml-form-embedContainer .ml-form-embedWrapper .ml-form-embedBody .ml-form-checkboxRow input[type=checkbox]:checked~.label-description::before,#mlb2-1709472.ml-form-embedContainer .ml-form-embedWrapper .ml-form-embedBody .ml-form-embedPermissions .ml-form-embedPermissionsOptionsCheckbox input[type=checkbox]:checked~.label-description::before,#mlb2-1709472.ml-form-embedContainer .ml-form-embedWrapper .ml-form-embedBody .ml-form-fieldRow .custom-checkbox .custom-control-input:checked~.custom-control-label::before,#mlb2-1709472.ml-form-embedContainer .ml-form-embedWrapper .ml-form-embedBody .ml-form-fieldRow .custom-radio .custom-control-input:checked~.custom-control-label::before,#mlb2-1709472.ml-form-embedContainer .ml-form-embedWrapper .ml-form-embedBody .ml-form-horizontalRow .custom-checkbox .custom-control-input:checked~.custom-control-label::before,#mlb2-1709472.ml-form-embedContainer .ml-form-embedWrapper .ml-form-embedBody .ml-form-horizontalRow .custom-radio .custom-control-input:checked~.custom-control-label::before,#mlb2-1709472.ml-form-embedContainer .ml-form-embedWrapper .ml-form-embedBody .ml-form-interestGroupsRow .ml-form-interestGroupsRowCheckbox input[type=checkbox]:checked~.label-description::before{border-color:#000!important;background-color:#000!important;color:#fff!important}#mlb2-1709472.ml-form-embedContainer .ml-form-embedWrapper .ml-form-embedBody .ml-form-fieldRow .custom-checkbox .custom-control-label::after,#mlb2-1709472.ml-form-embedContainer .ml-form-embedWrapper .ml-form-embedBody .ml-form-fieldRow .custom-checkbox .custom-control-label::before,#mlb2-1709472.ml-form-embedContainer .ml-form-embedWrapper .ml-form-embedBody .ml-form-fieldRow .custom-radio .custom-control-label::after,#mlb2-1709472.ml-form-embedContainer .ml-form-embedWrapper .ml-form-embedBody .ml-form-fieldRow .custom-radio .custom-control-label::before,#mlb2-1709472.ml-form-embedContainer .ml-form-embedWrapper .ml-form-embedBody .ml-form-horizontalRow .custom-checkbox .custom-control-label::after,#mlb2-1709472.ml-form-embedContainer .ml-form-embedWrapper .ml-form-embedBody .ml-form-horizontalRow .custom-checkbox .custom-control-label::before,#mlb2-1709472.ml-form-embedContainer .ml-form-embedWrapper .ml-form-embedBody .ml-form-horizontalRow .custom-radio .custom-control-label::after,#mlb2-1709472.ml-form-embedContainer .ml-form-embedWrapper .ml-form-embedBody .ml-form-horizontalRow .custom-radio .custom-control-label::before{top:2px;box-sizing:border-box}#mlb2-1709472.ml-form-embedContainer .ml-form-embedWrapper .ml-form-embedBody .ml-form-checkboxRow .label-description::after,#mlb2-1709472.ml-form-embedContainer .ml-form-embedWrapper .ml-form-embedBody .ml-form-checkboxRow .label-description::before,#mlb2-1709472.ml-form-embedContainer .ml-form-embedWrapper .ml-form-embedBody .ml-form-embedPermissions .ml-form-embedPermissionsOptionsCheckbox .label-description::after,#mlb2-1709472.ml-form-embedContainer .ml-form-embedWrapper .ml-form-embedBody .ml-form-embedPermissions .ml-form-embedPermissionsOptionsCheckbox .label-description::before{top:0!important;box-sizing:border-box!important}#mlb2-1709472.ml-form-embedContainer .ml-form-embedWrapper .ml-form-embedBody .ml-form-checkboxRow .label-description::after,#mlb2-1709472.ml-form-embedContainer .ml-form-embedWrapper .ml-form-embedBody .ml-form-checkboxRow .label-description::before{top:0!important;box-sizing:border-box!important}#mlb2-1709472.ml-form-embedContainer .ml-form-embedWrapper .ml-form-embedBody .ml-form-interestGroupsRow .ml-form-interestGroupsRowCheckbox .label-description::after{top:0!important;box-sizing:border-box!important;position:absolute;left:-1.5rem;display:block;width:1rem;height:1rem;content:""}#mlb2-1709472.ml-form-embedContainer .ml-form-embedWrapper .ml-form-embedBody .ml-form-interestGroupsRow .ml-form-interestGroupsRowCheckbox .label-description::before{top:0!important;box-sizing:border-box!important}#mlb2-1709472.ml-form-embedContainer .ml-form-embedWrapper .ml-form-embedBody .custom-control-label::before{position:absolute;top:4px;left:-1.5rem;display:block;width:16px;height:16px;pointer-events:none;content:"";background-color:#fff;border:#adb5bd solid 1px;border-radius:50%}#mlb2-1709472.ml-form-embedContainer .ml-form-embedWrapper .ml-form-embedBody .custom-control-label::after{position:absolute;top:2px!important;left:-1.5rem;display:block;width:1rem;height:1rem;content:""}#mlb2-1709472.ml-form-embedContainer .ml-form-embedWrapper .ml-form-embedBody .ml-form-checkboxRow .label-description::before,#mlb2-1709472.ml-form-embedContainer .ml-form-embedWrapper .ml-form-embedBody .ml-form-embedPermissions .ml-form-embedPermissionsOptionsCheckbox .label-description::before,#mlb2-1709472.ml-form-embedContainer .ml-form-embedWrapper .ml-form-embedBody .ml-form-interestGroupsRow .ml-form-interestGroupsRowCheckbox .label-description::before{position:absolute;top:4px;left:-1.5rem;display:block;width:16px;height:16px;pointer-events:none;content:"";background-color:#fff;border:#adb5bd solid 1px;border-radius:50%}#mlb2-1709472.ml-form-embedContainer .ml-form-embedWrapper .ml-form-embedBody .ml-form-embedPermissions .ml-form-embedPermissionsOptionsCheckbox .label-description::after{position:absolute;top:0!important;left:-1.5rem;display:block;width:1rem;height:1rem;content:""}#mlb2-1709472.ml-form-embedContainer .ml-form-embedWrapper .ml-form-embedBody .ml-form-checkboxRow .label-description::after{position:absolute;top:0!important;left:-1.5rem;display:block;width:1rem;height:1rem;content:""}#mlb2-1709472.ml-form-embedContainer .ml-form-embedWrapper .ml-form-embedBody .custom-radio .custom-control-label::after{background:no-repeat 50%/50% 50%}#mlb2-1709472.ml-form-embedContainer .ml-form-embedWrapper .ml-form-embedBody .custom-checkbox .custom-control-label::after,#mlb2-1709472.ml-form-embedContainer .ml-form-embedWrapper .ml-form-embedBody .ml-form-checkboxRow .label-description::after,#mlb2-1709472.ml-form-embedContainer .ml-form-embedWrapper .ml-form-embedBody .ml-form-embedPermissions .ml-form-embedPermissionsOptionsCheckbox .label-description::after,#mlb2-1709472.ml-form-embedContainer .ml-form-embedWrapper .ml-form-embedBody .ml-form-interestGroupsRow .ml-form-interestGroupsRowCheckbox .label-description::after{background:no-repeat 50%/50% 50%}#mlb2-1709472.ml-form-embedContainer .ml-form-embedWrapper .ml-form-embedBody .ml-form-fieldRow .custom-control,#mlb2-1709472.ml-form-embedContainer .ml-form-embedWrapper .ml-form-embedBody .ml-form-horizontalRow .custom-control{position:relative;display:block;min-height:1.5rem;padding-left:1.5rem}#mlb2-1709472.ml-form-embedContainer .ml-form-embedWrapper .ml-form-embedBody .ml-form-fieldRow .custom-checkbox .custom-control-input,#mlb2-1709472.ml-form-embedContainer .ml-form-embedWrapper .ml-form-embedBody .ml-form-fieldRow .custom-radio .custom-control-input,#mlb2-1709472.ml-form-embedContainer .ml-form-embedWrapper .ml-form-embedBody .ml-form-horizontalRow .custom-checkbox .custom-control-input,#mlb2-1709472.ml-form-embedContainer .ml-form-embedWrapper .ml-form-embedBody .ml-form-horizontalRow .custom-radio .custom-control-input{position:absolute;z-index:-1;opacity:0;box-sizing:border-box;padding:0}#mlb2-1709472.ml-form-embedContainer .ml-form-embedWrapper .ml-form-embedBody .ml-form-fieldRow .custom-checkbox .custom-control-label,#mlb2-1709472.ml-form-embedContainer .ml-form-embedWrapper .ml-form-embedBody .ml-form-fieldRow .custom-radio .custom-control-label,#mlb2-1709472.ml-form-embedContainer .ml-form-embedWrapper .ml-form-embedBody .ml-form-horizontalRow .custom-checkbox .custom-control-label,#mlb2-1709472.ml-form-embedContainer .ml-form-embedWrapper .ml-form-embedBody .ml-form-horizontalRow .custom-radio .custom-control-label{color:#000;font-size:12px!important;font-family:'Open Sans',Arial,Helvetica,sans-serif;line-height:22px;margin-bottom:0;position:relative;vertical-align:top;font-style:normal;font-weight:700}#mlb2-1709472.ml-form-embedContainer .ml-form-embedWrapper .ml-form-embedBody .ml-form-fieldRow .custom-select,#mlb2-1709472.ml-form-embedContainer .ml-form-embedWrapper .ml-form-embedBody .ml-form-horizontalRow .custom-select{background-color:#fff!important;color:#333!important;border-color:#ccc!important;border-radius:4px!important;border-style:solid!important;border-width:1px!important;font-family:'Open Sans',Arial,Helvetica,sans-serif;font-size:14px!important;line-height:20px!important;margin-bottom:0;margin-top:0;padding:10px 28px 10px 12px!important;width:100%!important;box-sizing:border-box!important;max-width:100%!important;height:auto;display:inline-block;vertical-align:middle;background:url(https://cdn.mailerlite.com/images/def...) no-repeat right .75rem center/8px 10px;-webkit-appearance:none;-moz-appearance:none;appearance:none}#mlb2-1709472.ml-form-embedContainer .ml-form-embedWrapper .ml-form-embedBody .ml-form-horizontalRow{height:auto;width:100%;float:left}.ml-form-formContent.horozintalForm .ml-form-horizontalRow .ml-input-horizontal{width:70%;float:left}.ml-form-formContent.horozintalForm .ml-form-horizontalRow .ml-button-horizontal{width:30%;float:left}.ml-form-formContent.horozintalForm .ml-form-horizontalRow .ml-button-horizontal.labelsOn{padding-top:25px}.ml-form-formContent.horozintalForm .ml-form-horizontalRow .horizontal-fields{box-sizing:border-box;float:left;padding-right:10px}#mlb2-1709472.ml-form-embedContainer .ml-form-embedWrapper .ml-form-embedBody .ml-form-horizontalRow input{background-color:#fff;color:#333;border-color:#ccc;border-radius:4px;border-style:solid;border-width:1px;font-family:'Open Sans',Arial,Helvetica,sans-serif;font-size:14px;line-height:20px;margin-bottom:0;margin-top:0;padding:10px 10px;width:100%;box-sizing:border-box;overflow-y:initial}#mlb2-1709472.ml-form-embedContainer .ml-form-embedWrapper .ml-form-embedBody .ml-form-horizontalRow button{background-color:#000!important;border-color:#000;border-style:solid;border-width:1px;border-radius:4px;box-shadow:none;color:#fff!important;cursor:pointer;font-family:'Open Sans',Arial,Helvetica,sans-serif;font-size:14px!important;font-weight:700;line-height:20px;margin:0!important;padding:10px!important;width:100%;height:auto}#mlb2-1709472.ml-form-embedContainer .ml-form-embedWrapper .ml-form-embedBody .ml-form-horizontalRow button:hover{background-color:#333!important;border-color:#333!important}#mlb2-1709472.ml-form-embedContainer .ml-form-embedWrapper .ml-form-embedBody .ml-form-checkboxRow input[type=checkbox]{box-sizing:border-box;padding:0;position:absolute;z-index:-1;opacity:0;margin-top:5px;margin-left:-1.5rem;overflow:visible}#mlb2-1709472.ml-form-embedContainer .ml-form-embedWrapper .ml-form-embedBody .ml-form-checkboxRow .label-description{color:#000;display:block;font-family:'Open Sans',Arial,Helvetica,sans-serif;font-size:12px;text-align:left;margin-bottom:0;position:relative;vertical-align:top}#mlb2-1709472.ml-form-embedContainer .ml-form-embedWrapper .ml-form-embedBody .ml-form-checkboxRow label{font-weight:400;margin:0;padding:0;position:relative;display:block;min-height:24px;padding-left:24px}#mlb2-1709472.ml-form-embedContainer .ml-form-embedWrapper .ml-form-embedBody .ml-form-checkboxRow label a{color:#000;text-decoration:underline}#mlb2-1709472.ml-form-embedContainer .ml-form-embedWrapper .ml-form-embedBody .ml-form-checkboxRow label p{color:#000!important;font-family:'Open Sans',Arial,Helvetica,sans-serif!important;font-size:12px!important;font-weight:400!important;line-height:18px!important;padding:0!important;margin:0 5px 0 0!important}#mlb2-1709472.ml-form-embedContainer .ml-form-embedWrapper .ml-form-embedBody .ml-form-checkboxRow label p:last-child{margin:0}#mlb2-1709472.ml-form-embedContainer .ml-form-embedWrapper .ml-form-embedBody .ml-form-embedSubmit{margin:0 0 20px 0;float:left;width:100%}#mlb2-1709472.ml-form-embedContainer .ml-form-embedWrapper .ml-form-embedBody .ml-form-embedSubmit button{background-color:#000!important;border:none!important;border-radius:4px!important;box-shadow:none!important;color:#fff!important;cursor:pointer;font-family:'Open Sans',Arial,Helvetica,sans-serif!important;font-size:14px!important;font-weight:700!important;line-height:21px!important;height:auto;padding:10px!important;width:100%!important;box-sizing:border-box!important}#mlb2-1709472.ml-form-embedContainer .ml-form-embedWrapper .ml-form-embedBody .ml-form-embedSubmit button.loading{display:none}#mlb2-1709472.ml-form-embedContainer .ml-form-embedWrapper .ml-form-embedBody .ml-form-embedSubmit button:hover{background-color:#333!important}.ml-subscribe-close{width:30px;height:30px;background:url(https://cdn.mailerlite.com/images/def...) no-repeat;background-size:30px;cursor:pointer;margin-top:-10px;margin-right:-10px;position:absolute;top:0;right:0}.ml-error input{border-color:red!important}.ml-error .label-description,.ml-error .label-description p,.ml-error .label-description p a,.ml-error label:first-child{color:red!important}#mlb2-1709472.ml-form-embedContainer .ml-form-embedWrapper .ml-form-embedBody .ml-form-checkboxRow.ml-error .label-description p,#mlb2-1709472.ml-form-embedContainer .ml-form-embedWrapper .ml-form-embedBody .ml-form-checkboxRow.ml-error .label-description p:first-letter{color:red!important}@media only screen and (max-width:400px){.ml-form-embedWrapper.embedDefault,.ml-form-embedWrapper.embedPopup{width:100%!important}.ml-form-formContent.horozintalForm{float:left!important}.ml-form-formContent.horozintalForm .ml-form-horizontalRow{height:auto!important;width:100%!important;float:left!important}.ml-form-formContent.horozintalForm .ml-form-horizontalRow .ml-input-horizontal{width:100%!important}.ml-form-formContent.horozintalForm .ml-form-horizontalRow .ml-input-horizontal>div{padding-right:0!important;padding-bottom:10px}.ml-form-formContent.horozintalForm .ml-button-horizontal{width:100%!important}.ml-form-formContent.horozintalForm .ml-button-horizontal.labelsOn{padding-top:0!important}} Tired of struggling with the TECHNICAL ASPECTS of being an author? Receive a monthly newsletter filled with tech hints and helpful pearls of wisdom. No spam – only valuable information.Subscribe Loading… Thank you!
You have successfully joined our subscriber list.
function ml_webform_success_1709472(){var r=ml_jQuery||jQuery;r(".ml-subscribe-form-1709472 .row-success").show(),r(".ml-subscribe-form-1709472 .row-form").hide()}The post The Rise of Social Commerce [Infographic] appeared first on Bakerview Consulting.
June 23, 2021
Improve the Performance of Your Website Through Image Optimization [Infographic]
Welcome Back!
Do you optimize your images? It is an easy step but one that has a huge amount of power associated. Do you know why you would want to do this? Today’s infographic share is chock full of great information. I found this great infographic at one of my favorite blogs – Social Media Today – be sure to click and read the full post.
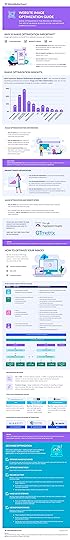
I hope you enjoyed this infographic. Please use the share buttons below to share with friends that might benefit from this information. If you haven’t already, please subscribe to my mailing list and receive some technical hints focused at your needs!
@import url(https://static.mailerlite.com/assets/... .ml-form-embedSubmitLoad{display:inline-block;width:20px;height:20px}.sr-only{position:absolute;width:1px;height:1px;padding:0;margin:-1px;overflow:hidden;clip:rect(0,0,0,0);border:0}.ml-form-embedSubmitLoad:after{content:" ";display:block;width:11px;height:11px;margin:1px;border-radius:50%;border:4px solid #fff;border-color:#fff #fff #fff transparent;animation:ml-form-embedSubmitLoad 1.2s linear infinite}@keyframes ml-form-embedSubmitLoad{0%{transform:rotate(0)}100%{transform:rotate(360deg)}}#mlb2-1709472.ml-form-embedContainer{box-sizing:border-box;display:table;margin:0 auto;position:static;width:100%!important}#mlb2-1709472.ml-form-embedContainer button,#mlb2-1709472.ml-form-embedContainer h4,#mlb2-1709472.ml-form-embedContainer p,#mlb2-1709472.ml-form-embedContainer span{text-transform:none!important;letter-spacing:normal!important}#mlb2-1709472.ml-form-embedContainer .ml-form-embedWrapper{background-color:#f6f6f6;border-width:0;border-color:transparent;border-radius:4px;border-style:solid;box-sizing:border-box;display:inline-block!important;margin:0;padding:0;position:relative}#mlb2-1709472.ml-form-embedContainer .ml-form-embedWrapper.embedDefault,#mlb2-1709472.ml-form-embedContainer .ml-form-embedWrapper.embedPopup{width:400px}#mlb2-1709472.ml-form-embedContainer .ml-form-embedWrapper.embedForm{max-width:400px;width:100%}#mlb2-1709472.ml-form-embedContainer .ml-form-align-left{text-align:left}#mlb2-1709472.ml-form-embedContainer .ml-form-align-center{text-align:center}#mlb2-1709472.ml-form-embedContainer .ml-form-align-default{display:table-cell!important;vertical-align:middle!important;text-align:center!important}#mlb2-1709472.ml-form-embedContainer .ml-form-align-right{text-align:right}#mlb2-1709472.ml-form-embedContainer .ml-form-embedWrapper .ml-form-embedHeader img{border-top-left-radius:4px;border-top-right-radius:4px;height:auto;margin:0 auto!important;max-width:100%;width:undefinedpx}#mlb2-1709472.ml-form-embedContainer .ml-form-embedWrapper .ml-form-embedBody,#mlb2-1709472.ml-form-embedContainer .ml-form-embedWrapper .ml-form-successBody{padding:20px 20px 0 20px}#mlb2-1709472.ml-form-embedContainer .ml-form-embedWrapper .ml-form-embedBody.ml-form-embedBodyHorizontal{padding-bottom:0}#mlb2-1709472.ml-form-embedContainer .ml-form-embedWrapper .ml-form-embedBody .ml-form-embedContent,#mlb2-1709472.ml-form-embedContainer .ml-form-embedWrapper .ml-form-successBody .ml-form-successContent{text-align:left;margin:0 0 20px 0}#mlb2-1709472.ml-form-embedContainer .ml-form-embedWrapper .ml-form-embedBody .ml-form-embedContent h4,#mlb2-1709472.ml-form-embedContainer .ml-form-embedWrapper .ml-form-successBody .ml-form-successContent h4{color:#000;font-family:'Open Sans',Arial,Helvetica,sans-serif;font-size:30px;font-weight:400;margin:0 0 10px 0;text-align:left;word-break:break-word}#mlb2-1709472.ml-form-embedContainer .ml-form-embedWrapper .ml-form-embedBody .ml-form-embedContent p,#mlb2-1709472.ml-form-embedContainer .ml-form-embedWrapper .ml-form-successBody .ml-form-successContent p{color:#000;font-family:'Open Sans',Arial,Helvetica,sans-serif;font-size:14px;font-weight:400;line-height:20px;margin:0 0 10px 0;text-align:left}#mlb2-1709472.ml-form-embedContainer .ml-form-embedWrapper .ml-form-embedBody .ml-form-embedContent ol,#mlb2-1709472.ml-form-embedContainer .ml-form-embedWrapper .ml-form-embedBody .ml-form-embedContent ul,#mlb2-1709472.ml-form-embedContainer .ml-form-embedWrapper .ml-form-successBody .ml-form-successContent ol,#mlb2-1709472.ml-form-embedContainer .ml-form-embedWrapper .ml-form-successBody .ml-form-successContent ul{color:#000;font-family:'Open Sans',Arial,Helvetica,sans-serif;font-size:14px}#mlb2-1709472.ml-form-embedContainer .ml-form-embedWrapper .ml-form-embedBody .ml-form-embedContent ol ol,#mlb2-1709472.ml-form-embedContainer .ml-form-embedWrapper .ml-form-successBody .ml-form-successContent ol ol{list-style-type:lower-alpha}#mlb2-1709472.ml-form-embedContainer .ml-form-embedWrapper .ml-form-embedBody .ml-form-embedContent ol ol ol,#mlb2-1709472.ml-form-embedContainer .ml-form-embedWrapper .ml-form-successBody .ml-form-successContent ol ol ol{list-style-type:lower-roman}#mlb2-1709472.ml-form-embedContainer .ml-form-embedWrapper .ml-form-embedBody .ml-form-embedContent p a,#mlb2-1709472.ml-form-embedContainer .ml-form-embedWrapper .ml-form-successBody .ml-form-successContent p a{color:#000;text-decoration:underline}#mlb2-1709472.ml-form-embedContainer .ml-form-embedWrapper .ml-block-form .ml-field-group{text-align:left!important}#mlb2-1709472.ml-form-embedContainer .ml-form-embedWrapper .ml-block-form .ml-field-group label{margin-bottom:5px;color:#333;font-size:14px;font-family:'Open Sans',Arial,Helvetica,sans-serif;font-weight:700;font-style:normal;text-decoration:none;display:inline-block;line-height:20px}#mlb2-1709472.ml-form-embedContainer .ml-form-embedWrapper .ml-form-embedBody .ml-form-embedContent p:last-child,#mlb2-1709472.ml-form-embedContainer .ml-form-embedWrapper .ml-form-successBody .ml-form-successContent p:last-child{margin:0}#mlb2-1709472.ml-form-embedContainer .ml-form-embedWrapper .ml-form-embedBody form{margin:0;width:100%}#mlb2-1709472.ml-form-embedContainer .ml-form-embedWrapper .ml-form-embedBody .ml-form-checkboxRow,#mlb2-1709472.ml-form-embedContainer .ml-form-embedWrapper .ml-form-embedBody .ml-form-formContent{margin:0 0 20px 0;width:100%}#mlb2-1709472.ml-form-embedContainer .ml-form-embedWrapper .ml-form-embedBody .ml-form-checkboxRow{float:left}#mlb2-1709472.ml-form-embedContainer .ml-form-embedWrapper .ml-form-embedBody .ml-form-formContent.horozintalForm{margin:0;padding:0 0 20px 0;width:100%;height:auto;float:left}#mlb2-1709472.ml-form-embedContainer .ml-form-embedWrapper .ml-form-embedBody .ml-form-fieldRow{margin:0 0 10px 0;width:100%}#mlb2-1709472.ml-form-embedContainer .ml-form-embedWrapper .ml-form-embedBody .ml-form-fieldRow.ml-last-item{margin:0}#mlb2-1709472.ml-form-embedContainer .ml-form-embedWrapper .ml-form-embedBody .ml-form-fieldRow.ml-formfieldHorizintal{margin:0}#mlb2-1709472.ml-form-embedContainer .ml-form-embedWrapper .ml-form-embedBody .ml-form-fieldRow input{background-color:#fff!important;color:#333!important;border-color:#ccc;border-radius:4px!important;border-style:solid!important;border-width:1px!important;font-family:'Open Sans',Arial,Helvetica,sans-serif;font-size:14px!important;height:auto;line-height:21px!important;margin-bottom:0;margin-top:0;margin-left:0;margin-right:0;padding:10px 10px!important;width:100%!important;box-sizing:border-box!important;max-width:100%!important}#mlb2-1709472.ml-form-embedContainer .ml-form-embedWrapper .ml-form-embedBody .ml-form-fieldRow input::-webkit-input-placeholder,#mlb2-1709472.ml-form-embedContainer .ml-form-embedWrapper .ml-form-embedBody .ml-form-horizontalRow input::-webkit-input-placeholder{color:#333}#mlb2-1709472.ml-form-embedContainer .ml-form-embedWrapper .ml-form-embedBody .ml-form-fieldRow input::-moz-placeholder,#mlb2-1709472.ml-form-embedContainer .ml-form-embedWrapper .ml-form-embedBody .ml-form-horizontalRow input::-moz-placeholder{color:#333}#mlb2-1709472.ml-form-embedContainer .ml-form-embedWrapper .ml-form-embedBody .ml-form-fieldRow input:-ms-input-placeholder,#mlb2-1709472.ml-form-embedContainer .ml-form-embedWrapper .ml-form-embedBody .ml-form-horizontalRow input:-ms-input-placeholder{color:#333}#mlb2-1709472.ml-form-embedContainer .ml-form-embedWrapper .ml-form-embedBody .ml-form-fieldRow input:-moz-placeholder,#mlb2-1709472.ml-form-embedContainer .ml-form-embedWrapper .ml-form-embedBody .ml-form-horizontalRow input:-moz-placeholder{color:#333}#mlb2-1709472.ml-form-embedContainer .ml-form-embedWrapper .ml-form-embedBody .ml-form-fieldRow textarea,#mlb2-1709472.ml-form-embedContainer .ml-form-embedWrapper .ml-form-embedBody .ml-form-horizontalRow textarea{background-color:#fff!important;color:#333!important;border-color:#ccc!important;border-radius:4px!important;border-style:solid!important;border-width:1px!important;font-family:'Open Sans',Arial,Helvetica,sans-serif;font-size:14px!important;height:auto;line-height:21px!important;margin-bottom:0;margin-top:0;padding:10px 10px!important;width:100%!important;box-sizing:border-box!important;max-width:100%!important}#mlb2-1709472.ml-form-embedContainer .ml-form-embedWrapper .ml-form-embedBody .ml-form-checkboxRow .label-description::before,#mlb2-1709472.ml-form-embedContainer .ml-form-embedWrapper .ml-form-embedBody .ml-form-embedPermissions .ml-form-embedPermissionsOptionsCheckbox .label-description::before,#mlb2-1709472.ml-form-embedContainer .ml-form-embedWrapper .ml-form-embedBody .ml-form-fieldRow .custom-checkbox .custom-control-label::before,#mlb2-1709472.ml-form-embedContainer .ml-form-embedWrapper .ml-form-embedBody .ml-form-fieldRow .custom-radio .custom-control-label::before,#mlb2-1709472.ml-form-embedContainer .ml-form-embedWrapper .ml-form-embedBody .ml-form-horizontalRow .custom-checkbox .custom-control-label::before,#mlb2-1709472.ml-form-embedContainer .ml-form-embedWrapper .ml-form-embedBody .ml-form-horizontalRow .custom-radio .custom-control-label::before,#mlb2-1709472.ml-form-embedContainer .ml-form-embedWrapper .ml-form-embedBody .ml-form-interestGroupsRow .ml-form-interestGroupsRowCheckbox .label-description::before{border-color:#ccc!important;background-color:#fff!important}#mlb2-1709472.ml-form-embedContainer .ml-form-embedWrapper .ml-form-embedBody .ml-form-fieldRow input.custom-control-input[type=checkbox]{box-sizing:border-box;padding:0;position:absolute;z-index:-1;opacity:0;margin-top:5px;margin-left:-1.5rem;overflow:visible}#mlb2-1709472.ml-form-embedContainer .ml-form-embedWrapper .ml-form-embedBody .ml-form-checkboxRow .label-description::before,#mlb2-1709472.ml-form-embedContainer .ml-form-embedWrapper .ml-form-embedBody .ml-form-embedPermissions .ml-form-embedPermissionsOptionsCheckbox .label-description::before,#mlb2-1709472.ml-form-embedContainer .ml-form-embedWrapper .ml-form-embedBody .ml-form-fieldRow .custom-checkbox .custom-control-label::before,#mlb2-1709472.ml-form-embedContainer .ml-form-embedWrapper .ml-form-embedBody .ml-form-horizontalRow .custom-checkbox .custom-control-label::before,#mlb2-1709472.ml-form-embedContainer .ml-form-embedWrapper .ml-form-embedBody .ml-form-interestGroupsRow .ml-form-interestGroupsRowCheckbox .label-description::before{border-radius:4px!important}#mlb2-1709472.ml-form-embedContainer .ml-form-embedWrapper .ml-form-embedBody .ml-form-checkboxRow input[type=checkbox]:checked~.label-description::after,#mlb2-1709472.ml-form-embedContainer .ml-form-embedWrapper .ml-form-embedBody .ml-form-embedPermissions .ml-form-embedPermissionsOptionsCheckbox input[type=checkbox]:checked~.label-description::after,#mlb2-1709472.ml-form-embedContainer .ml-form-embedWrapper .ml-form-embedBody .ml-form-fieldRow .custom-checkbox .custom-control-input:checked~.custom-control-label::after,#mlb2-1709472.ml-form-embedContainer .ml-form-embedWrapper .ml-form-embedBody .ml-form-horizontalRow .custom-checkbox .custom-control-input:checked~.custom-control-label::after,#mlb2-1709472.ml-form-embedContainer .ml-form-embedWrapper .ml-form-embedBody .ml-form-interestGroupsRow .ml-form-interestGroupsRowCheckbox input[type=checkbox]:checked~.label-description::after{background-image:url("data:image/svg+xml,%3csvg xmlns='http://www.w3.org/2000/svg' viewBox='0 0 8 8'%3e%3cpath fill='%23fff' d='M6.564.75l-3.59 3.612-1.538-1.55L0 4.26 2.974 7.25 8 2.193z'/%3e%3c/svg%3e")}#mlb2-1709472.ml-form-embedContainer .ml-form-embedWrapper .ml-form-embedBody .ml-form-fieldRow .custom-radio .custom-control-input:checked~.custom-control-label::after{background-image:url("data:image/svg+xml,%3csvg xmlns='http://www.w3.org/2000/svg' viewBox='-4 -4 8 8'%3e%3ccircle r='3' fill='%23fff'/%3e%3c/svg%3e")}#mlb2-1709472.ml-form-embedContainer .ml-form-embedWrapper .ml-form-embedBody .ml-form-checkboxRow input[type=checkbox]:checked~.label-description::before,#mlb2-1709472.ml-form-embedContainer .ml-form-embedWrapper .ml-form-embedBody .ml-form-embedPermissions .ml-form-embedPermissionsOptionsCheckbox input[type=checkbox]:checked~.label-description::before,#mlb2-1709472.ml-form-embedContainer .ml-form-embedWrapper .ml-form-embedBody .ml-form-fieldRow .custom-checkbox .custom-control-input:checked~.custom-control-label::before,#mlb2-1709472.ml-form-embedContainer .ml-form-embedWrapper .ml-form-embedBody .ml-form-fieldRow .custom-radio .custom-control-input:checked~.custom-control-label::before,#mlb2-1709472.ml-form-embedContainer .ml-form-embedWrapper .ml-form-embedBody .ml-form-horizontalRow .custom-checkbox .custom-control-input:checked~.custom-control-label::before,#mlb2-1709472.ml-form-embedContainer .ml-form-embedWrapper .ml-form-embedBody .ml-form-horizontalRow .custom-radio .custom-control-input:checked~.custom-control-label::before,#mlb2-1709472.ml-form-embedContainer .ml-form-embedWrapper .ml-form-embedBody .ml-form-interestGroupsRow .ml-form-interestGroupsRowCheckbox input[type=checkbox]:checked~.label-description::before{border-color:#000!important;background-color:#000!important;color:#fff!important}#mlb2-1709472.ml-form-embedContainer .ml-form-embedWrapper .ml-form-embedBody .ml-form-fieldRow .custom-checkbox .custom-control-label::after,#mlb2-1709472.ml-form-embedContainer .ml-form-embedWrapper .ml-form-embedBody .ml-form-fieldRow .custom-checkbox .custom-control-label::before,#mlb2-1709472.ml-form-embedContainer .ml-form-embedWrapper .ml-form-embedBody .ml-form-fieldRow .custom-radio .custom-control-label::after,#mlb2-1709472.ml-form-embedContainer .ml-form-embedWrapper .ml-form-embedBody .ml-form-fieldRow .custom-radio .custom-control-label::before,#mlb2-1709472.ml-form-embedContainer .ml-form-embedWrapper .ml-form-embedBody .ml-form-horizontalRow .custom-checkbox .custom-control-label::after,#mlb2-1709472.ml-form-embedContainer .ml-form-embedWrapper .ml-form-embedBody .ml-form-horizontalRow .custom-checkbox .custom-control-label::before,#mlb2-1709472.ml-form-embedContainer .ml-form-embedWrapper .ml-form-embedBody .ml-form-horizontalRow .custom-radio .custom-control-label::after,#mlb2-1709472.ml-form-embedContainer .ml-form-embedWrapper .ml-form-embedBody .ml-form-horizontalRow .custom-radio .custom-control-label::before{top:2px;box-sizing:border-box}#mlb2-1709472.ml-form-embedContainer .ml-form-embedWrapper .ml-form-embedBody .ml-form-checkboxRow .label-description::after,#mlb2-1709472.ml-form-embedContainer .ml-form-embedWrapper .ml-form-embedBody .ml-form-checkboxRow .label-description::before,#mlb2-1709472.ml-form-embedContainer .ml-form-embedWrapper .ml-form-embedBody .ml-form-embedPermissions .ml-form-embedPermissionsOptionsCheckbox .label-description::after,#mlb2-1709472.ml-form-embedContainer .ml-form-embedWrapper .ml-form-embedBody .ml-form-embedPermissions .ml-form-embedPermissionsOptionsCheckbox .label-description::before{top:0!important;box-sizing:border-box!important}#mlb2-1709472.ml-form-embedContainer .ml-form-embedWrapper .ml-form-embedBody .ml-form-checkboxRow .label-description::after,#mlb2-1709472.ml-form-embedContainer .ml-form-embedWrapper .ml-form-embedBody .ml-form-checkboxRow .label-description::before{top:0!important;box-sizing:border-box!important}#mlb2-1709472.ml-form-embedContainer .ml-form-embedWrapper .ml-form-embedBody .ml-form-interestGroupsRow .ml-form-interestGroupsRowCheckbox .label-description::after{top:0!important;box-sizing:border-box!important;position:absolute;left:-1.5rem;display:block;width:1rem;height:1rem;content:""}#mlb2-1709472.ml-form-embedContainer .ml-form-embedWrapper .ml-form-embedBody .ml-form-interestGroupsRow .ml-form-interestGroupsRowCheckbox .label-description::before{top:0!important;box-sizing:border-box!important}#mlb2-1709472.ml-form-embedContainer .ml-form-embedWrapper .ml-form-embedBody .custom-control-label::before{position:absolute;top:4px;left:-1.5rem;display:block;width:16px;height:16px;pointer-events:none;content:"";background-color:#fff;border:#adb5bd solid 1px;border-radius:50%}#mlb2-1709472.ml-form-embedContainer .ml-form-embedWrapper .ml-form-embedBody .custom-control-label::after{position:absolute;top:2px!important;left:-1.5rem;display:block;width:1rem;height:1rem;content:""}#mlb2-1709472.ml-form-embedContainer .ml-form-embedWrapper .ml-form-embedBody .ml-form-checkboxRow .label-description::before,#mlb2-1709472.ml-form-embedContainer .ml-form-embedWrapper .ml-form-embedBody .ml-form-embedPermissions .ml-form-embedPermissionsOptionsCheckbox .label-description::before,#mlb2-1709472.ml-form-embedContainer .ml-form-embedWrapper .ml-form-embedBody .ml-form-interestGroupsRow .ml-form-interestGroupsRowCheckbox .label-description::before{position:absolute;top:4px;left:-1.5rem;display:block;width:16px;height:16px;pointer-events:none;content:"";background-color:#fff;border:#adb5bd solid 1px;border-radius:50%}#mlb2-1709472.ml-form-embedContainer .ml-form-embedWrapper .ml-form-embedBody .ml-form-embedPermissions .ml-form-embedPermissionsOptionsCheckbox .label-description::after{position:absolute;top:0!important;left:-1.5rem;display:block;width:1rem;height:1rem;content:""}#mlb2-1709472.ml-form-embedContainer .ml-form-embedWrapper .ml-form-embedBody .ml-form-checkboxRow .label-description::after{position:absolute;top:0!important;left:-1.5rem;display:block;width:1rem;height:1rem;content:""}#mlb2-1709472.ml-form-embedContainer .ml-form-embedWrapper .ml-form-embedBody .custom-radio .custom-control-label::after{background:no-repeat 50%/50% 50%}#mlb2-1709472.ml-form-embedContainer .ml-form-embedWrapper .ml-form-embedBody .custom-checkbox .custom-control-label::after,#mlb2-1709472.ml-form-embedContainer .ml-form-embedWrapper .ml-form-embedBody .ml-form-checkboxRow .label-description::after,#mlb2-1709472.ml-form-embedContainer .ml-form-embedWrapper .ml-form-embedBody .ml-form-embedPermissions .ml-form-embedPermissionsOptionsCheckbox .label-description::after,#mlb2-1709472.ml-form-embedContainer .ml-form-embedWrapper .ml-form-embedBody .ml-form-interestGroupsRow .ml-form-interestGroupsRowCheckbox .label-description::after{background:no-repeat 50%/50% 50%}#mlb2-1709472.ml-form-embedContainer .ml-form-embedWrapper .ml-form-embedBody .ml-form-fieldRow .custom-control,#mlb2-1709472.ml-form-embedContainer .ml-form-embedWrapper .ml-form-embedBody .ml-form-horizontalRow .custom-control{position:relative;display:block;min-height:1.5rem;padding-left:1.5rem}#mlb2-1709472.ml-form-embedContainer .ml-form-embedWrapper .ml-form-embedBody .ml-form-fieldRow .custom-checkbox .custom-control-input,#mlb2-1709472.ml-form-embedContainer .ml-form-embedWrapper .ml-form-embedBody .ml-form-fieldRow .custom-radio .custom-control-input,#mlb2-1709472.ml-form-embedContainer .ml-form-embedWrapper .ml-form-embedBody .ml-form-horizontalRow .custom-checkbox .custom-control-input,#mlb2-1709472.ml-form-embedContainer .ml-form-embedWrapper .ml-form-embedBody .ml-form-horizontalRow .custom-radio .custom-control-input{position:absolute;z-index:-1;opacity:0;box-sizing:border-box;padding:0}#mlb2-1709472.ml-form-embedContainer .ml-form-embedWrapper .ml-form-embedBody .ml-form-fieldRow .custom-checkbox .custom-control-label,#mlb2-1709472.ml-form-embedContainer .ml-form-embedWrapper .ml-form-embedBody .ml-form-fieldRow .custom-radio .custom-control-label,#mlb2-1709472.ml-form-embedContainer .ml-form-embedWrapper .ml-form-embedBody .ml-form-horizontalRow .custom-checkbox .custom-control-label,#mlb2-1709472.ml-form-embedContainer .ml-form-embedWrapper .ml-form-embedBody .ml-form-horizontalRow .custom-radio .custom-control-label{color:#000;font-size:12px!important;font-family:'Open Sans',Arial,Helvetica,sans-serif;line-height:22px;margin-bottom:0;position:relative;vertical-align:top;font-style:normal;font-weight:700}#mlb2-1709472.ml-form-embedContainer .ml-form-embedWrapper .ml-form-embedBody .ml-form-fieldRow .custom-select,#mlb2-1709472.ml-form-embedContainer .ml-form-embedWrapper .ml-form-embedBody .ml-form-horizontalRow .custom-select{background-color:#fff!important;color:#333!important;border-color:#ccc!important;border-radius:4px!important;border-style:solid!important;border-width:1px!important;font-family:'Open Sans',Arial,Helvetica,sans-serif;font-size:14px!important;line-height:20px!important;margin-bottom:0;margin-top:0;padding:10px 28px 10px 12px!important;width:100%!important;box-sizing:border-box!important;max-width:100%!important;height:auto;display:inline-block;vertical-align:middle;background:url(https://cdn.mailerlite.com/images/def...) no-repeat right .75rem center/8px 10px;-webkit-appearance:none;-moz-appearance:none;appearance:none}#mlb2-1709472.ml-form-embedContainer .ml-form-embedWrapper .ml-form-embedBody .ml-form-horizontalRow{height:auto;width:100%;float:left}.ml-form-formContent.horozintalForm .ml-form-horizontalRow .ml-input-horizontal{width:70%;float:left}.ml-form-formContent.horozintalForm .ml-form-horizontalRow .ml-button-horizontal{width:30%;float:left}.ml-form-formContent.horozintalForm .ml-form-horizontalRow .ml-button-horizontal.labelsOn{padding-top:25px}.ml-form-formContent.horozintalForm .ml-form-horizontalRow .horizontal-fields{box-sizing:border-box;float:left;padding-right:10px}#mlb2-1709472.ml-form-embedContainer .ml-form-embedWrapper .ml-form-embedBody .ml-form-horizontalRow input{background-color:#fff;color:#333;border-color:#ccc;border-radius:4px;border-style:solid;border-width:1px;font-family:'Open Sans',Arial,Helvetica,sans-serif;font-size:14px;line-height:20px;margin-bottom:0;margin-top:0;padding:10px 10px;width:100%;box-sizing:border-box;overflow-y:initial}#mlb2-1709472.ml-form-embedContainer .ml-form-embedWrapper .ml-form-embedBody .ml-form-horizontalRow button{background-color:#000!important;border-color:#000;border-style:solid;border-width:1px;border-radius:4px;box-shadow:none;color:#fff!important;cursor:pointer;font-family:'Open Sans',Arial,Helvetica,sans-serif;font-size:14px!important;font-weight:700;line-height:20px;margin:0!important;padding:10px!important;width:100%;height:auto}#mlb2-1709472.ml-form-embedContainer .ml-form-embedWrapper .ml-form-embedBody .ml-form-horizontalRow button:hover{background-color:#333!important;border-color:#333!important}#mlb2-1709472.ml-form-embedContainer .ml-form-embedWrapper .ml-form-embedBody .ml-form-checkboxRow input[type=checkbox]{box-sizing:border-box;padding:0;position:absolute;z-index:-1;opacity:0;margin-top:5px;margin-left:-1.5rem;overflow:visible}#mlb2-1709472.ml-form-embedContainer .ml-form-embedWrapper .ml-form-embedBody .ml-form-checkboxRow .label-description{color:#000;display:block;font-family:'Open Sans',Arial,Helvetica,sans-serif;font-size:12px;text-align:left;margin-bottom:0;position:relative;vertical-align:top}#mlb2-1709472.ml-form-embedContainer .ml-form-embedWrapper .ml-form-embedBody .ml-form-checkboxRow label{font-weight:400;margin:0;padding:0;position:relative;display:block;min-height:24px;padding-left:24px}#mlb2-1709472.ml-form-embedContainer .ml-form-embedWrapper .ml-form-embedBody .ml-form-checkboxRow label a{color:#000;text-decoration:underline}#mlb2-1709472.ml-form-embedContainer .ml-form-embedWrapper .ml-form-embedBody .ml-form-checkboxRow label p{color:#000!important;font-family:'Open Sans',Arial,Helvetica,sans-serif!important;font-size:12px!important;font-weight:400!important;line-height:18px!important;padding:0!important;margin:0 5px 0 0!important}#mlb2-1709472.ml-form-embedContainer .ml-form-embedWrapper .ml-form-embedBody .ml-form-checkboxRow label p:last-child{margin:0}#mlb2-1709472.ml-form-embedContainer .ml-form-embedWrapper .ml-form-embedBody .ml-form-embedSubmit{margin:0 0 20px 0;float:left;width:100%}#mlb2-1709472.ml-form-embedContainer .ml-form-embedWrapper .ml-form-embedBody .ml-form-embedSubmit button{background-color:#000!important;border:none!important;border-radius:4px!important;box-shadow:none!important;color:#fff!important;cursor:pointer;font-family:'Open Sans',Arial,Helvetica,sans-serif!important;font-size:14px!important;font-weight:700!important;line-height:21px!important;height:auto;padding:10px!important;width:100%!important;box-sizing:border-box!important}#mlb2-1709472.ml-form-embedContainer .ml-form-embedWrapper .ml-form-embedBody .ml-form-embedSubmit button.loading{display:none}#mlb2-1709472.ml-form-embedContainer .ml-form-embedWrapper .ml-form-embedBody .ml-form-embedSubmit button:hover{background-color:#333!important}.ml-subscribe-close{width:30px;height:30px;background:url(https://cdn.mailerlite.com/images/def...) no-repeat;background-size:30px;cursor:pointer;margin-top:-10px;margin-right:-10px;position:absolute;top:0;right:0}.ml-error input{border-color:red!important}.ml-error .label-description,.ml-error .label-description p,.ml-error .label-description p a,.ml-error label:first-child{color:red!important}#mlb2-1709472.ml-form-embedContainer .ml-form-embedWrapper .ml-form-embedBody .ml-form-checkboxRow.ml-error .label-description p,#mlb2-1709472.ml-form-embedContainer .ml-form-embedWrapper .ml-form-embedBody .ml-form-checkboxRow.ml-error .label-description p:first-letter{color:red!important}@media only screen and (max-width:400px){.ml-form-embedWrapper.embedDefault,.ml-form-embedWrapper.embedPopup{width:100%!important}.ml-form-formContent.horozintalForm{float:left!important}.ml-form-formContent.horozintalForm .ml-form-horizontalRow{height:auto!important;width:100%!important;float:left!important}.ml-form-formContent.horozintalForm .ml-form-horizontalRow .ml-input-horizontal{width:100%!important}.ml-form-formContent.horozintalForm .ml-form-horizontalRow .ml-input-horizontal>div{padding-right:0!important;padding-bottom:10px}.ml-form-formContent.horozintalForm .ml-button-horizontal{width:100%!important}.ml-form-formContent.horozintalForm .ml-button-horizontal.labelsOn{padding-top:0!important}} Tired of struggling with the TECHNICAL ASPECTS of being an author? Receive a monthly newsletter filled with tech hints and helpful pearls of wisdom. No spam – only valuable information.Subscribe Loading… Thank you!
You have successfully joined our subscriber list.
function ml_webform_success_1709472(){var r=ml_jQuery||jQuery;r(".ml-subscribe-form-1709472 .row-success").show(),r(".ml-subscribe-form-1709472 .row-form").hide()}The post Improve the Performance of Your Website Through Image Optimization [Infographic] appeared first on Bakerview Consulting.
May 12, 2021
The perfect times to post on social media [Infographic]
Welcome Back!
When should you post on social media? Is there a perfect time? Today’s infographic attacks that subject.
Enjoy! Be sure to drop by and read the original post.

I hope you enjoyed this infographic. Please use the share buttons below to share with friends that might benefit from this information. If you haven’t already, please subscribe to my blog using the form below.
Email Address
Subscribe
The post The perfect times to post on social media [Infographic] appeared first on Bakerview Consulting.
May 5, 2021
15 TikTok Tips to Maximize Your Branded Content Efforts [Infographic]
Welcome Back!
Today’s infographic contains tips for those of you who dabble in TikTok. I haven’t made the leap yet, but I’m always curious. Hope this offers some things to think about!
As always, please drop by my favorite blog and read the full blog post.

I hope you enjoyed this infographic. Please use the share buttons below to share with friends that might benefit from this information. If you haven’t already, please subscribe to my blog using the form below.
Email Address
Subscribe
The post 15 TikTok Tips to Maximize Your Branded Content Efforts [Infographic] appeared first on Bakerview Consulting.
April 28, 2021
2021 Video Marketing Insights from Social Media Experts [Infographic]
Welcome Back!
Do you dabble in video marketing? Do you want some ideas on what works and what doesn’t? Today’s infographic offers some ideas from the experts. Hope you gather a few new ideas!
Be sure to drop by my favorite blog and read the full post here.

I hope you enjoyed this infographic. Please use the share buttons below to share with friends that might benefit from this information. If you haven’t already, please subscribe to my blog using the form below.
Email Address
Subscribe
The post 2021 Video Marketing Insights from Social Media Experts [Infographic] appeared first on Bakerview Consulting.
April 21, 2021
A Beginners Guide to a Successful Facebook Advertising Campaign [Infographic]
Welcome back!
Do you struggle with Facebook Advertising? Today’s infographic offers some tips that you can use right away.
Be sure to visit my favorite blog – Social Media Today – to read the full post.
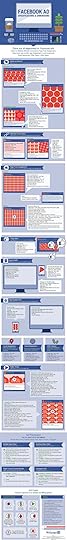
I hope you enjoyed this infographic. Please use the share buttons below to share with friends that might benefit from this information. If you haven’t already, please subscribe to my blog using the form below.
Email Address
Subscribe
The post A Beginners Guide to a Successful Facebook Advertising Campaign [Infographic] appeared first on Bakerview Consulting.


