
Ash Maurya's Blog, page 14
August 23, 2013
Why NOT the Funnel Chart?
Eric Ries describes the three A’s of metrics as: Actionable, Accessible, and Auditable. Today, I’d like to share our take on what it means for metrics to be accessible.

1. Everybody can see what’s going on
The first part is making the metrics dashboard available to everyone (including advisors/investors).
A business should be run as an aquarium where everybody can see what’s going on.
-Jack Stack, The Great Game of Business
2. Can be understood by the entire team
This brings up the second challenge: Ensuring that these metrics are also understood by everyone – not just the technical or marketing folks. For me, the litmus test for that is validating that anyone on the team can quickly look at the metrics dashboard and answer this basic question: “Are we making progress?”.
This was the challenge I imposed on my team when designing the dashboard for our upcoming USERcycle product which makes heavy use of Dave McClure’s Pirate metrics model.

Lets see how we did.
The Funnel ChartThe obvious starting point was using a funnel chart like the one shown below:
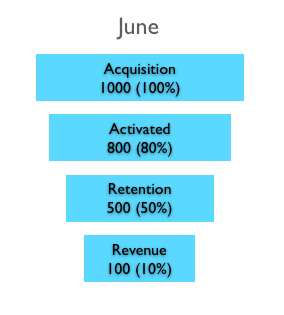
The pros of the funnel chart is that it is simple and visual. Where it fails is when you put two funnels next together.
Quick: In the figure below, did we make progress in the month of June?
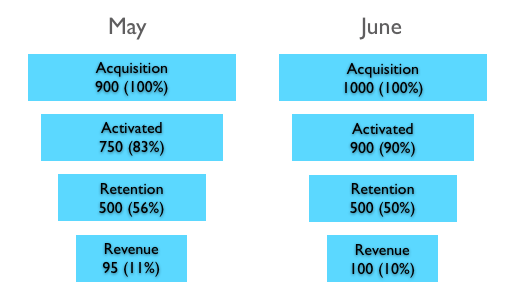
You probably had to carefully study the numbers to make that determination because the visualization itself didn’t answer that question. This was not good enough.
One option was to play with proportional sizing of the funnel.
We could make the funnel proportionally wider:

or proportionally taller:
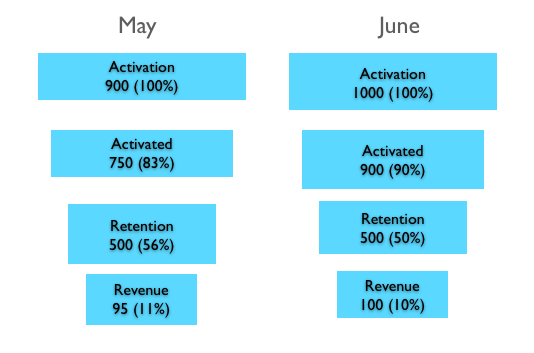
But that actually makes matters worse!
How about traffic light indicators?
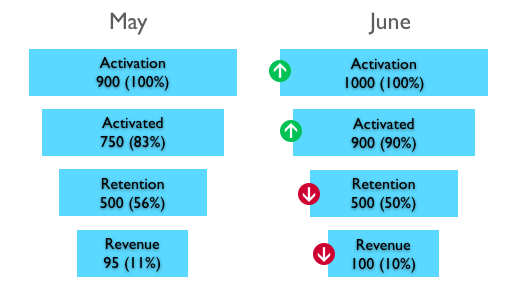
Now we are getting somewhere. But the “funnel” metaphor isn’t really adding anything so why keep it?
Bar Charts Are Even Simpler And BetterIn the version below, we replaced the funnel chart for a much simpler bar chart (and got rid of some spurious information) which makes it easier to compare relative sizes. However, because metrics improvements are typically small, you still need the traffic light indicators.

Could we do better? While this version cleaned up the visualization, it still assumes the reader knows whether a 50% retention rate is good or bad. What if they don’t?
Meet the Bullet GraphWe then ran into the bullet graph developed by Stephen Few which extends the basic bar chart with two powerful embellishments.
The first is it’s use of (color-blind friendly) background fill colors that can be used to encode ranges for bad, satisfactory, and good:

Now anyone could use the dashboard to not only answer if the metrics improved but also whether the current metrics are any good.
The second thing the bullet graph does is use a symbol marker that can be used to encode a comparative measure:
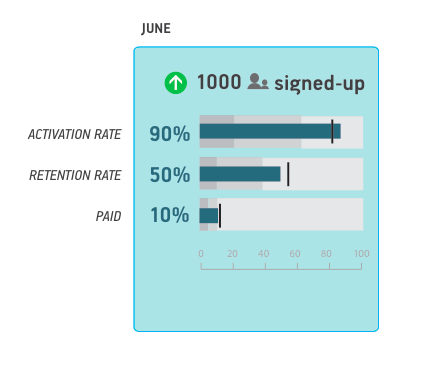
The way we decided to use the symbol marker was to encode the previous month’s values which allowed us to completely eliminate the chart for May as well as get rid of the traffic light indicators.
I’ll admit it might take a little acclimatization but once you’re there you can very quickly tell if the current month’s metrics performed better than last month’s metrics. Plus, it gets rid of a whole lot of ink (pixels) improving the data-to-ink ratio which makes the data visualization geeks happy:
Above all else show the data.
- Edward Tufte
What do you think? Can this be improved even more?


July 23, 2013
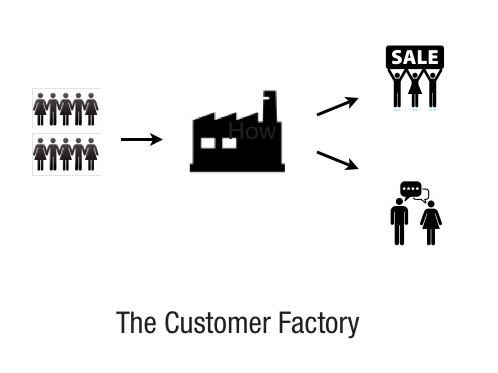
[NEW BOOK] The Customer Factory
Last week I soft-announced a new book I’m working on titled:”The Customer Factory”.

It aims to address the #1 problem in my opinion that trips up most lean practitioners – crafting effective experiments that lead to breakthrough insights.
Even though running experiments is a key activity in a lean startup, I constantly find that entrepreneurs get stuck within their ceilings of achievement.

To find some answers, I first turned to science. I was surprised to learn that running experiments is NOT the most important thing scientists do.
It’s the second most important thing. What do you think is the first?
For a hint: Consider how one of our most celebrated scientists, Albert Einstein, was able to predict the speed of light with uncanny accuracy and manage to overthrow classical Newtonian Physics from his armchair – without running a single experiment.
Scientists first and foremost build models.
They then run experiments to test those models.
Entrepreneurs need models too and yes Lean Canvas is one such model. Lean Canvas helps us deconstruct the complex task of building a business into a simple model that is a good approximation of the problem.
But Lean Canvas isn’t enough. We need another model.
That search led me back to the manufacturing world – specifically in the domain of systems thinking where I revisited Goldratt’s groundbreaking work on “The Theory of Constraints” first described in his business novel: “The Goal”.
The big epiphany for me was realizing that all entrepreneurs are in manufacturing business but what we manufacture isn’t simply restricted to our products.
Entrepreneurs ultimately build systems to manufacture happy customers.
Happy customers get you paid and doing this repeatedly and efficiently at scale is the goal of every startup.
This metaphor stuck and is the basis for the title of the book: “The Customer Factory”. I find the metaphor very effective in driving focus (right action, right time) no matter the stage of the startup.
Like the last book, I started with a few blog posts and shared some of these ideas in my workshops and bootcamps. Encouraged by the initial signals, I decided to undertake writing another book.
Also as with the last book, I am building a new tool to make the principles covered in the book practicable. This is work that started out as Lean Stack but of particular note is the newest member to the stack: “The Lean Dashboard”. This board encapsulates the business model validation process built on systems thinking and experiments:

Note: The tool is ready now for early access use. You can learn more at: http://www.leanstack.com.
Finally, like the last book, I will be releasing the book iteratively and refining it up until launch some time next year. The first chapter is already written and if you’d like to join me in this journey, head on over to: http://runlean.ly/thecustomerfactory.
I gave a 1 hour talk previewing more of the book last week.
You can catch the video below:


June 4, 2013
Don’t Count Your Users Like Sheep
In my last post, I introduced the idea of establishing a standard measure of progress for your products using a handful of macro (versus micro) metrics measured in batches (or cohorts).
Macro metrics are useful for learning or baselining while micro metrics are useful for optimizing or troubleshooting.
The problem with micro metrics is that there’s still a lot of it to wade through. Today, I’d like to share our approach for navigating all this data without drowning in a sea of numbers.
The Traditional Approach: Declarative sub-funnelsThe traditional approach is to organize your micro-metrics into one or more sub-funnels. The basic idea is that users perform a series of steps towards a particular goal (or call to action). And by visualizing the drop-offs between each step you can pinpoint leaky buckets in your funnel.
While seemingly logical, all of this is predicated on the assumption that you can clearly define a series of steps between a starting point A and the goal B.
Back in the early days of analytics software, you had to explicitly declare these funnel steps upfront and code for it. Each time you made even a slight change to your flow, you would have to redeploy new code which was a (re)configuration nightmare.
Newer analytics products solve this problem by allowing you to define your sub-funnels on the fly which is a huge improvement. But you still have to be aware of certain limitations which make it nearly impossible to accurately measure every user in your funnel:
Limitation #1: Users must start the funnel at the beginning or they aren’t countedUsually not a problem if you can ensure that everyone starts at the same starting point. But the real world is full of exceptions. And the exceptions don’t get counted.
Lets look at some simple examples:
1. On a marketing website, you might explicitly separate your landing page from your pricing page so you can track each as a separate step like I often do. But despite my best attempts to shepherd users down this path, thanks to google and people sharing links, visitors don’t always start on my landing page.
2. With a webapp, you might build a wizard to force users down a certain path. First, wizards are not as trendy as they used to be from a UX perspective. But also you might have a non-linear funnel on your hands where there isn’t really a prescriptive series of steps that fits everyone (like filling out a Lean Canvas).
3. Even if you did opt for a wizard, what happens beyond your activation flow when users can truly do anything they want in the app? How do you define the funnel then?
Limitation #2: You can’t have optional stepsSome of the best breakthroughs ideas come from off the beaten path. Allowing users to wander and experiment should be encouraged, not discouraged, and tracked.
Limitation #3: Users must complete the funnel within a set timeframeMany of these newer tools leave you hanging if your funnel extends beyonds 30 days. Declarative funnels work for clearly defined short-lived goals like conversion from landing page to sign-up. But you also need to be able to tie these short-lived sub-funnels to the overall macro (like revenue) which may be several weeks or months down the road.
As an example, not mentioning price on my marketing website might increase short-term sign-ups (Yay!) but reduce end of month paid conversion (Doh!).
You need to measure the whole system end-to-end to not fall prey into micro-optimization (or local maxima) traps.
A Different Approach: Emergent funnelsThe fundamental problem with declarative funnels is that they presuppose we can define funnels upfront and steer our users like sheep which in practice isn’t true.
Rather than declaring funnels upfront, we have been using an emergent approach to measuring our products using USERcycle with great effect which is best illustrated by this story:
A college dean tasked with overseeing construction at a new campus asked the landscapers to only lay out the grass but not any sidewalks. When asked why, he told them to come back in a year and the paths would reveal themselves based on where students had walked.
Sidenote: I remember reading this story in a book but can’t remember which one. I found references online to both UC Irvine and Berkeley. If you know the proper source, please leave a comment below.
Irrespective of whether this story is actually true or an urban legend, this same emergent approach can also be applied to understanding your users. Rather than defining and configuring sub-funnel steps, we only define the macro goals and populate everything in between (the paths) based on what users actually do versus what we think they should do.
Lets take my earlier example on Lean Canvas and focus on the activation sub-funnel. I only need to define what qualifies as activation. For Lean Canvas, we define activation as filling out at least 6 out of the 9 blocks.

We then simply track user actions (events) and visualize what users actually did between sign-up and activation to reveal the emergent funnel. The advantage of this approach is that there is no (re)configuration step ever required – provided you define your activation action correctly (i.e. align it with your application’s key activity). You can endlessly change and optimize what goes in between the two macros and measure progress as a function of either increasing activation rate or decreasing time to activation.
Not all users are created equalOf course, different users will take different paths but this is where things become really interesting. In the screenshot below (click it to expand), you can see that we break this cohort of users into several different sub-populations.

First, we want to see what successful users did versus unsuccessful users. Did they take a particular step like watch an intro video? On the other hand, did unsuccessful users take a particular step that side-tracked them away from the goal?
Next, we want to know what was the most popular success path. You can see that highlighted with a red line in the screenshot above. It’s equally important to study the outlier (less popular) activities. Do they need to be there or are they distractions?
And finally, within the successful user population we want to further sub-segment into fast and slow users shown in the screenshot with the box and whisker chart in the top right. You’ll see from the numbers above that the fast users (1st quartile) complete activation between 2 minutes and 9 minutes. While the slow users complete activation between 7 hours and 5 days. Why such a wide range?
“Happy families are all alike; every unhappy family is unhappy in its own way.”
-Tolstoy, Anna Karenina
To channel Kathy Sierra, it’s your job to take users past your application’s suck threshold and have them start kicking ass as quickly as possible.
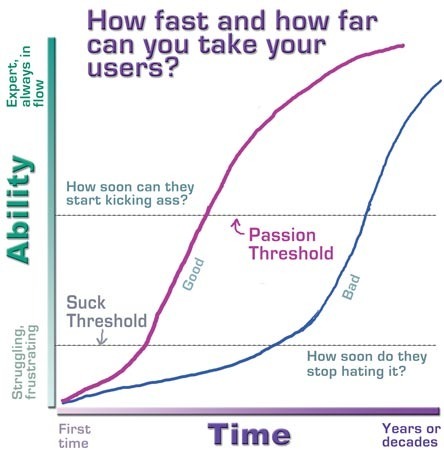
Understanding what your fast users (power users) and slow users do differently is key in making the crossover.
What’s Next?The activation sub-funnel is still a relatively short lifecycle goal. In a future post, I’ll share techniques for navigating even longer lifecycle goals like retention and engagement.
What do you think about using an emergent versus declarative funnel approach?
Leave your comments below.


May 7, 2013
The Groundhog Day Effect
One of the reasons measuring “true progress” in a product is hard is because we prefer reporting good news over bad. We like charts that trend up and to the right, which isn’t all that bad by itself, until we start devising charts that can go nowhere but up and to the right.
In the Lean Startup world, we label those charts as vanity metrics.
But not all charts devised to go up and to the right are bad.
First, in the interest of fairness, there is a place for vanity metrics. It is often used with great effect on marketing websites to build up social proof and ward off competition. You run into problems though when these same metrics are also used as internal measures of progress.

But more importantly, a subtle point that is often missed is that it isn’t the metric itself, but how you measure it, that makes the metric vanity or actionable. For instance, there is nothing inherently wrong with measuring visitors on a site, sign-ups, number of downloads, or revenue.
All these measurements make up the customer funnel and can be helpful to know when troubleshooting a problem area. You run into issues though when you either measure these metrics non-actionably (more on this in a moment), or drown in a sea of micro metrics.
Here are 2 simple approaches to avoid these issues:
1. Measure your metrics in batches so they are actionableThe reason cumulative counts get you into trouble is obvious. It’s because they are numbers that can flatline but never go down. But the reason aggregate metrics get you into trouble isn’t so obvious.
Measuring your users in aggregate is problematic because the customer lifecycle is a long funnel. During that time your product is constantly changing with every feature release and marketing campaign. This makes it hard to derive long term cause and effect which is the goal of gathering actionable metrics.
You need to be able to tie back observed results to specific and repeatable actions.
Building on the Customer Factory metaphor from last time, you can more rigorously derive causality by viewing the output of your long customer funnel in batches. The simplest type of batch is time based.
You group your users into daily, weekly, and monthly cohorts (based on their join date) and then measure every user action (not just retention) within that cohort.
Users that join within the same timeframe experience your product similarly enough which is why they can be grouped together. Together they establish a baseline or benchmark to beat which is uncanny.
Something I call the Groundhog Day Effect.
2. Organize your metrics so you don’t drown in numbersNot all metrics are created equal. It’s important to divide your metrics into macro and micro metrics so you don’t drown in a sea of numbers.
Macro metrics are useful for learning or baselining while micro metrics are useful for optimizing or troubleshooting.
Macro metrics help you build a high-level model of your customer lifecycle which you can use to benchmark your product. I’m a big fan of Dave McClure’s pirate metrics for this. Even though this model came out of the software domain, I find these key macro events are adaptable to a wide range of businesses.

Here is how we apply cohort based measurement with a 3 tiered hierarchical dashboard:
1. Five-up standard measure of progress view
This is our starting point. This view lets us benchmark our product using daily, weekly, monthly cohort groups.

For clarity, here’s how to read these numbers:
“In July 2012, 1852 people signed-up. Of those users, 35% activated, 31% came back after 7 days, 23% referred the product to other people, and 2% upgraded to a paid account as of when this report was generated“.
That last part if key. The actual actions don’t necessarily have to occur within the cohort month (July 2012). For instance, most people might have upgraded 2 months later (in Sept 2012). Unlike aggregate metrics accounting which closes at the reporting window, cohort metrics accounting is organic as long as you have active customers within the cohort.
2. Sub-funnel view
The first view is used to identify the constraint or the key macro metric that matters. Each macro metric is in turn a sequence of micro metrics which you can visualize by drilling in.
Here is what an activation sub-funnel might look like:

3. User activity level view
And finally, you can drill all the way down to the user. This Facebook timeline-like view is particularly useful for better understanding specific user behavior such as when handling customer service requests.

After measuring dozens of products using the five-up view above, I’ve repeatedly seen a flatlining set in once steady traffic kicks in. That’s what I call the Groundhog Day Effect – from the movie Groundhog Day.
In the movie, the protagonist played by Bill Murray, is stuck in a loop where his life repeats itself every single day until he has a breakthrough insight that breaks the loop. If you haven’t watched the original, there are numerous plot remakes that I’m sure you can relate.

Similarly in a startup, once you normalize the data and account for short term seasonality, it’s uncanny how the customer lifecycle repeats itself day in and day out until you reach a breakthrough insight that breaks this loop.
On the one hand, this can be depressing. Because once steady traffic sets in, despite your best efforts, this graph flatlines. No one wants to walk into a meeting with a flatline graph.
On the other hand, this can be highly empowering. Once you have a stable benchmark of your product, it gives you permission to aggressively experiment with bold new ideas to effect a spike in the flatline. If you manage to create a spike, your next course of action is to run more of whatever you did to make the line stick at the higher level.
Your goal is to do everything possible to repeatedly and systematically drive all of these lines up and to the right guilt-free of vanity.
P.S.
In this post, I introduced the most basic type of cohort analysis based on join-dates which serves as a first-line tripwire or canary in the coal mine. For more on cohorts and how to test for repeatability through experiments, check out this short course on actionable metrics. It’s free.


April 18, 2013
Lean Stack 2.0 – The Art of the Scientist and The Customer Factory
Since writing about Lean Stack (our innovation accounting framework), it has been downloaded by thousands of teams and we’ve had first-hand experience (by way of workshops and bootcamps) putting it into practice across hundreds of teams ranging from startups to large enterprises.
I hosted a Google Hangout event yesterday (video below) to share what we learned and to release the next iteration of Lean Stack which will possibly also be released as an online tool.
Here are the major highlights:
SimplificationThe main theme of this iteration was simplification.
Perfection is achieved, not where there is nothing more to add, but when there is nothing left to take away.
- Antoine de Saint-Exupery
We gutted down the current version of Lean Stack and built it back up – ruthlessly removing unneeded complexity.

We ended up with just 2 boards:
Lean Canvas: Captures your long term visionExperiments Board: Serves as your day-to-day tactical dashboardThe Art of the ScientistA big problem I’ve repeatedly encountered is that while the mechanics of running experiments is now better understood, crafting effective experiments that lead to breakthrough insights is still more art than science.
This is an area I’m spending a lot of time on lately and drawing upon metaphors both from science and manufacturing. You saw some of this in my last post. I’m taking a series of new workshops on the road in the coming weeks and months (more details in the video).

The Experiments Board uses a Customer Factory metaphor to highlight macro metrics that matter which I believe greatly helps to bring the right focus to your experiments.
This isn’t just a cute picture. Rather, I believe it opens up the door to a systems approach to building scalable business models. Something I’ll cover in future posts.
Online ToolAnd finally, I shared some screenshots on what an online version of Lean Stack might look like. If you’ve been following the story, you know we opted to use posters as the MVP and keynote/powerpoint templates to avoid building something nobody wants.

There’s been enough customer validation for Lean Stack and some demand for an online tool. We’re starting the vetting process to see if there’s a real business case for an online tool. We are specifically asking ourselves and our customers: “Why Online?”.
I highlighted some reasons why an online version makes sense during the event and would love to get your feedback in the comments section below.
If we build this, I will be looking to repeat history. I posted a call for help getting a quick MVP built for Lean Canvas a couple of years ago. One of the people who answered that call was Lukas Fittl all the way from Vienna. He is now a full-time Spark59er.
If you are interested in taking this on, drop me a note at ash@spark59.com.
(This will be a rails app.)


March 26, 2013
Your Business Model Is a System And Why You Should Care
Lean emerged out of the manufacturing world with a rallying cry for “waste reduction” in the production process. Lean Software drew parallels between hardware and software manufacturing processes and aimed to reduce waste also in the production process.
Then Lean Startup came along and pointed out that efficient production is NOT enough UNLESS it also delivers customer value and emphasized learning OVER production towards that end.
In a startup (or any new product) where you don’t yet know whether what you produce will generate customer value, you are better served by limiting or completely forgoing production (through an MVP or concierge MVP, for example) to first test value creation.
You have to first find a problem worth solving before committing resources to build and scale a solution. This is the essence of what I teach in my bootcamps where I have a “no code rule” and teach how to forgo such production completely until the right time. That said, while I’ve always found this logic highly rational, it’s often a hard pill to swallow for entrepreneurs because we love production and optimization of production processes.
I also couldn’t help feeling that the full impact of all that lean thinking has to offer is left deferred to latter stages when customer value production is in full tilt (after Product/Market Fit).
Then I had an mini-epiphany.
All Entrepreneurs Are in the Manufacturing BusinessIt occurred to me that all entrepreneurs are also in the manufacturing business but what we manufacture isn’t limited to our products.
Entrepreneurs build systems to manufacture happy customers and the business model is a blueprint of that system.
Happy customers get you paid and doing this repeatedly and efficiently at scale (i.e building a business model that works) is the goal of a startup.
The Happy Customer Manufacturing Process
This is a high-level block diagram of the manufacturing process that makes this happen:
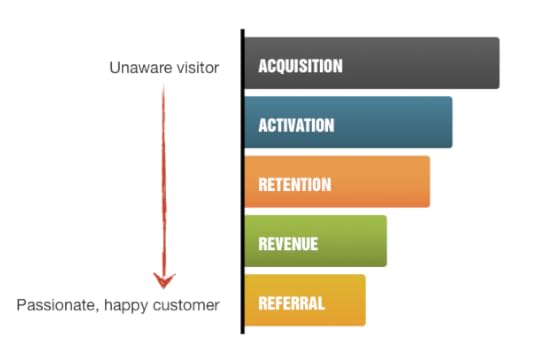
Most of you should recognize this as Dave McClure’s Pirate Metrics. It captures the macro-steps that define the customer lifecycle or funnel.
Your job is to build a system that can repeatedly take unaware visitors as raw materials and convert enough of them into happy customers.
The marketers among you might already see this as obvious since you already think in terms of a funnel. But the manufacturing metaphor opens the door to several lean and systems level thinking which may not be as obvious – such as applying the theory of constraints in concert with the concept of customer pull from lean to avoid pre-mature and local optimization traps.
I’ll get into these latter stage applications in subsequent posts but today I’d like to share how this systems thinking metaphor can be used to tame even the earliest and often fuzziest stage of a product – finding Problem/Solution Fit.

Most learning during the Problem/Solution Fit stage comes through customer interviews. Because this kind of learning is typically qualitative (versus quantitative), it’s often regarded as learning that is “too soft” or “intangible”.
This makes entrepreneurs nervous and skeptical.
Here’s a sampling of questions I often hear:
* How many interviews should I run?
* How should I score interviews?
* How can interviewing just 20 people be statistically significant?
* How do I know when to stop?
* What if I don’t learn anything useful?
Others conflate customer interviews with more traditional customer research and offer prescriptive advice like:
* Don’t lead prospects
* Listen to customers
* Keep clear of cognitive biases like observer, selection, and confirmation biases
* Run surveys and focus groups to collect as much information as possible
The end result: Entrepreneurs view customers interviews as
* DIFFICULT TO DO
* A TIME SINK
* NON-ACTIONABLE
I don’t blame them.
I felt exactly the same way when I started.
Everyone pays lip service to talking to customers but talking alone is not enough. It’s a recipe for amassing tons of (maybe) interesting but otherwise non-actionable information (trivia).
Done correctly though, customer interviews are the fastest way to learn.
But you have to be goal driven.
PRINCIPLE 1:
Problem/Solution Fit is a scaled down version of Product/Market Fit
The goal of the Problem/Solution Fit stage isn’t learning for learning’s sake.
The output isn’t a 100 page customer research report but rather a repeatable system for acquiring and activating “just enough” customers for Stage 2.
In other words, the Problem/Solution Fit stage is fundamentally about building the same repeatable customer funnel only at smaller scale and with different elements:
* using interviews in place of scalable customer acquisition channels
* using a demo in place of a working product for activation
* using appropriate payment commitments in place of actual revenue
* getting permission to follow up (retention), and
* getting referrals to other prospects
The key here (as with any funnel) is repeatability.
Want to sell your solution to doctors? Can you setup and run 5 interviews in a week? Maybe you start by calling close friends for intros. Can you then take the learning from those interviews to line up another 5 (how about 10) interviews the following week? If not, seriously reconsider your channels and maybe even your customer segment.
If you can’t repeatedly activate your target customers at small scale using direct channels and f2f interviews, what makes you think you can do this using indirect or self-serve channels (like the web) at much larger scale?
A lot of people ask me how long Problem/Solution Fit takes because they can’t wait to be done with customer interviewing. I have to burst their bubble by telling them that building a continuous customer feedback loop never really ends. Sure some of the tactics evolve for scale but the process doesn’t get easier.
PRINCIPLE 2:
Always focus on the macro (aka don’t miss the forest for the trees)
Lean is about measuring what customers do, not what they say they’ll do.
Customer actions are the only macro metrics that matter.
Everything else is a means to that end (a sub-funnel made up of micro metrics).
At the macro level, the interview is a black box designed to convert prospects into customers.
What goes into it is irrelevant provided you stay focused on the macro and don’t fall into the local optimization trap.
For example, it is tempting to use aggressive discounting or give away your product to get early customers only to find out later that they weren’t the right customers. You always have to view the system as a long funnel.
On a more practical level though, what goes into the interview black box does matter. In my book, I describe a rather prescriptive structure to these interviews. This structure was built through field-testing hundreds of customer interviews and it was designed to maximize on speed/learning as measured by moving prospects down the funnel.
That said, my structure is only as prescriptive as any other best-practice, like say for example, building an effective landing page. We know the use of elements like headlines, social-proof, etc. work, but people still deviate from these guidelines all the time – as they should (I do too).
At the end of the day, use the structure that repeatedly delivers on your macro metric.
People also tend to over-think the “purity” of their interviewing process and liken it more to 3rd party research. In my book (pun not intended), Customer Interviews are NOT the same as Customer Research.
Each has a different goal:
* Customer Research is for hypotheses generation, while
* Customer Interviews is for hypotheses validation.
We all have some level of cognitive biases but it’s not as bad as it’s worked out to be. In fact, in certain instances it’s even helpful or required.
Let’s look at how working business models look like at scale.
You build a direct sales force because your customers prefer to buy from humans. This is required observer-effect at play.You build dozens of landing pages and corresponding campaigns to deeply segment your customers. This is selection-bias at work.Sure there is always the danger of your biases leading you down the wrong way. For example, a series of confirmation biases can make you believe you have a killer product on your hands because you selected a subset of the data that supports this.
All data in aggregate is “crap”.
- Avinash Kaushik
There is nothing wrong with this provided the subset shares a common pattern that isn’t shared with the others – maybe you are honing in on a more narrow definition of your early adopter. Can you identify this common pattern and then repeat the observed effect at will?
Sure when dealing with any bias, you have to be cautious, but I don’t believe the solution is avoiding bias all together. But rather testing them through multi-faceted exploration (e.g. subtle 5 Whys during the interview) and ultimately measuring the macro.
It is better to be specific and wrong than vague and right.
PRINCIPLE 3:
You are done when you can demonstrate a 90% confidence interval
There is a great book by Douglas Hubbard titled: “How to Measure Anything” where he shows you how to measure things that are seemingly intangible or uncertain by first framing it around more tangible ranges and then applying a 90% confidence interval test.
Yes, customer interviews are qualitative and learning can seem intangible but when you frame it around the macro goal, it all becomes very measurable.
You start the interviewing process by casting a wide net of potential customers. Your initial interviews may result in a 20% success rate. Over time, as you refine both your early adopter definition and problem understanding you should yield higher success rates.
This learning is subsequently used to create a compelling offer made up of your solution (demo), unique value proposition, and pricing (Solution Interview). This is where the rubber hits the road.
When you can repeatedly convert qualified prospects into customers with a 90% confidence interval, you have achieved Problem/Solution Fit and are ready to move on to stage 2.
For my latest product, USERcycle, I interviewed close to a hundred companies ranging from pre-launch to enterprise software companies (casting a wide net). Through these interviews, I honed in on my early adopters as SaaS companies with some early traction. I then crafted 3 qualifying questions to identify these early adopters and built a specific offer for them (demo + starting price).
I knew I had reached Problem/Solution fit when I could with near certainty predict, from just the answers to those 3 questions, whether the prospect would agree to the interview, find the demo compelling, and sign-up to a $200/mo starting plan.
What’s NextI found thinking of the business model as a system and the manufacturing metaphor particularly empowering for visualizing the 3 staged journey of startups.
What did you think? I’ve got more actionable doodling like this one in the works…


March 19, 2013
Lean Analytics – The One Metric That Matters And Other Provocations
I recently caught up with Ben Yoskovitz who co-authored Lean Analytics with Alistair Croll. In today’s world where we can measure almost anything we often end up drowning in a sea of numbers.
Like Ben and Alistair, I too share the general tenant around “One Metric That Matters”. The hard part is knowing which key metric to focus on.
Ben and Allistair do a great job of answering this question in their book – broken by business model and stage of the product. They back their models up using numerous case-studies which make these concepts stick.
It was unfortunate that we couldn’t record this exchange. Actionable Metrics (and the more general topic of Innovation Accounting) is an area I’ve been spending a lot of time on lately. So I was really looking forward to this book and this conversation. I’m sure it will be the first of many…
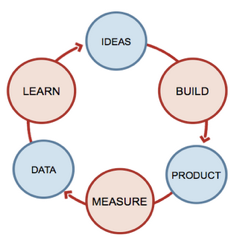
Ben: Lean Analytics is about measuring progress through the Lean Startup process of Build -> Measure -> Learn.
Generally, I’d say people are good at the build part–they have an idea, they build something and then try to test it in the market. But it’s at this point where many people struggle.
* What should they measure?
* How should they measure?
* Why?
So I see Lean Analytics–the concept and the book–as a way of blowing out and digging into the “measure and learn” aspects of Lean Startup.
2. In your book, there is a central theme around “One Metric That Matters” (OMTM).Can you describe what that means?
Ben: The One Metric That Matters is all about finding the right thing to track at the right time, based on the type of business you’re in and the stage you’re at. It’s meant to be used literally and conceptually. In the literal sense, you should really only focus on one key metric at any given time. That metric will change over time, and you may only focus on it for a short period of time, but try and stick to one. You may have a number of metrics that bubble into the One Metric That Matters.

For example, SEOmoz tracks a whole bunch of things–but really what they care about is Net Adds (# of new paying subscribers – # of paying subscribers that drop to a free version or leave / day). That one number is a great barometer for how their business is doing. If the number starts to drop, they can dig into it further–and that’s where they may need secondary metrics. Maybe customer complaints have risen and that would be an indicator as to why Net Adds are dropping. Maybe a marketing campaign hasn’t performed as well as they thought, or there was downtime on their website so new people couldn’t sign up. You have to track all of those things, but at the end of the day, what you start with and focus on, almost exclusively, is a single metric. For SEOmoz that’s Net Adds.
At a conceptual level, the goal of One Metric That Matters is to help create and encourage focus. Maybe you can’t bring yourself to pick a single number, but at least reduce the number of key performance indicators (KPIs) that you’re watching. It’s also designed to create accountability and cohesion within an organization. If everyone is focused on improving one thing it can drive a lot of internal engagement and motivation. You can better instill a culture of experimentation and align everyone on succeeding.
3. So that begs the next question: How do you determine the one metric that matters?I know part of the answer depends on your business model and stage of your product. In your book you cover 6 basic types of business models and provide actionable advice, packed with real world case-studies, for picking that one metric that matters for your model.
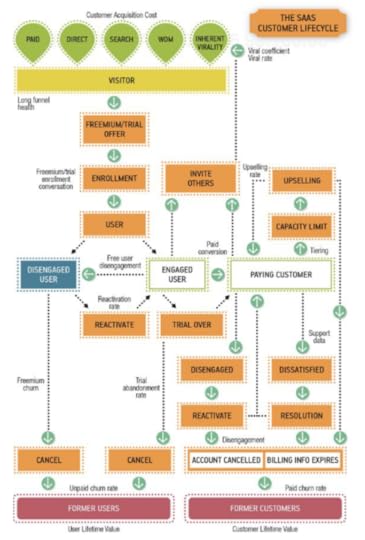
Can you focus on one of those business models, say Software-as-a-Service, and give us a feel for how we determine that one metric that matters?
In SaaS there is an almost obsessive infatuation with churn rates.
“Churn is the percentage of people that abandon your service over time.”
Would you say that churn is the one metric that matters for SaaS?
Ben: Churn matters for sure. You can’t scale a SaaS business without having a low churn (and the benchmark, incidentally that we’ve seen is ~2%/month) because you’ll keep putting people in the top of the funnel and they’ll just spill out the other end. But churn only really matters when you’re starting to focus on scale. Earlier in a SaaS business you care about other things.
In Lean Analytics we propose 5 stages that companies go through: Empathy, Stickiness, Virality, Revenue and Scale.

These align fairly well with other models including Dave McClure’s Pirate Metrics, Lean Canvas, and Eric Ries’ Engines of Growth. At the earliest stage, Empathy, you’re looking for a problem worth solving and the One Metric That Matters is really about the pain your prospects are feeling. It’s very qualitative. During the Empathy phase, you may also help validate what you’re doing by putting up a website and seeing if people sign up. Can you get anyone to your site and demonstrating interest? So a simple conversion metric might be your One Metric That Matters, albeit for a short period of time, just to get enough people into the process. We get into more specific numbers at the next stage when we look at Stickiness.
Now you’re building an MVP and testing it in the market. Churn doesn’t matter yet, because you don’t really have any customers. What matters is engagement (followed by retention). For a SaaS business, the engagement metric could vary, it depends on whether you’ve built an application that’s meant to be used daily or at some other time interval. Let’s say you’ve built something that’s meant to be used daily–then Percent Daily Active Users is your One Metric That Matters. You’re trying to answer the question: Are people using my application regularly enough and deriving enough value from it?
Once you have a solid base of early adopters using your product consistently, you move to the Virality stage where you’re looking at how to bring more people into the top of the funnel. You may be tracking churn at this point, but unless it’s insanely high you still don’t need to optimize for it. Virality comes in a few flavors–it may be inherently built into the product (e.g. a project management tool that has an invite system, and becomes more valuable with more users) or artificial (e.g. encouraging people to promote your application in exchange for something). Word-of-mouth is a factor here as well. The One Metric That Matters could be viral coefficient, although this depends a great deal on the application itself. Some applications are viral, some are not. The Virality stage is also about general customer acquisition–can you grow the top of the funnel a bit more, now that you know what percentage of people will convert into users, and what percentage will become active.
The Revenue stage is when you focus on building a sustainable business model. There are numerous ways to make money from a SaaS application, so there’s no one absolute OMTM. For example, if you’re using a freemium model you’ll look at conversions from free to paid. It’s really at this stage that churn becomes a factor. You might be converting a good percentage of users into paying customers but if churn is too high you don’t have a sustainable business and can’t really move to the Scale stage (where you expand sales channels, think about APIs and increased distribution, fund growth and know that the business model makes sense).
This is one of the more popular Lean Startup battle cries. But it’s predicated on measuring the right things, or we all just drown in numbers.
You end your book on a rather philosophical note by Lloyd S. Nelson:
“The most important figures that one needs for management are unknown or unknowable, but successful management must nevertheless take account of them.”
How does one go about accounting for these unknowable unknowns?
Ben: This is the paradox of analytics. It’s all about the details, but if you don’t know what details matter, what are you supposed to do? We tried very hard in Lean Analytics to shed some light on the details (what you should track, when, how, why) but at the same time we were careful to not be overly prescriptive. There’s a risk with Lean Startup where people believe they can just follow a process blindly and win. That’s not how it works. There are too many variables. There’s no formula for success and I would never propose that Lean Analytics provides a formula. I like to think of Lean Analytics as a tool to poke a very large (and perhaps painful!) hole in an entrepreneur’s reality distortion field, in an attempt to help them succeed as opposed to crashing horribly.

Entrepreneurs have to keep an open mind, remain agile, and adapt. They have to handle all sorts of craziness, but with an intellectually honest approach, using validated learning (on-the-fly!) instead of blindly wandering through the desert.
At a more specific level what I think this comes down to is this: measure everything but focus on one thing at a time. And use an exploratory approach, every so often, to dig into your data to solve the key problems you have. Think of yourself as a detective and problem solver, and you’re using data to find the answers. We have a great example in the book of how Mike Greenfield did this with his startup, Circle of Friends. The company had 10M users in 2007-2008 leveraging the Facebook platform (Circle of Friends was like Google Circles but on Facebook). The problem was engagement; too few people were using Circle of Friends actively enough. So Mike started digging into his data and found a market segment (in this cases moms) that were insanely active. Every minute metric (e.g. length of message, # of responses, # of photo uploads, etc.) was off-the-charts compared to the rest of the users. So Mike pivoted and Circle of Friends became Circle of Moms. Mike saw a problem (engagement) and went looking for a solution in his data. He had an “unknown unknown” that gave him the necessary insight on what to do next (pivot from a generic solution to a targeted one). Mike ended up with a smaller user base, but one that was incredibly engaged, which was necessary for him to scale the business and eventually exit.
Lean Analytics
By Alistair Croll, Benjamin Yoskovitz
Use Data to Build a Better Startup Faster


The Attack of the Lean Books
I read a lot of books – averaging 5/month. For right or (most likely) wrong, I don’t read any fiction. I get my fiction fix through other mediums.
I usually pick-up/download a book to gain perspective on solving a current technical or business problem. In that way, I am a very deliberate reader. I don’t skip around and read every word (unless the book turns into a total dud) while internalizing how to put these ideas to practice.
Books can give you a good education but true learning comes through practice.
My reading list recently has included all the new lean series of books out this year – and yes there’s a lot.
Lean Analytics
By Alistair Croll, Benjamin Yoskovitz
Use Data to Build a Better Startup Faster
Lean UX
By Jeff Gothelf with Josh Seiden
Applying Lean Principles to Improve User Experience
January 21, 2013
The Ideation Switch
(This is a guest post by Lukas Fittl – a fellow Lean practitioner and Spark59er.)
Enjoy…
-Ash)
Imagine the following situation: You are in the office working on the next release of your software product. Suddenly your co-founder storms in and starts talking about the excellent new idea he just had.
You end up in a long discussion about the future of the company, only to resume work on the old release. You feel exhausted, not motivated and are happy when you finally leave the office.
That story is a symptom of a larger problem – we question what we are doing, whilst we are doing it. In my own experience this has lead to a lot of time wasted, motivation issues and the company running out of money because we kept the same strategy over years (even though we knew better).
Our inability to decide on executing one specific strategy resulted in procrastination, doing irrelevant work, or just having endless brainstorming meetings without ever taking action. I’ve come to believe, that in order to achieve flow in startup and get the business going, you need to keep the time your team spends on alternative directions to a minimum.
That means, either focus on one direction and execute, or discuss alternatives and make a decision as fast as possible. This difference is best described as The Ideation Switch – making a conscious decision between Ideation and Execution:

Ideation is fundamentally different from Execution – we should choose our goals and work processes accordingly.
Ideation is about finding (any) interesting signals in chaos, close to customers and the market. During this time you’d run customer interviews, usability tests, investigate different business models and even look at what the competition is doing.
During Execution you have a clear goal of what you want to achieve – and work obsessively towards it, ideally without much distraction. In the Lean Startup sense, this is where Build-Measure-Learn happens, and where you test your hypothesis and run experiments.
You have assumptions both during Ideation and Execution, but they are tested quite loosely and rapidly in Ideation (a couple of interviews can invalidate a strategy) versus being tested thorough in Execution, based on customer data or previous experience.
Now, the biggest risk we have as a startup, is if we spend too much time on either of these, without giving room to the other.
When to Execute & When to IdeateIf we spend too much time Ideating, we end up in analysis paralysis, never focusing on one idea and one strategy to actually do it.
If we spend too much time Executing, we end up in a local maxima, with modest growth and not much potential for actual new innovation. We also run at risk of building something no customer really wants – them saying “nice product”, but not enough actually engaging and using it.
We therefore need to reduce scope by putting both Ideation and Execution into a timebox. This could mean we spend 2 weeks on Ideation through customer interviews, then 3 weeks on Execution and actually building an MVP.

Examples of this: Product Design Sprint @ Google Ventures, Meetup.com, etc
How to Structure IdeationIdeation consists of two parts: Collecting new data from actual customers by “getting out of the building”, and then analysing that data to gain insights and zoom into one direction to pursue. For collecting new data you intentionally want to open your worldview to diverging, new perspectives – something that is easiest in the beginning, but gets much harder for established businesses.
You can structure Ideation intro three main stages:

You might recognise these from the book Gamestorming, or the similarities with the Design Thinking process.
Tools & Techniques for Ideation
Customer Interviews: Setup a 30 minute interview session with an actual customer and determine what their job-to-be-done is (look for frustration with status quo & other strong reactions), and whether they are actively looking for a better solutionBusiness Modelling: Model the essential aspects of your business on the Business Model Canvas, and explore alternatives by just leaving one of the post-its on the canvas. Use with a timer (e.g. 15min) and quick iterations.Card Sorting: Have your users sort index cards (e.g. navigation items of your website, feature ideas, etc) into categories, this helps you understand in which groups/patterns they thinkPersonas: Summary of who your user is and what their goals are.Design Studio: Collaboration tool to evaluate ideas and prototypes as a group, see also the TLC Labs blog posts.Many others: Rapid Prototyping, KJ technique, Mental Models, Customer Journey Maps, empathy maps, behavioural variables & many more in the 500startups Lean UX Bootcamp slidesIf you’d like to learn in more detail how design techniques can be applied to startups, take a look at this Case Study by Mike Krieger from Instagram:
- Mike Krieger @ Warmgun Conference 2012, Talk starts at 22:00
Stop Wasting Your Time
I’ve seen too many companies that still had 6+ months runway burst up in flames because they didn’t actually try any of the options at their disposal, but rather ended up in endless brainstorming meetings, and working on things they didn’t believe in anymore.
This explicit separation and the tools introduced above have helped me avoid that state and move towards a working business faster. To reiterate, do not Ideate and Execute at the same time, it only leads to indecision and procrastination.
Get started today by:
Understand what you are trying to do: If you are doing customer development right now, focus on just that, and do it in the next 2 weeks instead of 2 monthsDon’t share new exciting ideas 24/7 with the team: We love to do it, but this can be confusing for the team members, especially when you have misunderstanding between business/marketing and techSet a specific time for Ideation: Start with timeboxing your teams divergent thoughts into a 2-3 hour meeting, expand this over time into 1-2 days and include actual customers into the processBe conscious of why you are (un)productive: If we put the wrong constraints & goals into place we’ll just keep procrastinating. Try to reflect on your own productivity and understand the root cause, don’t try to beat it with sheer willpower.I’d love to hear about your experience – share your thoughts & comments on Twitter.


January 1, 2013
Lessons Learned in 2012
I love this time of the year.
Everyone is upbeat around the holidays. The pace is slower. It gives me time to reflect.
In the 3 short years since I started this blog, a lot has changed in my life. I just got back from a short trip to Japan (too short) for the book launch of the Japanese translation of Running Lean. Other translations into Korean, Mandarin, French, and possibly Spanish, Dutch, and Vietnamese are also in the works.
For me, this has been a rather unexpected (and welcome) ride which started right here on this blog with my first post back in October 2009 titled: “How I learnt to grok Customer Development”.
I started this blog simply because I had more questions than answers. Now I am running workshops around the world, advising and coaching teams, and running a new company with a great team of fellow lean practitioners.
First, thank you all for your continued support along the way…
Here are some of my biggest lessons learned in 2012.
Connecting The DotsOne of the questions I get a lot is: “So what do you do now?”.
Saying I’m an author/speaker/consultant is the easiest answer but I don’t identify with any of those labels. I generally have an aversion to labels. “Practicing entrepreneur” would probably be the closest.
I still love getting my hands dirty building products and I have my hands in a lot of things – bootcamps, workshops, Lean Canvas, USERcycle, Lean Stack.
Some say too many.
My friend, Noah Kagan, has been pushing me to kill off all my projects but one. To which I used to meekly respond: “but they are all somehow connected”. I believe it’s critical to cast a wider net at the outset in search of value for the right problems and customers.
But he did have a point.
Value creation does not scale by itself. At some point, you have to converge to a narrower customer/problem space and shift into systems thinking and optimization. Knowing when to shift from search to optimization is fuzzy.
Noah felt I had enough going to make the shift around a single “product”.
I felt I needed more.
I’ve spent the last year thinking about this deeply. I think there is an “Integrated Product Suite” argument to be made for a multi-product strategy (even for a startup) where the sum of the parts is truly greater than the whole.
The classic example is Apple.
The iPhone, iPad, Macbooks are each solid stand-alone products but the experience is orders of magnitude better when you pair them together.
That said, this isn’t a cop out to pursue multiple products just to feed my creative addiction. I don’t have the resources of Apple and the last thing I want to be is distracted with non-additive busy work.
For the integrated product suite to work, the following has to hold true:
Each product has to fit within a larger customer lifecycleIt goes without saying that each product has to meet certain success metrics to justify it’s existence. But the power of the integrated product suite is only realized when each product also naturally fits into a larger customer lifecycle. Once you understand and baseline this larger funnel, prioritization of products becomes clearer.
Each product is cut from the same business model canvas blueprintFor the integrated product suite to work, each product needs to serve the same overarching customers and set of problems. They need to serve the same business model canvas with lots of overlap and a customer journey story that weaves the products (solutions) together.
The integrated product suite is emergent versus deliberateIt’s hard enough trying to deliberately create one successful product. I believe these secondary products emerge as by-products while in pursuit of deeper customer/problem understanding. In the last couple of years, I’ve created lots of quick and dirty MVPs. The ones that initially stuck, got turned into products for further value testing. Of those, the ones that could be weaved into a customer journey story made it into the product suite. All others were eliminated.
Building a Solid FoundationWork happens either inside the building or outside the building. Both are required. But you can’t be in two places at once.
While you can start out solo, at some point you need help to scale.
I wrote two posts describing each of these stages:
1. Achieving Flow in a Lean Startup
2. Scaling Flow in a Lean Startup
Since then, the Spark59 team has grown from 1 to 3.5 core resources plus 3 additional non-core resources.
Here are some lessons learned from hiring and growing a core team:
Hire for passion for the problem (not just for the solution)In my last company, I hired specialists to outsource building and non-core activities. In this company, I am hiring learners with passion for the overarching problem. Sounds like common sense but I stumbled into this one accidentally.
While I was experimenting with Lean Canvas back in 2010, I needed help creating an online MVP. I was too busy to hire and direct a freelancer so I put a call for help on my blog. A number of entrepreneurs responded.
Despite the fact that all of them were busy with their own startups, the level of conversation and productivity was unlike anything I had previously experienced. They all had the necessary problem context, were self-directed, and driven to learn. The results from that 2 week project was so addicting that I continued working with a number of them on a freelancer basis and that became my model for growing the team.
Finding the right team takes timeThe obvious challenge with this approach is that everyone had their own startup – their own primary project which was their #1 priority.
This approach was like trying to date people already in a committed relationship.
Not everyone made the jump. The typical jump time for those that did was at least 6 months. But I wouldn’t do it any other way. There is no substitute for determining fit than time.
Building a core team requires lots of patienceEven after the jump, setting up the right systems and culture takes lots of daily commitment. My vision is one of creating a learning organization that is modeled more like a martial arts dojo than a typical company. Everyone is a practitioner in-training.
The first challenge for a new hire is shedding off their years of specialization bias and learning to think more empirically.
In the beginner’s mind there are many possibilities, in the expert’s mind there are few.
- Shunryu Suzuki, Zen Mind, Beginner’s Mind
For instance,
- Developers typically suggest solving problems with more code.
- Designers typically suggest solving problems with better ux.
- Marketers typically suggest solving problems with better copy.
It is natural for us to approach problems with this specialization bias. That is what we are good at. What we’ve been trained to do. But without the right evidence-based focus, despite our best intentions, building alone will often yield waste.
The Overarching Theme

This last year has really been a search for an overarching theme that collapses all my different products into a single product – Spark59.
At the highest level, there is just one customer / one problem, and a set of solutions that work either stand-alone but are more effective when used together.
The vision for Spark59 is best captured by this manifesto I shared in an earlier post.

The overarching theme that unifies the various products is “Innovation Accounting”. This is a term Eric Ries first introduced in his book: “The Lean Startup” and one that I find quite fitting.
Here is my paraphrasing of the term:
Innovation Accounting helps entrepreneurs define, measure, and communicate progress with their internal and external stakeholders.
I’ll have a lot more to share around this topic in the new year.
Here are some highlights:
- How to generate the right hypotheses to test
- How to scale experiments in a team
- How to measure without drowning in a sea of numbers
- How to learn from every experiment – especially those that fail
- and lots more…
To get a jump start on some of these ideas, you can grab a FREE 5-part course I just finished creating.
That’s all I have for now. I look forward to continuing the conversation in the new year.
Here’s to your success in 2013!
- Ash
P.S. I also got hit by a bug during the holidays for writing another book.
We’ll see if it lasts.


