
Menzie David Chinn's Blog, page 48
November 24, 2014
Downgraded: The Macro Outlook in Wisconsin
The Department of Revenue’s Wisconsin Economic Outlook, released last week, details a noticeable deterioration in forecast performance, in just the eight months.

Figure 1: Real personal income (bn Ch.09$, SAAR) (thick blue, thick red), and forecast from March 2014 (Winter 2014 issue) (light blue), and November 2014 (Fall 2014 issue) (light red). Source: Wisconsin Economic Outlook, Winter 2014 and issues.
2014Q1 personal income was 1% less (in log terms) than the March 2014 forecast. The forecast for 2014Q2 was revised downward by 1.1%.
The mark down in prospects makes sense once one sees the trajectory of Wisconsin economic activity, as measured by the Philadelphia Fed’s coincident indices (October figures released today):
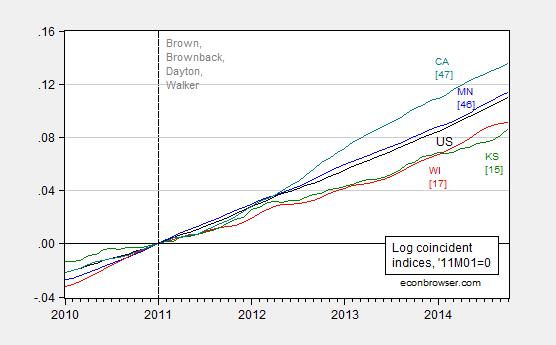
Figure 2: Log coincident indices for Minnesota (blue), Wisconsin (red), Kansas (green), California (teal), and United States (black), all normalized to 2011M01=0. Vertical dashed line at beginning of Brown, Brownback, Dayton and Walker administrations. Source: Philadelphia Fed, and author’s calculations.
According to this measure, the cumulative growth gap between Wisconsin and the US (and Minnesota) is again widening.
The ramifications of the downgrade in economic outlook are clear. From Wisconsin Budget Blog:
State officials confirmed today what we have feared for many months – that Wisconsin’s spending needs in the next biennium far exceed the projected revenue, and the state must also close a very substantial budget hole in the current fiscal year. As a result, lawmakers are likely to make cuts that have harmful consequences for Wisconsin children and families and for the investments needed to keep Wisconsin economically competitive.
Despite the assurances of Walker administration officials over the last couple of months that the state is in strong fiscal shape, the figures contained in a report released by the Department of Administration (DOA) today confirm that balancing the state budget in 2015-17 will require very deep spending cuts or significant tax increases. Specifically, the DOA document reveals the following:
Tax revenue for the current fiscal year is now expected to be $82 million below the amount estimated in May (on top of a $281 million tax shortfall in the first half of the biennium), and net appropriations are estimated to be $43 million less.
The state is on track to have a “net balance” of -$197 million at the end of this biennium, which means that significant cuts or transfers will have to be made to get the budget back into balance by June 2015 (and to preserve a required $65 million budget balance).
The agency budget requests, which generally followed the Governor’s instructions for just maintaining existing programs, exceed the anticipated General Purpose Revenue (GPR) by $2.2 billion during the 2015-15 biennium (assuming the state does carry over a $65 million balance).
The total gap between requested GPR spending and anticipated revenue is about $2.4 billion between now and June 2017, and that doesn’t account for various spending needs that are calculated later in the process (e.g., increases for debt service, state employee compensation and benefits, UW faculty pay adjustments, and a potential gap in funding for the Earned Income Tax Credit).
It is interesting to observe the sources of this shortfall. Most of it was not a failure in forecasting; rather it’s mostly due to the decision to cut taxes, and the refusal to take Federal funds associated with Medicare expansion.


November 23, 2014
Lower oil prices and the U.S. economy
For the last 4 years, the national average retail price of gasoline in the United States stayed within a range of $3.25-$4.00 a gallon. But that all changed this fall, with U.S. consumers now paying an average price of $2.82.
New Jersey Historical Gas Price Charts Provided by GasBuddy.com
This usually is the time of year when gasoline prices tend to be at their lowest. But the current U.S. price of gasoline is exactly what we’d predict given the long-run relation between the price of gasoline and crude oil. There’s essentially no seasonal component in the price of crude. In other words, if crude stays at its current value (namely, Brent at $80), the lower price of gasoline is here to stay.
The current price of gasoline is 80 cents/gallon below what it has averaged over the last 3 years. Last year Americans consumed 135 billion gallons of gasoline. That means that if prices stay where they are, consumers will have an extra $108 billion each year to spend on other things. And if the historical pattern holds, spend it they will.
Lower gasoline prices likely also contributed to the recent rise in consumer sentiment. Historically a 20% drop in energy prices would predict a 15-point rise in consumer sentiment. That relation weakened considerably as consumers got accustomed to the up-and-down yo-yo of prices in recent years. Nonetheless, consumer sentiment is now at the highest level it’s been since the Great Recession.
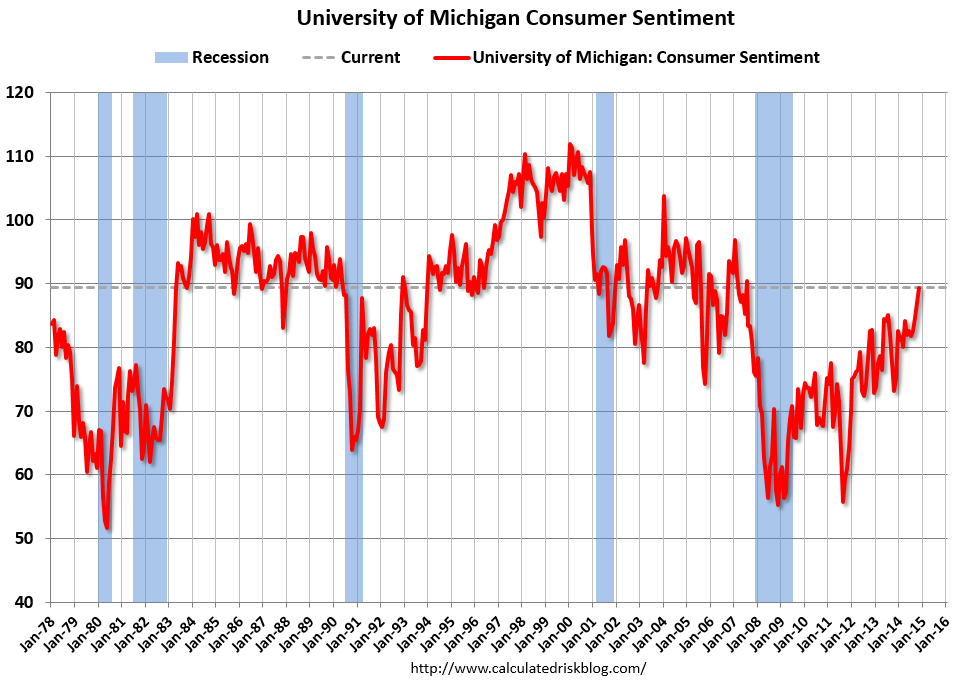
Source: Calculated Risk.
But another thing that’s changed is that much more of the oil we consume is now being produced right here at home. While lower prices are a boon for consumers, they pose a potential threat to producers, especially the higher-cost operators. Jim Brown reports that “the most recent companies to announce capex cuts are Exxon, Shell, Conoco, Continental Resources, Apache, Energy XXI and Hess.”
If there are employment cuts in places like Texas, Louisiana, and North Dakota, that would obviously offset some of the gains to consumers noted above, and ultimately undercut the major force keeping the price of crude low for the time being, that being the success of small U.S. oil producers.
Nevertheless, there should be no question that at this point this is a favorable development on-balance for the U.S. economy. We’re still importing 5 million more barrels each day of petroleum and products than we are exporting. Importing fewer barrels, and paying less for the barrels we do import, is a good thing.
November 22, 2014
What have the nonpartisan research agencies ever done for us?
(For the youth of today, here is the reference.)
I see Americans for Tax Reform is against reappointment of Doug Elmendorf as CBO head. It is a remarkable document, insofar as it is so full of factual errors that the head spins. Montgomery at WaPo provides a point-by-point rebuttal of each of Grover Norquist’s assertions. Here’s a debunking of one of the most hysterical assertions:
…the agency promotes a “Failed Keynesian Economic Analysis,” Norquist says, that asserts that “higher taxes are good for the economy, even to the point of implying that growth is maximized when tax rates are 100 percent.”
Did the CBO really say that a 100 percent tax rate would be good for the economy? As evidence, Norquist points to a 2010 post by the Cato Institute’s Dan Mitchell, titled “Congressional Budget Office Says We Can Maximize Long-Run Economic Output with 100 Percent Tax Rates.”
“I hope the title of this post is an exaggeration,” Mitchell writes, “but it’s certainly a logical conclusion based on” CBO’s claim that paying down the national debt — regardless of whether it’s through higher taxes or lower government spending — would be a good thing for the economy.
In other words, Norquist can’t be bothered to critique an actual CBO document — he relies on a paranoid fantasy of a CBO analysis.
My guess is that Mr. Norquist would want all tax provisions dynamically scored. I discuss an instance of CBO dynamic scoring of President Bush’s budget in this post. In that instance, dynamic scoring did not result in large differences. However, if dynamic scoring were to be applied to tax provisions, then I would say at a minimum, spending provisions should be also scored. Auerbach cites one criticism of only dynamically scoring revenues thus:
Dynamic effects of revenue legislation would come not only through supply-side incentive
effects, but also through budgetary effects. For example, tax cuts that encourage economic
activity could still have negative macroeconomic effects through the crowding out of capital
formation. Thus, all revenue provisions, not just those with significant incentive effects, would
need to be evaluated. The same argument applies to changes on the expenditure side.
My additional guesses are that (1) Mr. Norquist would not be amenable to scoring spending provisions such as investment in infrastructure, education, R&D in renewable energy, etc., and (2) would welcome dynamic scoring à la the Heritage Foundation’s Center for Data Analysis. See examples of their approach [1], [2], and [3]. For a discussion of the challenges in implementing dynamic scoring correctly (i.e., not in the Heritage Foundation CDA style), see here.
Some Observations on the Wisconsin Employment Outlook
The Walker Administration’s Economic Outlook forecasts private employment in January 2015 will be 115 thousand below the goal set forth by Governor Walker in August 2013. Wisconsin nonfarm payroll employment will not reattain prior peak levels until 2015Q2.
Figure 1 depicts how far employment is lagging Walker’s pledge, even by the Administration’s forecast.
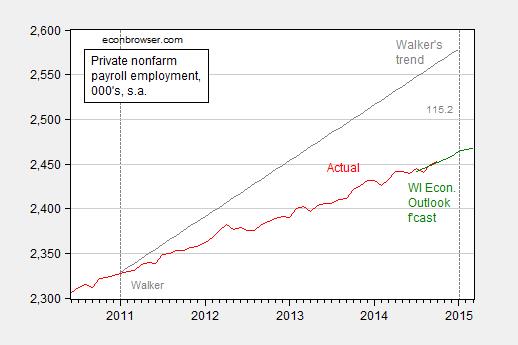
Figure 1: Private nonfarm payroll employment (red), forecast from November 2014 Wisconsin Economic Outlook, quadratic match interpolation (green), trend consistent with Governor Walker’s August 2013 pledge to create 250,000 net new private sector jobs (gray). Source: BLS, Wisconin Economic Outlook (November 2014), Milwaukee Journal Sentinel (August 2013), and author’s calculations.
The Wisconsin Economic Outlook also details the fact that nonfarm payroll employment growth will decelerate, not exceeding the 2008Q1 peak (the forecast is on a quarterly basis) until 2015Q2. Figure 2 compares US (and Minnesota) performance against Wisconsin’s; all employment series are normalized to 2008Q1.
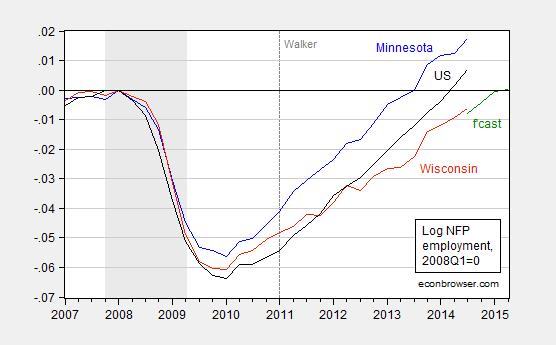
Figure 2: Log US nonfarm payroll employment (black), Minnesota (blue), Wisconsin (red), and forecast from November 2014 Wisconsin Economic Outlook, all normalized to 2008Q1=0. NBER defined recession dates shaded gray. Source: Source: BLS, Wisconin Economic Outlook (November 2014), NBER, and author’s calculations.
In contrast, United States NFP exceeded the 2008Q1 level by 2014Q2 (and Minnesota, Wisconsin’s next door neighbor, in 2013Q4). Interestingly, the Economic Outlook indicates sharp employment growth deceleration in 2015Q2.
For more, see Mike Ivey/Capital Times
November 17, 2014
The Japanese GDP Release: The Bad and the Not so Bad
Instead of a 0.2% q/q increase as in the WSJ survey, GDP declined 0.4% [0] [1] It’s pretty bad news, but here are a couple of observations, following up on my previous post on Japan.
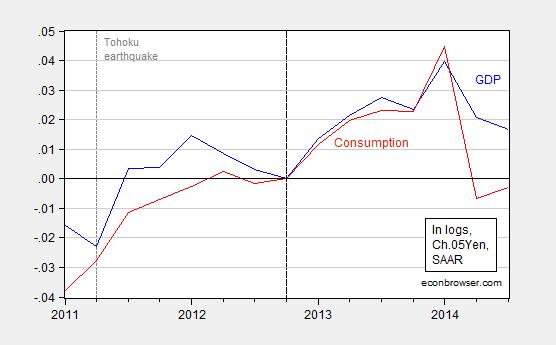
Figure 1: Log GDP (blue) and consumption (red), in Ch.05¥, normalized to 2012Q4=0. Source: Cabinet Office, and author’s calculations.
First, the drop is in output is definitely not a positive development. However, the good news is that the negative news should certainly solidify support for delaying the second part of the consumption tax increase. It should also rein in resistance to the expansionary monetary policy pushed by BoJ Governor Kuroda (well, I’m guessing — I’m not an expert on the intricacies of the BoJ).
What I find interesting is that exports, while not increasing much in the third quarter, have risen since the end of 2012. Assertions that the yen’s depreciation has not had a big impact on exports seem overdone to me (although it might be that one expected more growth in exports).
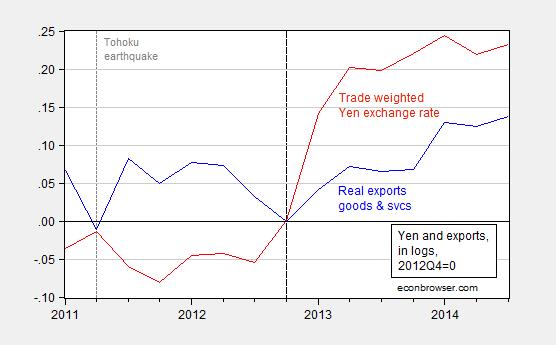
Figure 2: Log exports of goods and services in Ch.05¥ (blue), and log broad-basket trade weighted real yen (red), both normalized to 2012Q4=0. Upward movement in yen exchange rate is a depreciation. Source: Cabinet Office, BIS, and author’s calculations.
Export of goods and services in real terms have risen about 13.8% (log terms) since 2012Q4, while the yen has depreciated by 23.2%, on a trade-weighted, real terms, basis. That’s a ratio in changes of about 60%, not too far off my estimate of 0.66 long run elasticity of goods exports (see this working paper). Whether export behavior is in line with my estimates is not clear, since I have not factored in growth in Japan’s trading partners, which should have also pulled along exports.
Amiti, Itskhoki and Konings argue that the failure of goods exports to respond fully (at least through 2013) is because, based on their empirical work on Belgian firms, large exporters tend to be large importers, so that the yen depreciation has increased exporter marginal costs, thereby offsetting to a substantial degree the expansionary effects. I’m not sure how much that argument applies, as exports have grown measurably with the addition of 3 quarters of data.
One thing working in favor of future trade balance improvement is the recent decline in oil prices (particularly if combined with the restarting of nuclear power plants early next year [2]).
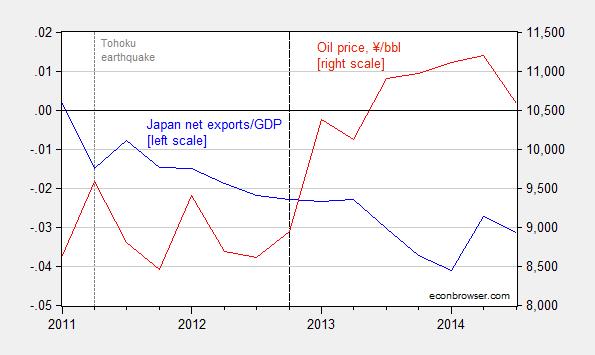
Figure 3: Net exports as a share of GDP (blue, left scale) and oil price in ¥/bbl (red, right scale). Yen oil price calculated as Brent oil price in USD multiplied by JPY/USD exchange rate. Source: Cabinet Office, FRED, and author’s calculations.
A final observation. Advance estimates of GDP are more than other releases “estimates”, so one might wonder how likely a positive re-assessment is. Unfortunately, Japanese GDP estimates have tended to be revised downwards over time (2 years out) [3] (Figure I.4). Thus, with the addition of more information, the drop might be larger in the end. That makes the case for expansionary monetary policy that much stronger.
More on the implications for policy from Jake Schlesinger/WSJ.
November 16, 2014
Social Security and Paid-Up Workers
Americans are living longer and retiring earlier. But how, as an individual or as a country, can you finance a 30-year retirement with a 40-year career? Stanford Professor John Shoven recently visited UCSD and presented some interesting policy suggestions.
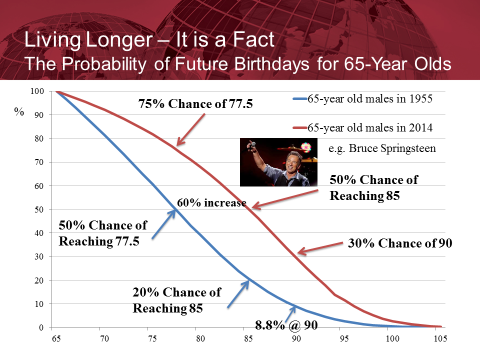
Probability that a 65-year-old male will live to the age indicated on the horizontal axis as of 1955 (in blue) and 2014 (in red), along with one example of a 65-year-old male in 2014. Source: Shoven (2014).
Professor Shoven noted that the current structure of Social Security in some cases amounts to a pure tax on those who work for more than 35 years in order to transfer those funds to individuals who retire early. He suggested that one change we should consider would be to recognize the status of “paid-up workers.” The idea is that if you’ve already put in 40 or more years of paying into Social Security, at that point your personal Social Security bill would be declared to be paid in full, and neither you nor your employer would be asked to make any more Social Security contributions for as long as you continue working. This would create more incentive for older citizens to keep on working and for employers to want to hire them.
I am deeply skeptical of claims that any cut in tax rates could actually produce an increase in tax revenue. But there is at least some offset in this case. If some people work longer than they otherwise would as a result of Shoven’s proposed change, while there would be less Social Security taxes collected from those individuals and their employers, the IRS would collect future income tax from those people that they otherwise would not get. And a number of academic studies (e.g., [1], [2], [3], [4], [5]) have concluded that the decisions of individuals to keep working in their later years can be quite sensitive to their take-home wage, meaning that the income-tax offset could be significant. Moreover, in research with Goda and Slavov Shoven proposed a combination of the “paid-up” exemption along with a number of other changes to benefits and contribution formulas that would be revenue neutral and on net encourage people to use some of the extra years that improving medicine has given us to keep on contributing.
These strike me as policy proposals that we ought to be taking seriously.
November 14, 2014
Preventing a Global Slowdown
Action is needed in the eurozone and Japan, according to the Treasury Secretary.
From Secretary Lew’s recent speech:
“In short, status quo policies in Europe have not achieved our common G-20 objective of strong, sustainable, and balanced growth. The ECB has taken forceful steps to support the economy through accommodative monetary policy. But as recent economic performance suggests, this alone has not proven sufficient to restore healthy growth. Resolute action by national authorities and other European bodies is needed to reduce the risk that the region could fall into a deeper slump. The world cannot afford a European lost decade.
…
“In Japan, the “three arrows” of Prime Minister Abe’s economic program were designed to forcefully combat deflation and fuel sustained economic growth. The first two arrows – monetary and fiscal stimulus – contributed to stronger growth in 2013, but growth has weakened this year as Japan stepped back from its efforts on the fiscal side. The third arrow – structural reforms – has not been fully released. Earlier this year, the Abe Administration put forward corporate governance reform and other structural measures. Even so, the test will be whether the third arrow is sufficient to transform Japan’s economy, and the jury is still out.
The importance of Japan and the euro area growth is highlighted by the amount of world GDP accounted by those economies. Figure 1 depicts the contributions in billions of US current dollars, as projected in the October World Economic Outlook.
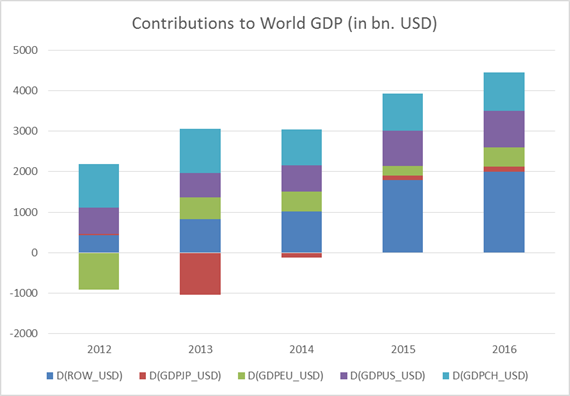
Figure 1: Contributions to world GDP growth in billions of US dollars, from China (light blue), US (purple), euro area (green), Japan (red), and rest-of-world (dark blue). Source: IMF WEO database (October 2014) and author’s calculations.
The euro area’s travails are well known, and while it eked out a 0.2% q/q growth in the 3rd quarter, as pointed out, the fact that a sigh of relief was heard is testimony to the fact that more needs to be done, with respect to credit easing by the ECB and the governments in terms of loosening fiscal policy.
In contrast, developments in Japan are somewhat less familiar. While Japan is not adding much to the 2014 increment to world GDP, it’s a big change from 2013 when it was a large debit entry. In order for Japan to remain a positive entry for 2016, growth has to be maintained. And here, it’s clear there are big challenges.
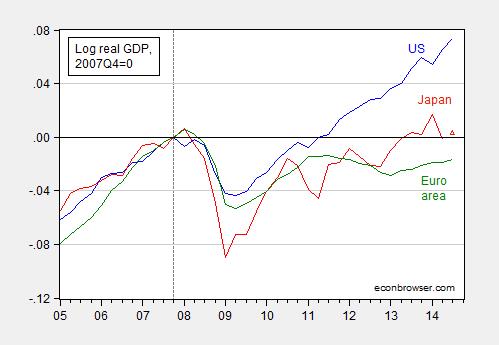
Figure 2: Log real GDP in US (blue), in Japan (red) and euro area (green), all normalized to 2007Q4=0. 2014Q3 observation for Japan is based on 2.25% q/q SAAR growth rate median forecast from WSJ survey. Source: BEA, OECD via FRED, and ECB, WSJ and author’s calculations.
An aside: Note that the US, which has pursued more expansionary fiscal and monetary policies than the eurozone and Japan (and the UK) has expanded much more rapidly.
The downturn in Japanese GDP has been attributed in large part to the implementation of the consumption tax rate hike, the first step of which was an increase from 5% to 8% in April. The second stage of the consumption tax hike, 8% to 10%, is likely to be delayed [Landers/WSJ]. Krugman notes the rationale for the delay (raising taxes, and/or otherwise withdrawing fiscal stimulus in the midst of a fragile recovery is counterproductive); the position of Koichi Hamada, a key Abe adviser, is noted in this FT article (Nov. 4):
Koichi Hamada, a former economics professor at Yale University who was among the architects of Mr. Abe’s growth-enhancing policy known as Abenomics. Mr. Hamada stressed that the tax increase should be delayed until 2017 in the absence of a strong pickup in economic growth.
Mr. Abe will hold four more panel sessions over the next two weeks to hear from a total of 45 experts who are believed to hold varying views on tax policy.
Many experts believe the government should go ahead with the tax increase despite the risk of slowing economic recovery. Among the panelists espousing such a view Tuesday was Nobuaki Koga, president of the Japanese Trade Union Confederation. “The sales tax increase to 10% should be implemented as agreed upon,” Mr. Koga told the panel. “The burden of maintaining the social security system should be shared by taxpayers.”
Aside from the clear policy implications — tax increases to consolidate public finances should be implemented during times of positive output gaps (e.g., United States 2004-06) rather than times of economic fragility — there are implications for our thinking about what type of macro model applies to the real world. From Simon Wren-Lewis musing in Mainly Macro about how to think about the consumption tax increase, over a year ago:
Japan’s Prime Minister Shinzo Abe has decided to go ahead with an increase in consumption taxes from 5% to 8% in April 2014, with a further increase to 10% planned for later. Will this be the first step to reducing the very high level of government debt in Japan (in net or gross terms, the highest in the developed world), or will it derail the recovery? In many ways the answer depends on whether you like your macro state of the art, or more antique.
Consider the antique first. Raising the consumption tax takes real purchasing power out of Japanese consumers’ pockets. It is a straightforward fiscal contraction, on a very large scale: the last thing you need when we only have the first signs of a recovery. Now in theory this fiscal contraction could be offset by monetary expansion, but can monetary expansion really be strong enough to offset a fiscal contraction of that size? Some macro antiques were always rather suspicious about the potency of monetary relative to fiscal policy anyway, but in a liquidity trap those suspicions become certainties. Even if the central bank does succeed in reducing real interest rates by raising inflation, is that going to be more powerful than the cut in real incomes that this higher inflation brings?
So why might modern macro be less pessimistic about the impact of the consumption tax increase? For one thing it might be more optimistic about the potency of monetary policy, particularly in an open economy. If the central bank is really committed to bringing about a recovery come what may then it may be prepared to see inflation go well above 2%. But I would suggest the more important difference lies with the fiscal impact of the tax increase. Modern macro could bring two arguments to the table.
The first is Ricardian Equivalence. The consumption tax increase has been planned for some time, so consumers will have already factored in its impact into their consumption decisions. Even if they had wondered if the tax increase might be postponed, some taxes will have to rise at some point. So if all the Prime Minister has done is confirm that tax increases are going to come sooner rather than later, the logic behind Ricardian Equivalence will mean that the impact on consumer spending will be second order.
The second involves the incentive effect of higher sales taxes, which I discussed recently. If monetary policy does not try and offset the impact that higher sales taxes will have on inflation, then anticipation of the tax could lead consumers to bring forward some consumption. What this really involves is fiscal policy mimicking monetary policy. Or to put it another way, if you were doubtful that monetary policy through Quantitative Easing could raise inflation, here is a surer way to achieve the same thing.
The common theme here is the importance that modern macro places on expectations of a fairly rational kind. Yet even if you are happy to go along with this, there is an important proviso that does not get emphasised enough. How did consumers know that the budget deficit would be reduced by raising taxes rather than cutting spending? If they had expected the deficit to be reduced by lower government spending, they will not have expected a fall in their post-tax real income. For these consumers the Prime Minister’s announcement will come as a surprise, and they will reduce their consumption as a result.
Well, look at the behavior of consumption in Japan.
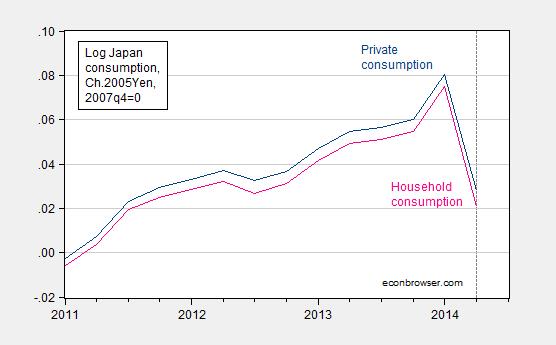
Figure 3: Log real private consumption (dark blue), and household consumption (pink), both in Ch.2005Yen, normalized to 2007Q4=0. Dashed line at 2014Q2, implementation of the tax increase. Source: Cabinet Office/ESRI, and author’s calculations.
Notice that consumption growth was positive until the imposition of the tax. This timing suggests to me that Ricardian equivalence doesn’t hold fully in Japan (after all, as Wren-Lewis notes, Abe’s announcement of a tax increase rather than spending cut should have, if perfectly credible, implied an immediate drop in consumption at time of announcement).
So put me more in “antique” than “state of the art” camp (although the spike in consumption is consistent with moving forward consumption in anticipation of a higher tax rate in the future — so I do believe expectations matter!).
For more on expectations, without infinitely lived consumers, in this post.
November 12, 2014
IMF Annual Research Conference on “Cross-Border Spillovers”
The proceedings start tomorrow (Thursday).
My colleague Charles Engel covers Policy Cooperation, Incomplete Markets and Risk Sharing, while other topics include ECB monetary policy spillovers, Fed policy and foreign bond yields, linkages across sovereign bond yields, fiscal shock effects, capital controls, currency unions and capital markets, and input trade linkages. The Mundell-Fleming lecture will be given by Hélène Rey, “Monetary Policy and International Capital Flows”.
Here is the program.
And here is my take on spillovers (with Joshua Aizenman and Hiro Ito), “Monetary Policy and the Trilemma in the New Normal”. See also “Global Spillovers and Domestic Monetary Policy:,” BIS Working Paper 436 (December 2013).
(Fiscally) Bleeding Kansas
The deterioration in Kansas state finances not only continues unabated — it is seemingly accelerating.
Figure 1 presents the evolution of estimates of Kansas state general fund receipts.
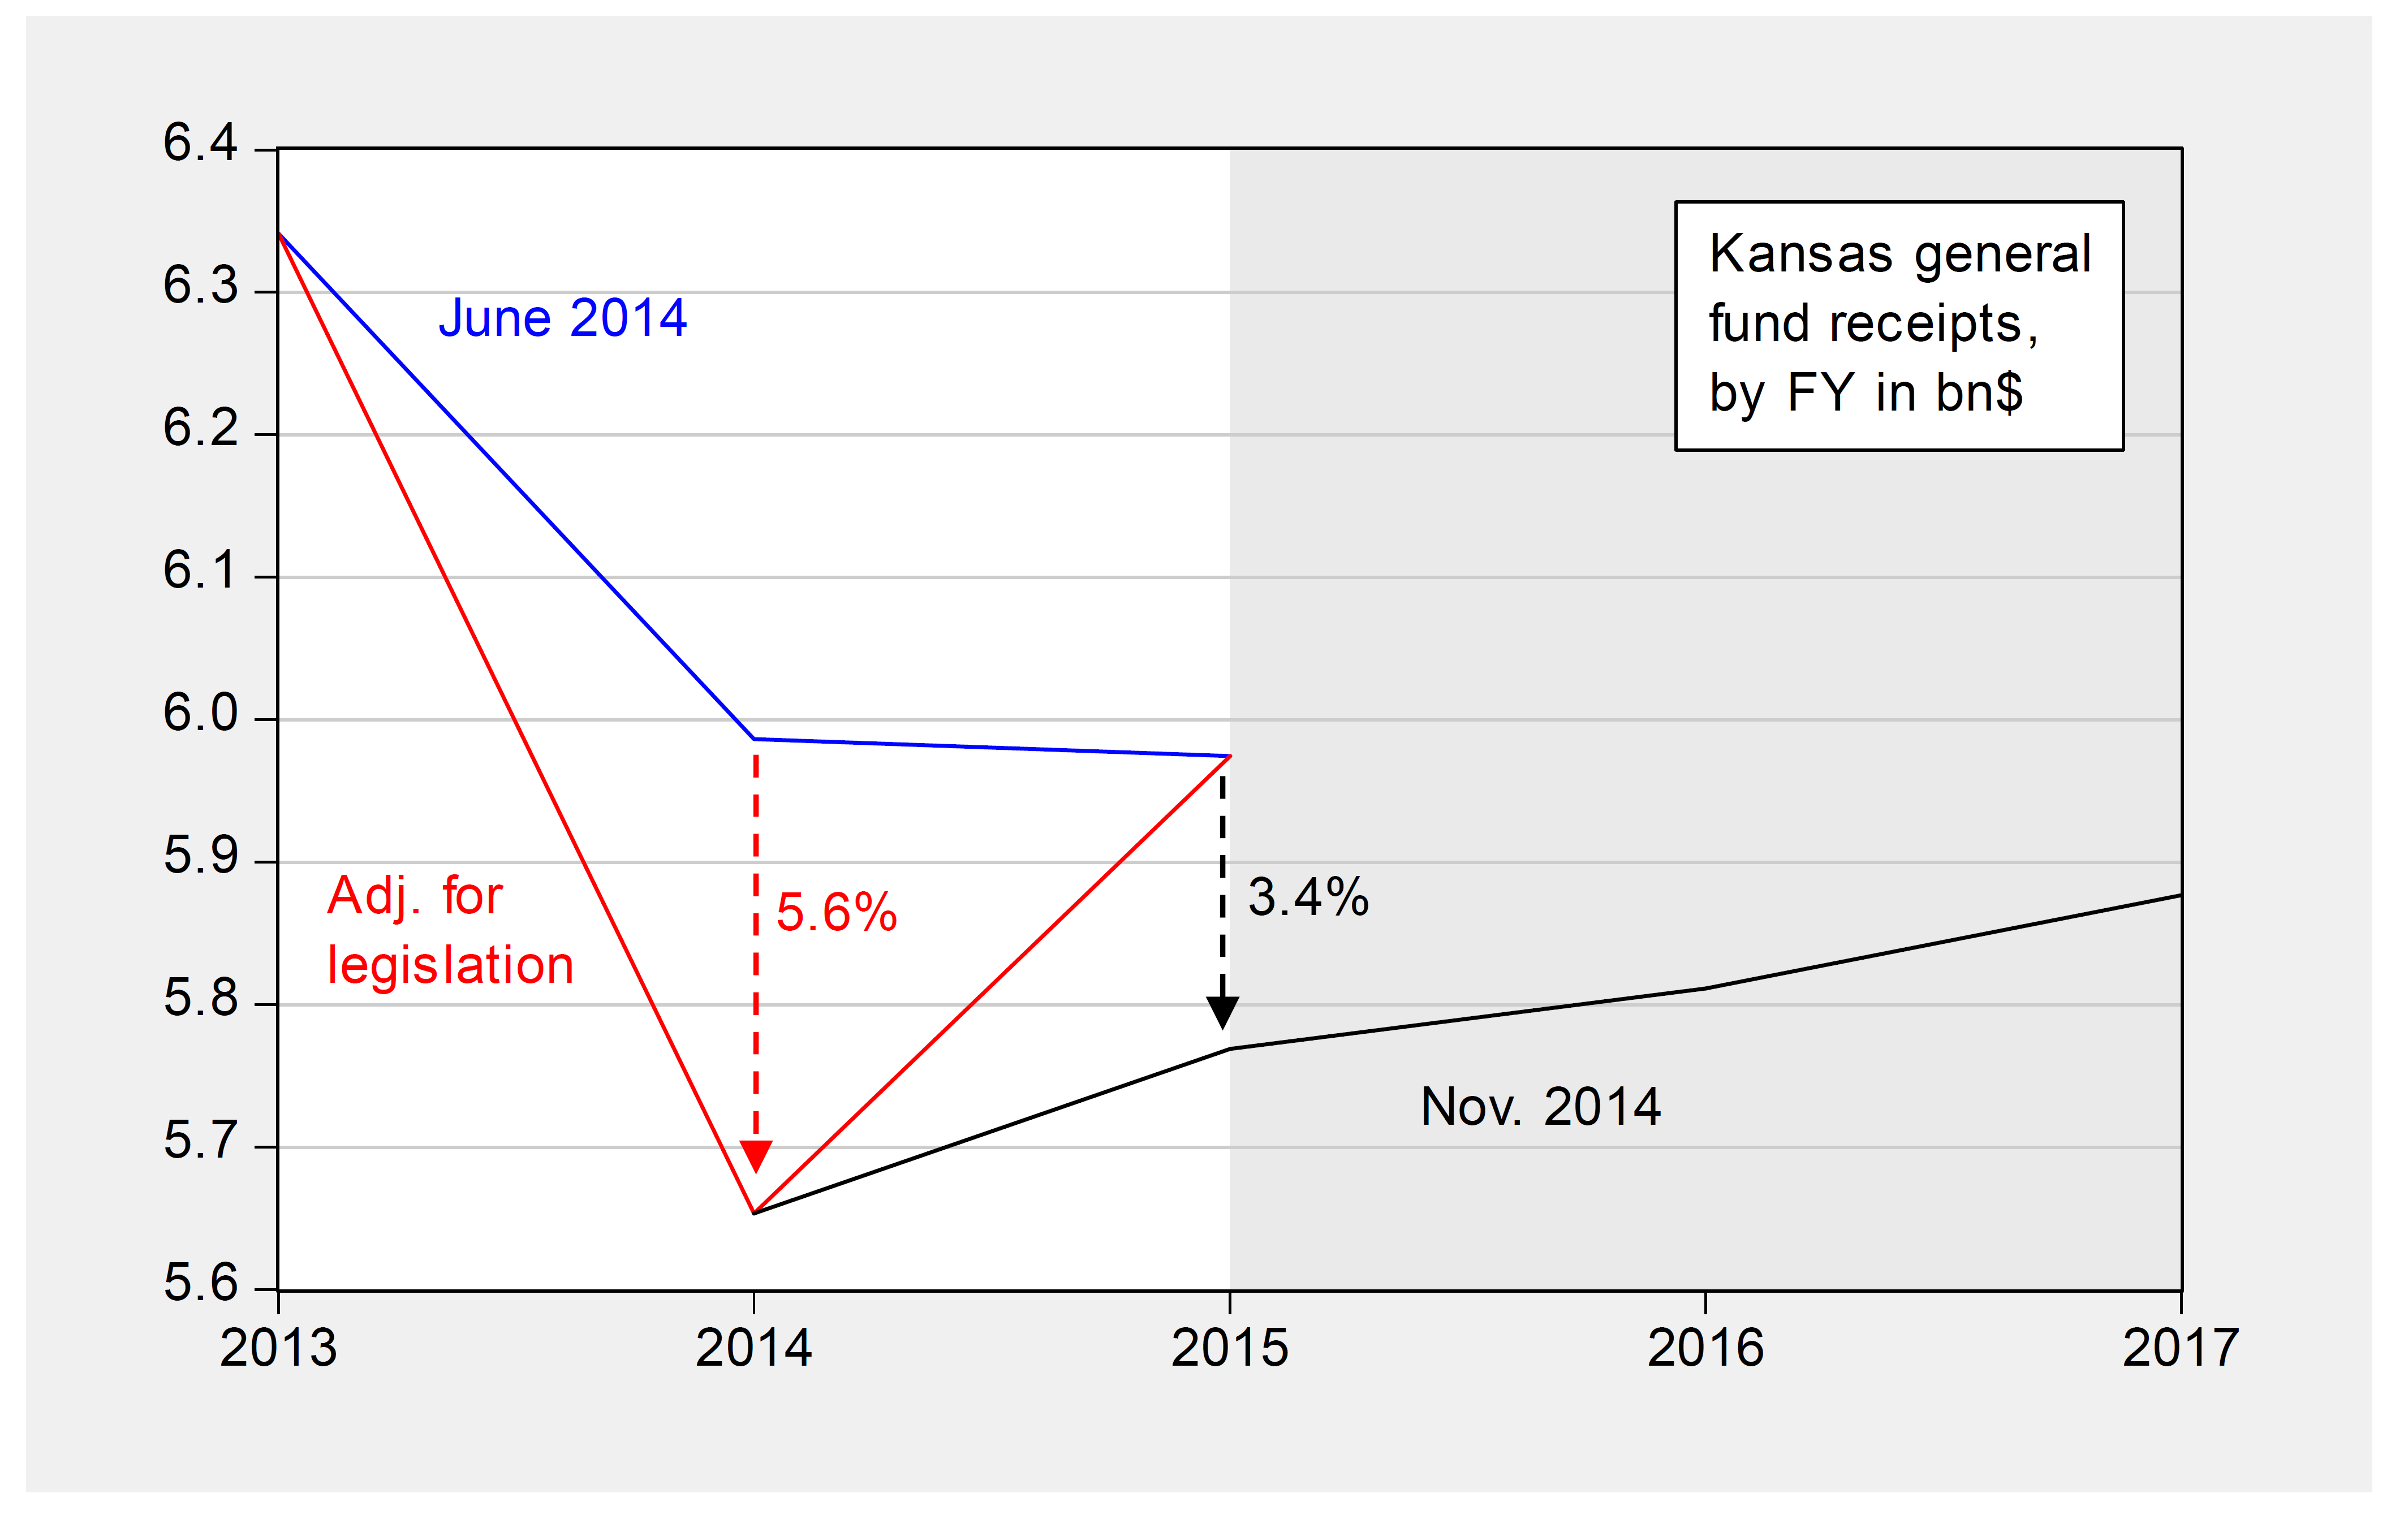
Figure 1: Kansas state general fund receipts, as estimated by Kansas Legislative Research Department and Kansas Division of the Budget June 16, 2014 (blue), adjusted for legislative changes during veto session Nov. 10, 2014 (red), and updated estimates as of Nov. 10, 2014 (black). Shaded area are forecasts as of November 2014. Source: Kansas Legislative Research Department and Kansas Division of the Budget (June 16, 2014) and Kansas Legislative Research Department and Kansas Division of the Budget (November 20, 2014).
As the Kansas budget blog observes, FY 2015 approved spending plus additional costs required to pay for Medicaid and school finance totals $6.427 billion. That means that even after completely draining the reserves in the state bank account, $279 million must still be cut from already approved spending just to keep the state solvent.
From the Wichita Eagle:
The state of Kansas will not have enough money to pay its bills through June unless it cuts $279 million in spending, according to updated revenue estimates.
Just a week after being re-elected, Gov. Sam Brownback is staring down a budget crisis, and nonpartisan analysts point to his signature policy as the cause.
Budget director Shawn Sullivan had the unenviable chore of presenting the state’s dire fiscal outlook at a news conference Monday evening at the Capitol. The state must cut $279 million for the current fiscal year, which ends in June, and another $436 million in the next fiscal year.
…
The shortfall is primarily being driven by the state’s income tax cuts, which Brownback signed into law in 2012, confirmed Raney Gilliland, director of the state’s nonpartisan Legislative Research Department. The state has lowered its expectation for individual income tax revenue by $239 million since April.
Sullivan said he had not discussed raising taxes or delaying scheduled tax cuts as possible solutions to righting the state’s financial ship.
Gilliland said the state’s current budget woes differed from the crisis it underwent during the recent recession, when the federal government came to the aid of Kansas and other states that saw revenue plummet.
“It’s not a national phenomenon, so I’m not expecting under these circumstances for the federal government to come to our rescue,” Gilliland said.
Gilliland said it was “yet to be determined” whether the income tax cuts were stimulating more economic activity than the state would see otherwise. The state is projected to see slower growth next year than the nation as a whole.
On the campaign trail, the governor repeatedly promised that economic growth would cover the state’s projected shortfall.
…
Below is a depiction of the Kansas economic outlook, based on the Philadelphia Fed’s leading indices.
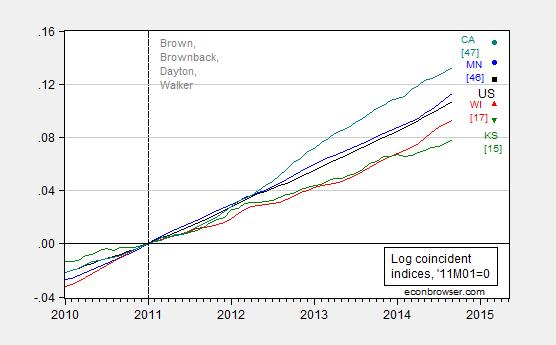
Figure 2: Log coincident indices for Minnesota (blue), Wisconsin (red), Kansas (green), California (teal), and US (black), and forecasted levels for March 2015, all seasonally adjusted, normalized to 2011M01=0. Numbers in [square brackets] are ALEC-Laffer rankings from Rich States, Poor States 2014. Source: Philadelphia Fed leading indices, coincident indices, ALEC RSPS2014, and author’s calculations.
The outlook for the Kansas economy does indeed look rather lackluster for the next half year.
November 10, 2014
Known Unknowns in International Finance
Implications for the dollar’s trajectory
A few days ago, reader Tom chastised me for announcing “somebody’s estimations of a theoretical, unobservable phenomenon” as known. Today, I will repeat that alleged offense in regard to the counterfactual known as the purchasing power parity exchange rate, a pervasive concept in international finance.
Recall, if one extends the law of one price to the international context, and assume bundles of goods are identical, then it must be true that:
S = P/P*
Where S is the exchange rate expressed in $ per foreign currency units, P is the US price level and P* is the foreign price level. In logs:
s = p – p*
If purchasing power parity (PPP) holds instantaneously, then the real exchange rate, q ≡ s-p+p* is a constant.
Few people believe that PPP holds instantaneously; however, many believe that s, p and p* are cointegrated with unit elasticities, so that q is stationary. One interpretation, then, is that PPP defines a “fair value” for the exchange rate, i.e., a “counterfactual”.
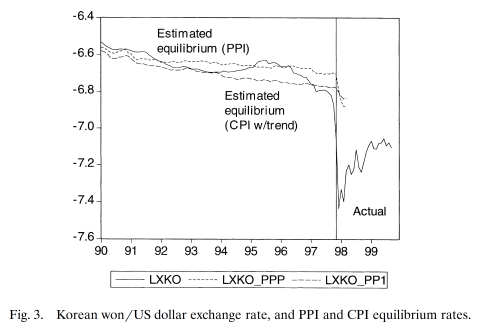
How many people believe it? Hard to say. Punching in the words “cointegration” and “purchasing power parity” into Google Scholar yields 100 pages of references (100 pages appears to be the maximum that Google Scholar provides). One example of calculating counterfactual “equilibrium exchange rates”, based upon PPP, for the currencies involved in the 1997 East Asian crises is “Before the Fall: Were East Asian Currencies Overvalued?”. Below are PPP estimates for the Korean won.
The use of PPP as a measure of “fair value” is commonplace; see for a recent instance Ruskin and Saravelos, “Long-term overshoot,” FX Forecasts and Valuations (October 9, 2014). [not online]:
The thrust of our USD positive forecasts are centered around the theme of multi-year policy divergence in favor of the dollar. This has not changed materially in the past year. Readers will find more surprises in the out years, notably in our new 2016 and 2017 forecasts when we expect the USD to overshoot ‘fair value’. This follows a familiar post-Bretton Woods pattern of USD overshooting (up and down) in every cycle when USD policy rates strongly transition from a very low ranking against G10 peers, to a ranking at or near the top end. Only in the 2018 – 2019 period do we project some reversion back to long-term ‘fair value’ in line with expected monetary policy trends. …
(Note: using Tom’s criterion, every appearance of the term “fair value” should be preceded by the adjective “estimated”, which I think would be tiresome, but that’s just me.)
Here is Deutsche Bank’s fair value series for the trade weighted US dollar.
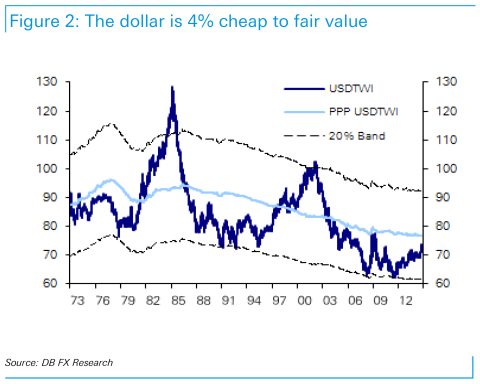
Source: Ruskin and Saravelos, “Long-term overshoot,” FX Forecasts and Valuations (October 9, 2014). [not online]
Some people would say that it is silly to estimate counterfactuals in this case — that is one couldn’t know what the exchange rate would be — but apparently the appeal to counterfactuals is widespread in the international finance/applied econometrics literature. Here are the DB estimates as of October for the degree of misalignments (of course, contingent on the possibility of calculating counterfactuals):
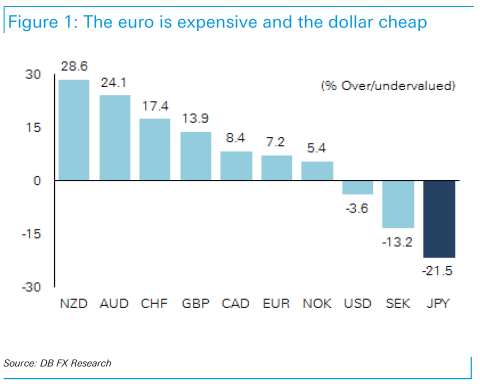
Source: Ruskin and Saravelos, “Long-term overshoot,” FX Forecasts and Valuations (October 9, 2014). [not online]
See here for Known Unknowns in Macro. A simple exposition on PPP is here, and a post on the subject of PPP and the dollar over eight years ago.
Menzie David Chinn's Blog


