
Harry S. Dent Jr.'s Blog, page 91
January 31, 2017
It’s Coming… Are You Prepared?
“World War III” has been mentioned recently by both President Donald Trump and former Soviet leader, Mikhail Gorbachev.
That’s pretty frightening, if you ask me!
Mr. Gorbachev of course knows a thing or two about nuclear war. Between 1986 and 1988, he and U.S. President Ronald Reagan reached agreements to reduce each side’s cache of nuclear missiles. Shortly after, in 1991, the Soviet Union dissolved and the Cold War was ended – crisis averted!
Fast-forward 26 years and five U.S. presidents… and Mr. Gorbachev is once again worried. In an article he wrote for Time magazine, he said “It all looks as if the world is preparing for war… the nuclear threat once again seems real.”
And he makes no bones about who needs to step up (by stepping down) to stop it.
Speaking of his proposed UN Security Council resolution to guard against nuclear conflict, Gorbachev said: “I think the initiative should come from Donald Trump and Vladimir Putin – the presidents of two nations that hold over 90% of the world’s nuclear arsenals and therefore bear a special responsibility.”
Of course, neither Trump nor Putin seems to have any interest in reducing nuclear capability. Both have instead talked of strengthening their nuclear stances.
But I’m not here to talk geopolitics today.
I have my opinions, like everyone. And yes, I’m concerned about our future. But frankly, geopolitics is outside my wheelhouse of expertise. My guess at what could trigger the next global economic crisis – “World War III” or otherwise – is as good as anyone’s.
However, I DO know which investment strategy I’ll be going to war with… whenever, and wherever, calamity strikes.
That strategy is… trend-following!
Long-time readers know well my love affair with trend-following. I’ve written and talked about it for five years now. The trend-following philosophy underpins my Cycle 9 Alert service, which I’ve been running successfully since 2012. And I’ve incorporated trend-following principles into my latest market-timing model, which I’m currently sharing with early-access subscribers to my new service, Project V.
But the reason I’m talking about trend-following today – alongside warnings of “World War III” – is that it’s the ONLY strategy proven to provide protection (and profits) during times of extreme crisis.
And here’s the chart that proves it…
 I’ve shown this chart before. It comes from an AQR white paper titled, A Century of Evidence on Trend-Following Investing. And it could be the only chart you need to consider, if you have some degree of suspicion that trouble lies ahead.
The chart shows the 10 worst performance periods for a conventional “60/40” portfolio (60% stocks; 40% bonds). The drawdowns of that 60/40 portfolio are shown above in purple.
As you can see, each of those periods of sharply negative performance coincided with notable financial or geopolitical events.
World War I…
The Great Depression…
Stagflation…
The oil crisis…
The dot.com bubble…
The Great Financial Crisis…
Each of these major world events triggered significant losses in most investors’ portfolios – even the “conservative” portfolios that dutifully held 40% in bonds.
In contrast, the diversified trend-following strategy was not only immune to each crisis, it was able to provide strongly positive returns – acting as the perfect “crisis hedge” to traditional stocks-and-bonds portfolios.
During World War I, the 60/40 portfolio was down… and trend-following was up.
The same thing happened during the most recent Global Financial Crisis.
The trend-following strategy’s ability to provide strongly positive gains during times of crisis is perhaps its most notable and persistent feature.
Kathryn Kaminski – MIT Ph.D. and trend-following expert – coined the term “crisis alpha,” to describe the profit potential that trend-following uniquely provides during major, lasting crises.
Given the fact that the trend-following strategy has a 100-plus year track record of positive returns… and given it’s one of the only strategies I know that performs best in times of crisis… I’m convinced that a trend-following investment strategy will be the only place to hide during the next global crisis – whether that comes from a Chinese “hard landing,” a demographics-driven depression, or a nuclear-inspired “World War III.”
If you’re not a subscriber to Cycle 9 Alert or Project V, then another way to invest in a trend-following strategy is through a managed-futures mutual fund. The Guggenheim Managed Futures Strategy Fund (Nasdaq: RYMFX) is one of the biggest and longest-running funds readily available to retail investors.
But if you’re looking for a more hands-on approach, consider joining my Cycle 9 Alert service. My unique, sector-based approach to trend-following has worked quite well over the last five years. And since it’s built on the foundation of trend-following, I consider Cycle 9 Alert a “crisis-ready” strategy that’s a must-have in today’s tumultuous times.
Adam O’Dell
Editor, Project V
Follow me on Twitter @InvestWithAdam

The post It’s Coming… Are You Prepared? appeared first on Economy and Markets.


January 30, 2017
Keeping Your DUCs in a Row
 OPEC producers are cutting production… or so they say.
And in addition, several non-OPEC producers, like Russia, are also cutting production. If history is any guide we could do away with the titles and simply call the Organization of the Petroleum Exporting Countries, and the all rest, the Energy Liars’ Club.
They often say one thing and then do another.
Even Saudi Arabia’s Oil Minister noted that OPEC members have a history of lying to each other. I don’t care how they treat each other. I’m only interested in how their actions – not their words – affect the money in my pocket.
For all their dramatic statements and grand pronouncements of deals that I don’t think will ever be honored, they’ve actually already provided the United States a great service.
In their quest to kill the American fracking industry, the Saudis have made the frackers stronger.
When the competition didn’t roll over and die, the OPEC members were forced to concede defeat and take a new line of attack (the recent production cuts). It won’t work, and that’s just fine for me, because it means cheap energy is here to stay.
In 2014, oil cost about $100 per barrel. At the time, frackers were riding high. More than 1,000 rigs were at work in the U.S., breaking apart rock with hydraulic might to tap new sources of oil. Energy employment was surging, and home prices in North Dakota were rising too. The Saudis, who are the largest OPEC producers, weren’t happy.
$100 oil was a good thing, but the insurgent American frackers had driven U.S. oil production above Saudi production, and the kings of oil weren’t interested in being displaced. So they ramped up production.
As OPEC members opened the taps, and demand growth remained steady but sluggish, the imbalance between supply and demand took its toll. Oil prices started to slide, and the trend picked up speed in the second half of 2015. By early 2016, we hit the bottom, just under $30 per barrel.
OPEC ministers must have been giddy. Their program caused widespread pain across the U.S. energy sector, resulting in massive layoffs by frackers, more than a few bankruptcies, and even falling land prices in energy-rich states.
But then something happened that the Saudi’s didn’t expect.
Frackers got better. More specifically, frackers increased efficiency… and survived.
In 2014, fracking companies broke even at $60 per barrel. The cost of recovering oil includes the exploration and drilling process, which is expensive, as well as pumping it once it’s located, which costs a lot less.
As oil prices dropped, frackers capped wells they hadn’t completed yet, which are called “drilled but uncompleted,” or DUCs. They focused on the more profitable wells that were already producing. They used the down time to work on efficiency, and eventually dropped their break-even price to $45.
Now American fracking companies have the best of both worlds – a bunch of DUCs already in hand (or, pardon the pun, in a row), located and ready for completion, and oil prices comfortably above their break-even price.
So, as the Energy Liars’ Club pushes up the price of oil, they’ll simply draw frackers back into production. In fact, this is already happening, as can be seen by the number of rigs in the U.S.
After dropping to a low of 316 rigs last summer, the U.S. rig count in operation on land has rebounded to 529, or 13 more than there were this time last year. This is a long way from the top in 2014, when just over 1,600 rigs operated. But, hey, that just means we have a long way to go.
 Right now, U.S. energy producers have a problem bigger than the price of oil, but one that’s solvable.
When oil prices plummeted, companies had to idle production, put equipment in storage, and lay off their employees. Getting equipment back is easy, but getting people back is hard.
Skilled workers found other jobs, and are probably hesitant to go back to an industry that fired them the last time around. So frackers will have to entice back previous employees with higher pay, train new workers, or some combination of the two. This will take time.
It’s possible oil prices will creep up a bit more as frackers slowly expand their operations, but eventually U.S. production will ramp up, and I expect oil prices will come down.
Members of the Energy Liars’ Club will break their production commitments to each other, adding even more supply to the system.
And frackers will get even more efficient… putting a lower lid on prices for years to come. That’s at least one cost that should remain low for consumer’s businesses, making those higher medical care and education costs just a bit easier to stomach.

Rodney
Follow me on Twitter @RJHSDent
P.S. In case you’ve missed it, your chance to lock in almost $15,000 worth of valued Dent Research resources is running out. You’ll get nine profit-packed services, and never have to pay for anything we publish ever again. Click here to learn more.

The post Keeping Your DUCs in a Row appeared first on Economy and Markets.
January 27, 2017
How to Take a Loss Gracefully
 I’m convinced that learning to take a loss gracefully is the single best skill you can develop as an investor.
George Soros does it like a champ. In the legendary hedge funder’s own words: “I’m only rich because I know when I’m wrong. I basically have survived by recognizing my mistakes.”
Think about that. George Soros has every right to say, “I’m rich because I’m smart and I’ve made wise investments.” Nobody could argue with him or his track record.
But instead, he credits most of his success to his ability to take a loss gracefully. He knows he’s not perfect. He knows he’ll make plenty of trades that go sour. He knows he’ll have some down months. And he simply accepts these facts as the investment game’s “cost of doing business.
Soros doesn’t take losses personally. He doesn’t let a loss affect his ego or get him feeling depressed. He just takes the loss and moves on. He’s unemotional about it. And that allows him to stay in the game and, ultimately, make a profit.
Most people assume that legendary investors like Soros and Buffett have some “special power”… something they were graced with at birth… something that ordinary people, like me and you, will never have.
But I don’t buy that…
Soros and Buffett just know how to take a loss gracefully.
And that’s a behavioral skill. One that you too can develop as easily as they have.
Here’s how…
First, Admit There’s a Problem
Psychologists say that the first step in fixing a problem is admitting the problem exists.
Most investors have a hard time doing this. We find it difficult to acknowledge the fact that we’ll take many, many losses throughout our investing lifetime. We also have a hard time admitting just how emotionally draining those losses can be (and that our emotions will make us do stupid things).
So, the first step in learning how to take a loss gracefully, like Soros and Buffett, is to admit that losses are inevitable.
Here’s a contract that you can sign for yourself. It may help you acknowledge and internalize this fact.
I, (name), recognize that all investments carry risk. I know it’s impossible to invest without taking risk.
Some investments will generate profits. Some investments will result in losses. It’s impossible for me to know, in advance, what the outcome will be.
So, whenever I take a loss, I acknowledge that it will feel painful, but I will bear it gracefully. I will not allow it to overwhelm my mental state or cause me to stray from my strategy.
One loss will not break me.
Print that out. Tape it next to your computer monitor. And read it every time you go to make a new trade.
Seriously, if you can admit the fact that losses are simply the “cost of doing business,” you’ll be well on your way to taking your losses as gracefully as Soros and Buffett.
Of course, after admitting that losses are inevitable, you’ll still want to find a way to protect your mind from the psychological damage that losses invoke.
Here’s one “trick” for that…
Reduce Losses by Reducing This One Activity
Soros and Buffett know how to keep focused on the long view. They aren’t concerned with what happens on any one day… or in any one week. They care about monthly performance, and even more about annual performance. They know everything else is just meaningless noise.
After admitting to yourself that losses are inevitable and unavoidable, decide how often you’ll check your brokerage account balance.
Daily? Weekly? Monthly? Yearly?
In the age of instant access, investors are tempted to monitor their account balances almost constantly… with hourly checks and automated alerts to their smartphone.
That’s just insane! Don’t do it!
If you’re committed to being a disciplined investor with an eagle eye on the long view, you really shouldn’t check your account balance more than once a month.
Consider this chart, which shows the success rate of the market-timing model I’m sharing with early-access subscribers to my Project V service:
 As you can see, checking your account balance every day makes no sense. No matter what strategy you’re following, you have something like a 50% chance of seeing a loss on the day and a 50% chance of seeing a gain. And since daily performance is just “noise,” there’s no good reason to check your account balance that often. You’ll only give yourself heartburn and increase the temptation to cave in to your emotions and do something stupid.
Checking your account balance once a month makes more sense. Most good, time-tested strategies will produce positive returns most months – anywhere from 60% to 80% of the time.
And, of course, a good strategy should have far more winning years than losing years. Back-testing has shown that my Project V market-timing model has had a historical, annual win-rate of 92%.
No matter what strategy you’re following, if you’re committed to strengthening one of the most important skills in investing – the ability to take a loss gracefully – I suggest you follow two simple steps.
1) Admit that losses are inevitable;
2) Resolve to check your account balance no more often than once a month.
In the end, you’ll be a happier and wealthier investor.
Adam O’Dell
Editor, Project V
Follow me on Twitter @InvestWithAdam

The post How to Take a Loss Gracefully appeared first on Economy and Markets.
January 26, 2017
Will Cars Be the Death of Us This Time?
[image error]The shining star of the 2009-2016 recovery has been auto sales.
We weren’t surprised. In fact, we saw it coming. After all, cars are the last large purchase people make before stepping quietly into their years of increased saving and decreased spending. From around the age of 57 to 64, one task takes center stage: save for retirement. In the durable goods sector, housing peaks first around age 40, then furnishings at age 46. Only automobiles continue to grow after the peak in spending at age 46.
We’re in the midst of updating our consumer expenditure data. The biggest change thus far is how QE and super-low interest rates have shifted the new car sector. In the 1990s, spending peaked at around age 54. But now, older Americans have been buying better cars later into life, into age 62. In general, auto sales don’t so much grow as move sideways in a plateau between ages 41 and 62 and the steep drop-off now occurs after 66, not after 54.
It makes sense. My car leases have gone as low as 2%. Back before 2008, I was paying as much as 5% to 6%! That makes hundreds of dollars of difference in my car payments and allows you to buy a better car.
But time has proved that low rates weren’t enough for an industry with highly aggressive lending practices (I’m talking worse than mortgages and home loans) and an inevitable demographic cliff…
In the last boom, subprime mortgage lending peaked at $44 billion per quarter. Subprime lending for cars peaked at $42 billion! That’s surprising given that the housing industry is so much larger… and you’re buying an asset so much bigger than a car.
In this current boom, the auto subprime loans exploded again, this time without mortgage loans for company. Subprime auto loans have hit as high as $38 billion in Q2 2015, while subprime mortgages have been flat, around $20 billion.
So, basically, car dealers have been willy-nilly extending credit to more and more people who have less than 620 credit scores… all to boost sales further. And they’ve been pushing loan terms out to six years, sometimes even seven, while keeping interest rates at insanely low levels, just like they did into 2007.
It’s no wonder we’re once again faced with a massive auto-loan debt bubble, and a “booming” industry.
Just look at this insanity…

From 2003-2007, auto debt rose by $210 billion. From 2011-2016, it has surged more than twice as much, by $433 billion, to $1.135 trillion, higher than all credit card debt. And it’s still rising rapidly.
Whatever happened to learning from your mistakes? Not repeating history? Clearly the lessons of the last bust in the economy, housing and cars, has been lost on this industry.
Now there are early signs that trouble is brewing and that the wheels are starting to come off this bus. Auto loan delinquencies are rising again. But this time around they bottomed at 3.2% and have risen to 3.6%. Last time they started at 2.0% and were at 3.2% in Q1 2008, when the recession started. They reached 5.3% in Q4 2010. So, they’re starting higher and will almost certainly go much higher as well, to 6.5%-plus in the next downturn.
This rise in subprime auto debt and delinquencies it yet more evidence that we’re on the verge of the next downturn…
And you know what I think! What we now face will be the worst downturn since the Great Depression… and the final bubble crash will finally lead to serious debt deleveraging and deflation, unlike last time when we were spared by $13 trillion in QE globally.
I really don’t believe the public will buy letting central banks double down and print $25 to $30 trillion to bail us out this time. I really see no way out of this.
And by the time we come out of this next crash, the auto boom will be over demographically and will not be as strong in the next boom.
But I do see opportunity, which I detail in my book The Sale of a Lifetime. Have you read your copy yet?

Harry
Follow me on Twitter @harrydentjr

The post Will Cars Be the Death of Us This Time? appeared first on Economy and Markets.
January 25, 2017
What Moves Interest Rates?
 You’ve heard me go on and on about U.S. Treasury interest rates – they’re my specialty, after all, but you’re of course forgiven if some of the finer points are lost on you. It can be a bit hard to picture why a number as tiny as, say, 3% is so radically different from 2.5%, and why so much fuss is made about them.
Put another way, why should you even care about these percentages? What do they mean for you?
Let’s back up for a moment…
The Federal Reserve Bank of the U.S. (the Fed) has two directives from Congress, called the dual mandate. The mandate requires the Fed to provide maximum employment and to provide price stability. They try to meet those objectives by tinkering with interest rate or monetary policy.
The Fed’s most publicized tool for this sort of thing is what’s called the “federal funds rate,” which is the overnight lending rate charged to member banks to meet reserve requirements. A change in the fed funds rate can impact other interest rates but, the market ultimately prices in risk and its outlook of the economy.
Just a couple tenths of a percentage point can very well determine if, say, a company can borrow money from the bank cheaply enough to make a major merger, or avoid layoffs, or finance a risky product change. These rates (and the threat of higher or lower rates) are priced into the market.
Think of the U.S. economy as a pond…
When you’re dealing with billions – if not trillions – of dollars, a few measly percentage points can make a huge ripple in the economy. So, current rates and future rate changes are really important for companies, consumers and investors alike.
Now, the Fed has promised three fed funds rate hikes this year, but we’re not holding our breath. Remember, they promised four last year at this time and came through one time – in December! That’s a lot of handwringing over a couple of tenths of a percentage point.
But there’s an even more fundamental question for us: Does the Fed really set interest rates? Well, yes and no.
The Fed has lost a lot of credibility over the last several years. They’ve vowed to be transparent… but what does that really mean? Through the actions of Fed Chair Janet Yellen and other Fed officials, it means that they reserve judgement on policy action until they’ve digested incoming economic data. The Fed has called this plan being “data dependent.” Well, OK. As opposed to being dependent on a secret crystal ball?
Early on, following the financial crisis of 2008 when the unemployment spiked to 10%, the Fed decided that their desired target rate would be a 6% unemployment rate. At the same time, they were fighting deflation – or falling prices.
And since fighting deflation hadn’t been a problem since the Fed was created, it decided to experiment with what former Fed Chair Ben Bernanke called quantitative easing (QE). QE meant the government bought enough bonds to flood the market with liquidity as well as bringing the federal funds rate down to 0.0%. Basically, the Fed started holding its own debt! The objective was to create inflation and jobs.
QE was halted in 2014 but the size of the Fed’s balance sheet remains nearly as bloated now as it was when QE was stopped. The Fed has promised to “normalize” monetary policy but – and I can’t say this is a surprise – hasn’t described what exactly that means.
This subject has been beaten to death so I’ll just say that the result of their policies has been questionable.
The unemployment rate has fallen back to where it was before the crisis – but wages for the vast majority of Americans still lag and the labor participation rate is at a three-decade low. Inflation is increasing but without real wage growth, corporate profit growth, and increasing consumer spending it won’t be a lasting threat.
Anyway, back to the Fed and its rates. Since 2008, the Fed dropped the federal funds rate to 0.0% and that’s where that rate sat until December of 2015 when they raised that rate by 0.25%. They once again hiked last December to 0.50%.
The Fed only has control over the very short-term (federal funds) rate as mentioned earlier, but they expect their policy to affect rates all the way out to the 30-year Treasury rate.
What the Fed can’t control is the yield curve – or, the spread between the short-term rates and long-term rates. When the market believes there’s a lot of risk for inflation and the economy growing too fast, the long-term rates will rise faster and the curve will steepen. When the opposite is believed, the curve will flatten and the spread will narrow.
The Fed doesn’t control the yield curve; the market does.
But the Fed tries to manage the market, however ham-fistedly.
Who wins in the end?
Well, when the market believes the Fed should hike, the market will hike for them by selling off Treasury bonds and raising the yield. That in turn affects mortgage rates, corporate bond rates, municipal bond rates and even car loan rates.
When the Fed loses credibility, the market takes control over the yield curve and we don’t see big reactions following every news item concerning the Fed (including just a couple of quotes in an article in the finance section of your local paper). “Fed-speak” – which is their own version of vague, technical jargon – is a valuable tool of the Fed, but as we’ve seen over the last several years, when there’s a lot of talk and no action, the tool is rendered meaningless.
The Fed’s proposed transparency – by way of their forecasts of inflation, economic growth, and jobs and wage growth – has fallen short, as have its predicted rate hikes. When Fed officials have spoken with the intention of leading the market to believe something, they expect the market to react like it’s going to happen.
But when the Feds forecasts are out of line with reality and they speak of possible action without any, the market stops believing. When the market doesn’t believe the Fed, the market sets bond prices and interest rates, not the Fed.
For now, the markets are looking at the incoming economic data and making price adjustments.
The Fed is looking at incoming data and hoping its forecast is in line with its policies. If not, the Fed will adjust its policies and its forecasts.
Don’t fight the Fed by trading against its forecasts, but you certainly don’t need to wait on the Fed to see where interest rates are going or believe what the Fed is trying to feed you!
The markets adjust very quickly and sometimes violently when the unexpected happens. That’s how my subscribers profit with Treasury Profits Accelerator. We pounce on opportunities created by surprise moves in the long-term Treasury bond market!
Good investing,
Lance Gaitan
Editor, Treasury Profits Accelerator

The post What Moves Interest Rates? appeared first on Economy and Markets.
January 24, 2017
How Will Trump Restore the Dream of the Golden Years?
President Trump has come into office with a tall order at hand, one of many, to restore faith in our ability to retire on time…. or at least come close.
But unfortunately, the reality is that the numbers aren’t in his favor… or ours.
A 2015 study by the Transamerica Center for Retirement Studies should serve as a good reality check for the state of retirement in the U.S.
According to this study, Americans believe they need $600,000 for their retirement.
Now, given that those who reach retirement age can expect to live another 20 years, this number seems reasonable.
But here’s the problem: almost no one saves that much money.
The same study reports that older workers (those at least 50 years old) have a median retirement savings of just 135,000.
That’s less than 25% of what they think they’ll need to enjoy their golden years!
Even if this $135,000 was saved by the age of 50, they would still need a combined savings and growth of $465,000 over the next 17 years to reach $600,000 by the time they could draw full Social Security benefits.
To reach this goal, they would have to contribute $11,000 into their retirement accounts every year and earn 6% on their dollars.
These are quite lofty numbers for someone nearing retirement.
If you think the retirement savings of workers 50 years and older are unimpressive, you should see the numbers reported by current retirees.
We dive deeper into these figures, looking at why people are reporting such modest nest eggs, to gain perspective on the future of the retirement landscape in our latest infographic: How Will Trump Restore the Dream of the Golden Years?

Rodney
Follow me on Twitter @RJHSDent

The post How Will Trump Restore the Dream of the Golden Years? appeared first on Economy and Markets.
January 23, 2017
401(k) Investing Grandma Would be Proud Of
 Earlier this month, I did my best impression of a grumpy old man, letting my glasses slide down my nose while I shook a rolled-up newspaper in your general direction.
I hope you understand that it’s not personal. I actually hate being a nag like that. In fact, it’s a little like what my parents used to tell me before giving me a good spanking as a kid: “This is going to hurt me a lot more than it’s going to hurt you.” But we’re talking about your retirement, so it really is for your own good.
Today, I want to take a more serious look at the 401(k) because it has an outsized impact on your ability to retire. You could make any number of trading mistakes over the course of your investing life and still cruise into retirement with no major nicks or dings. But if you botch your 401(k), you might not make it to the finish line at all.
And from the looks of things, most Americans have seen their retirement planning stall out. According to Vanguard, the median 401(k) plan had a balance of only $26,405 as of the end of 2015.
So, as we settle into a new year of investing, let’s get a few facts straight.
1) Investing in a 401(k) does not mean investing in stocks.
Whenever I hear someone tell me that they don’t invest in their 401(k) because they’re scared of the stock market, I’m not sure whether I should pity them or take them outside and give them a good slapping around.
Hey, I’m scared of the stock market too. I’ve been writing for the past two years that at current valuations, the S&P 500 is priced to deliver returns that are, at best, flat over the next eight to 10 years. And Harry thinks the market could be a lot worse than that.
But a 401(k) is not “the market.” It’s an account. You’re free to put stocks in it… or not. You can leave the entire balance in a money market fund if you feel that’s the best move. Depending on your plan sponsor, you might even be able to buy commodities or foreign currencies if that sort of thing strikes your fancy.
Again, the takeaway here is that a 401(k) plan is an account type and not an investment in and of itself. This matters because…
2) A dollar invested in a 401(k) is worth more than a dollar invested outside of one.
This is probably best explained by example. Let’s say you have $1,000 invested in your 401(k) earning 5% interest and another $1,000 invested in a taxable bank account, also earning 5% interest. Let’s also assume you’re in the 25% tax bracket for good measure.
Now, realize that the 5% you earned at the bank isn’t really 5%. It’s 3.75% once you’ve paid the taxes on it. And while that 1.25% difference amounts to a whopping $12.50 in a single year, remember that interest compounds.
That $1,000 compounded at 5% for 20 years turns into $2,653. But the $1,000 compounded at 3.75% for 20 years turns into just $2,088. Now imagine that same scenario playing out, but with many thousands of dollars invested over a lifetime. I don’t know about you, but I’m not comfortable leaving that kind of money on the table.
So, if you’re already being diligent about saving, do yourself a major favor and put those savings within a tax-sheltered vehicle like a 401(k) plan.
3) Always remember that money is fungible.
I know, I know. It’s snobby to use an SAT word like “fungible.” But this too is probably best explained by example. You can move a dollar from your left pocket to your right pocket, and it’s still the same dollar. It’s in a different pocket, but it still spends the same. I encourage you to think of your savings the same way.
Let’s say that you really want to max out your contributions to your 401(k) plan for the full $18,000, but at your current income level that’s just not a realistic goal. But let’s also say that your dear, sweet grandmother left you a nice $50,000 inheritance. Well, you can now max out your 401(k) plan and use Grandma’s money to make up any shortfall in your budget.
Perhaps you need $75,000 in take-home pay to make ends meet, but after maxing out your 401(k) contributions you’re about $10,000 short. Well, you can spend down your inheritance $10,000 per year over the next five years, which would effectively convert your taxable savings to tax-deferred 401(k) savings.
And don’t worry, Grandma won’t mind. If your grandmother was anything like mine, she would approve of your good common sense and frugality.

Charles Sizemore
Editor, Dent 401k Advisor
P.S. If you’d like to know more about 401(k) allocations, I encourage you to check out my quarterly retirement newsletter, Dent 401k Advisor. I just released the Q1 report for 2017, and offer insight on how to best be positioned for the next three months. Check it out.

The post 401(k) Investing Grandma Would be Proud Of appeared first on Economy and Markets.
January 20, 2017
Trump’s Magic Wand: I Simply Don’t Buy It!
 As Trump is inaugurated today, it seems most people are feeling better about the economy. Even a more liberal analyst said yesterday in an interview that he thought Trump should raise the minimum wage to $15 to stimulate demand!
Seriously?!
A Bernie Sanders, far-left strategy in a Republican Congress?
How delusional can you get?
The problem, as usual, is that economists, analysts and politicians don’t understand the real causes of our economic malaise since 2007, including Trump.
It’s not primarily business regulations, or higher taxes. Altogether, U.S. personal and business taxes combined are less than any major country in Europe, or Australia or Canada!
The problems are…
Slowing demographic trends (a factor even more prevalent in Europe and East Asia);
And unprecedented levels of debt and entitlements (here and everywhere else).
And there’s nothing near term President Trump can do about either of those things!
I think Trump is setting himself up for a massive disappointment in the year ahead.
Since we’re not in a supply-side crisis like we were in the late 1970s and early 1980s when Ronald Reagan came in, those solutions aren’t the answer. They worked then. They will NOT work now. And who are Trump’s chief economic advisors? Larry Kudlow, Stephen Moore, and Art Laffer – all zealous supply-siders.
Instead, we’re in a demand-side crisis like what we saw in the early 1930s with global oversupply. In such a situation, cutting taxes will only create even faster growing deficits and debt, not investment in new capacity and jobs.
Besides, does Trump really think a Republican Congress is going to just approve of massive tax cuts and infrastructure investments that raise our already out of control public debt, just as the debt ceiling has to be raised above $20 trillion?
No way!
It’s been doubling every eight years in Republican and Democratic administrations and, at this rate, will be nearing a cool $40 trillion just eight years from now.
Debt bubbles always create over-supply in business and falling demand from excessive consumption and debt burdens. They also create bubbles in financial assets that will always burst.
Donald himself said we have a big fat, ugly bubble… what is he thinking?!
He’s walking into a world of ever-increasing geopolitical conflicts, increasing threat of trade wars – especially created by him – declining demographic trends and crushing debt burdens.
And you’re going to fix that by cutting some regulations and reducing taxes? Reducing taxes just shifts the pie from government to business – and larger businesses more typically.
Of course not!
All that will do is make that top 0.1% and 1% even richer and do nothing for the average worker that elected Trump.
I recently wrote to you about the jobs market, which is a lagging indicator, not a leading one. We’ve simply been hiring back workers that lost their jobs massively in the great recession, and now we’re nearly done on that at 4.6% unemployment.
Do you know what the natural rate of workforce growth is once we hit full employment? NEGATIVE into 2023 and then only around 0.2% after that for decades.
Since older workers don’t get more productive, we have gone back to just 0.4% productivity rates. That’s nearly as low as at the bottom of our last long recession in the 1970s and early 1980s when the Bob Hope generation was retiring rapidly.
Baby boomers have been retiring predictably since 1998. With that has come declining workforce participation rates. It peaked at 67%. It’s now at 62%. It’s heading towards 58% by 2024 – over Trump’s potential two terms.
So how do you create 4% growth from a declining workforce, with declining productivity?
YOU DON’T!!!
There’s no question in my mind that Trump’s promises will lead to the biggest economic disappointment this side of the Great Depression.
The only questions I DO have is how long it will take the markets to figure out this out for themselves…
Anytime now, Italy and southern Europe could default.
China’s massive bubble could blow – maybe even triggered by Trump tightening their trade with the U.S.
Or, what if we suddenly saw job growth drop from that 150,000 to 200,000 each month to just 100,000 or even much less? (Never mind that payroll tax data already suggests job growth is lower than reported.)
President Trump was inaugurated today. I sincerely wish him the best of luck. But I have serious doubts that he’ll last his first year without a major debacle and backlash.
At this point I would give the Trump rally through about July and then we could see one of those first, devastating bubble crashes that sees the markets down 30% to 40% in a few months.
I’ll reserve judgement on that until I see some divergences build in the markets, and small caps are likely to be where that happens because they’ve rallied the most irrationally since the election.
But I just don’t buy all the Trump euphoria. And am surprised at how many intelligent people do.
God bless America… or maybe that should be, God help America.

Harry
Follow me on Twitter @harrydentjr

The post Trump’s Magic Wand: I Simply Don’t Buy It! appeared first on Economy and Markets.
January 19, 2017
Wall Street Doesn’t Want You to be a Good Investor
 I spent over 20 years on Wall Street, slicing and dicing earnings reports, hundreds – sometimes thousands – of pages long to find out what companies were really worth. For better or for worse.
From that, I came away with a wealth of knowledge that’s convinced me of this rather uncomfortable truth: Not only do many of the companies you own stakes in right now not have your best interests at heart, but they are flat out lying to you. And even the analysts on Wall Street and the talking heads in the financial news media seem to be in on the con.
Even worse… it’s 100% legal for these companies to be feeding you these lies.
They truly do not want you to be a well-informed, well-educated investor.
They don’t want you to know all the details about the products you’re buying, or ask questions, be patient, and use common sense when investing.
Instead, they want you to believe investing is too hard — and too complicated — for you to be any good at it on your own.
This means you’re forced to blindly trust that what a company is telling you about their numbers… the health of their business… and their prospects for the future, are 100% FACTS.
And they want you to hand over your hard earned money that’s taken you decades to save — without question.
What if I told you that this describes up to 95% of companies currently trading on the stock market today? That these companies are essentially stealing money right out of your pocket!?
These are some of the biggest names in the corporate world… companies that trade millions of shares a day, who you might be invested in right now (I reveal some of these names in the infographic below).
But where is this money going?
Right into the wallets of CEOs.
In fact, in many of these “bandit” companies, CEOs are earning over 300-times more than their own employees!
After spending over two decades on Wall Street, I now spend my days as a forensic accountant, helping everyday investors like you, rather than the corporate executives and insiders looking to add another million to their net worth.
Give our latest infographic, How CEOs are Earning 335x MORE Than Their Own Employees a read to discover more about just how far this Wall Street deceit goes… and how you can still uncover many more lucrative opportunities in the stock market today!


John Del Vecchio
Editor of Forensic Investor

The post Wall Street Doesn’t Want You to be a Good Investor appeared first on Economy and Markets.
January 18, 2017
Job Creation Could Fall off a Cliff in the Months Ahead
[image error]Let’s do a quick thought experiment…
Imagine you’ve got two people in the workforce. Let’s say one is 40 and the other 65.
When both are gainfully employed, the unemployment rate is 0%. We’re enjoying full employment within the labor pool.
During the recession, the 40-year-old loses his job. With only two people in the labor pool, that means only half of the working age population that wants a job, has a job. Unemployment is at 50%. Ouch.
As the economy recovers, the 40-year-old once again finds work. However, he’s earning less than he was before.
Great news, sort of. The economy is once again at 100% employment and everyone cheers that the unemployment numbers saw such a major jump, even though average income is down.
But…
A few months later, the 65-year old retires. His departure, however, doesn’t create an unemployment level of 50%. Employment remains at 100%.
How’s that possible?
While it’s true that while the retiree is in the potential labor force, he’s choosing not to participate by retiring. So the workforce has shrunk by one person, meaning that the remaining person is now the entire workforce. Seeing as he’s gainfully employed, everything looks rosy!
Only, is it really? In our example, the economy will slow even though unemployment looks great.
Yes, I realize that I’m oversimplifying something much more complicated here. But my point (and warning) couldn’t be any clearer…
As the boomers leave the economy by the millions, even if we replace them, the workforce won’t grow substantially, and our economy will remain stuck in the ditch!
There is no way Trump will be able to achieve the 3% to 4% growth he’s promising because workforce growth is declining as baby boomers shuffle into their retirement years in staggering numbers, more than offsetting the millennial generation entry for several years.
All these fantastic unemployment numbers we’ve been seeing each month? They’re simply lipstick on a pig.
Workforce growth – from the natural forces of people entering at age 20 and exiting at age 63 on average – is in decline into the early 2020s. After that, it only grows slightly above zero, at best, for decades to follow.
Our productivity, what with the aging of our society, is back to 0.4%. That’s nearly as low as what it was near the top of the Bob Hope generation retirement cycle in 1983 and at the bottom of the spending wave back then.
And that’s the crux of our problem.
That right here is why it’s demographically impossible for Trump to succeed in stimulating 4% growth.
Sure, we’ve now moved to as low as 4.6% unemployment. That’s well into the full employment zone between 3.8% (2000) and 5.0% (1989) range. In the last peak in 2007, the unemployment rate hit a low of 4.4%, just below where we are now.
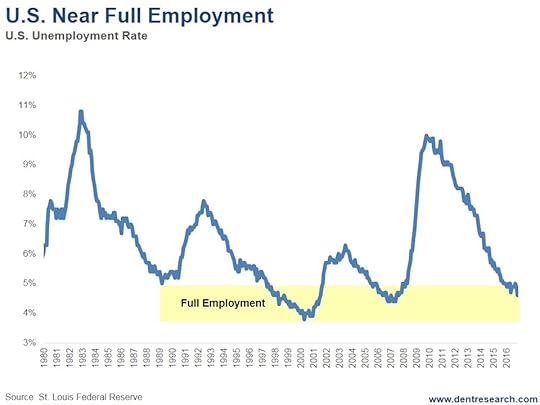
However, and this is a big one: We’ve simply hired back most of the workers we lost in the great recession! Those 150,000 to 200,000 monthly jobs numbers we keep seeing cannot last more than several months, at most. And when they suddenly drop to 50,000 (or less), that could be the shock that causes a sharp bubble crash of 30% to 40% into the fall.
Some economists would argue that there are still people that left the workforce that are no longer looking for work and we could draw them back in. I say good luck on that one. Look at this next chart. It shows that labor force participation peaked between 1998 and 2000 at 67% and has been falling ever since (note the inverted scale). This correlates directly with the rising retirement wave for the massive baby boom on a 63-year lag.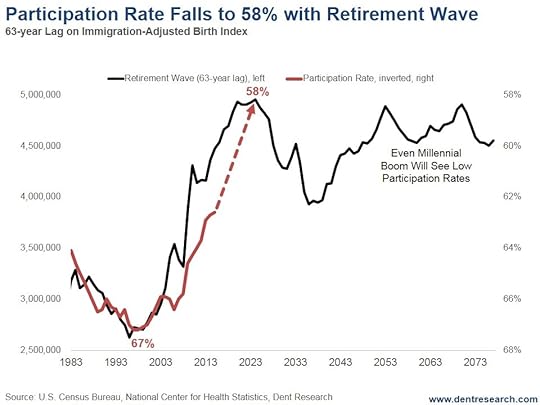
That high of 67% occurred just as the baby boomers were starting to retire and near the lowest unemployment rate of the entire boom at 3.8% ‑ no accident.
It doesn’t take a genius to get that rising retirees means lower labor force participation, especially when it predictably exceeds new entry by younger people.
This chart indicates that participation will fall to around 58% from the current level of 62.6%! This would occur into around 2024, which is the peak of the 63-year lag for baby boom retirement.
That’s another potential 4.6% loss of our workforce – or 0.58% per year over the next eight years – without a recession or depression. That’s 920,000 people a year just gone from the workforce! How do you offset that with lower taxes and who are you going to build these new infrastructures for? Not older people who need less of everything except health care… and nursing homes.
If we’re going to build new infrastructures, nursing homes should be it!
There is also another factor…
As two-worker households see their kids leave the nest, one will often choose to retire early or switch to part-time work. That has been a part of the drop-out rate thus far… These people aren’t coming back either.
So, here’s the reality. By sometime this summer or so, we could hit 4.4% or lower unemployment and then suddenly see job growth drop to 50,000, if not lower… with no obvious recessionary signs or economic crises at first.
How are the markets going to feel about Trump’s 4% growth revival then?
I smell the typical, first dramatic 2- to 3-month typical bubble crash of 30% to 40% when this happens, most likely between late July and late October of 2017.
How do you like them apples?
I still say Trump will likely be stumped or dumped by the end of this year.
Harry
Follow me on Twitter @harrydentjr

The post Job Creation Could Fall off a Cliff in the Months Ahead appeared first on Economy and Markets.


