David Clinton's Blog, page 5
November 10, 2017
A brief overview and history of systemd — the Linux process manager
Intelligently running Linux services includes knowing how to test for their status which, in turn, requires understanding how modern Linux distributions manage processes. This article — excerpted from the early access edition (MEAP) of my new Manning book “Linux in Action” (which is available for 37% off using the code fcclinton3), will briefly explore the function and history of systemd — the process manager that seems to be loved, feared, and hated in equal parts.
Something on your Linux box isn’t running? Troubleshooting is your friend. But before you even get there, shouldn’t you make sure the underlying service is actually running? Sometimes the configuration files are by default set to inactive.
You can use systemctl status to find out whether a service — OpenSSH in this example — is running on your machine:
$ systemctl status ssh
● ssh.service - OpenBSD Secure Shell server
Loaded: loaded (/lib/systemd/system/ssh.service; enabled; vendor preset: enabled)
Active: active (running) since Mon 2017-05-15 12:37:18 UTC; 4h 47min ago
Main PID: 280 (sshd)
Tasks: 8
Memory: 10.1M
CPU: 1.322s
CGroup: /system.slice/ssh.service
├─ 280 /usr/sbin/sshd -D
├─ 894 sshd: ubuntu [priv]
├─ 903 sshd: ubuntu@pts/4
├─ 904 -bash
├─1612 bash
├─1628 sudo systemctl status ssh
└─1629 systemctl status ssh
[...]
In this case, as you can see from the Active line of the output, everything is fine. If you did have to crank it up yourself though, you’d use systemctl once again, but this time with start in place of status. Bored with your new toy? systemctl stop will put it away for you.
# systemctl stop ssh
That systemctl fellow seems nice enough, but we’ve barely had the chance to meet him. Let’s dig a big deeper.
Linux process management
First, just what is systemctl and what’s it actually doing? To properly answer that question, you’ll have to think for a bit about how Linux manages system processes in general. And since it’s always nice to meet new friends, you will also learn about some process tracking tools to make understanding the way things work easier.
Software, as I’m sure you already know, is programming code containing instructions to control computer hardware on behalf of human users. An operating system is a tool for organizing and managing software packages so that they can effectively leverage a computer’s hardware resources. Organizing and managing processes for a complex multi-process and multi-user operating environment is no simple task. To make it work, you’ll need some kind of traffic cop to tightly control the many moving parts. Let me introduce you to systemctl, a hard-working officer in the traffic division of the Linux Police Department.
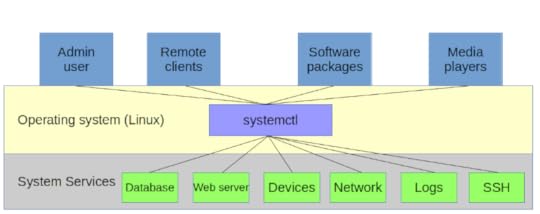
The availability and responsiveness of many system services are managed by systemd’s systemctl process manager
Viewing processes with the ps command
Let’s pull out an electron microscope and see if we can’t spot an actual process in its natural habitat. The very first process to wake up and get everything else going when a Linux computer boots is called init (although as we’ll soon discover, that name can be misleading). You can see for yourself that init is first by running the following ps command exactly the way it’s printed here — I’ll explain the details in just a minute.
$ ps -ef | grep init
root 1 0 0 12:36 ? 00:00:00 /sbin/init
ubuntu 1406 904 0 16:26 pts/4 00:00:00 grep --color=auto init
The rightmost column of output (/sbin/init on the first line) represents the location and name of the file behind the process itself. In this case, it’s a file called “init” that lives in the /sbin directory. The leftmost column on this first line contains the word root and tells us that the owner of this process is the root user. The only other piece of information that interests us right now is the number 1, which is the process ID (PID) of the init process. The only way you’re going to get PID 1 is by getting there before anyone else.
By the way, the second line displayed by that ps command is the process assigned to the grep command itself. Note how its owner is ubuntu (my username) and its PID is much higher than 1.
Before moving on it’s worth spending a bit more time with ps. As you’ve seen, ps displays information about active processes. It’s often important to have access to process-related information so we can properly plan and troubleshoot system behavior. You can expect to use ps early and often.
If you were to type just ps and run it, you’d probably get only two results: the first, a process called bash that represents the Bash command interpreter being used by your current shell session, and the most recent command (which, of course, was ps). But by looking at the PID assigned to Bash (7447, in this example), you just know there are lots and lots of other processes already hard at work somewhere on your system. These will have been spawned by parent shells going all the way back to the init process itself.
$ ps
PID TTY TIME CMD
7447 pts/3 00:00:00 bash
8041 pts/3 00:00:00 ps
Adding the -e argument to ps as we did above will return not only the processes running in your current child shell, but all the processes from all parent shells right back up to init.
A parent shell is a shell environment from within which new (child) shells can subsequently be launched and through which programs run. You can think of your GUI desktop session as a shell, and the terminal you open to get a command line as its child. The top level shell (the grandparent?) is the one that is run first when Linux boots.
If you want to visualize parent and child shells/processes, you can use the pstree commmand (adding the -p argument to display the PID numbers for each process). Note how the very first process (assigned PID 1) is systemd. On older versions of Linux, this would have been called init instead.
$ pstree -p
systemd(1)─┬─agetty(264)
├─agetty(266)
├─agetty(267)
├─agetty(268)
├─agetty(269)
├─apache2(320)─┬─apache2(351)
│ ├─apache2(352)
│ ├─apache2(353)
│ ├─apache2(354)
│ └─apache2(355)
├─cron(118)
├─dbus-daemon(109)
├─dhclient(204)
├─dockerd(236)─┬─docker-containe(390)─┬─{docker-containe}(392)
│ │ └─{docker-containe}(404)
│ ├─{dockerd}(306)
│ └─{dockerd}(409)
├─mysqld(280)─┬─{mysqld}(325)
│ ├─{mysqld}(326)
│ └─{mysqld}(399)
├─nmbd(294)
├─rsyslogd(116)─┬─{in:imklog}(166)
│ ├─{in:imuxsock}(165)
│ └─{rs:main Q:Reg}(167)
├─smbd(174)─┬─smbd(203)
│ └─smbd(313)
├─sshd(239)───sshd(840)───sshd(849)───bash(850)───pstree(15328)
├─systemd-journal(42)
└─systemd-logind(108)
Go ahead and try all these commands on your own machine. Even on a quiet system, you’ll probably see dozens of processes; a busy desktop PC or server can easily have thousands.
Working with systemd
There’s something interesting about that /sbin/init file we just saw. “file” is a venerable Unix program that gives you insider information about a file. If you run file with /sbin/init as its argument, you’ll see that the init file is not actually a program, but simply a symbolic link to a program called systemd.
$ file /sbin/init
/sbin/init: symbolic link to /lib/systemd/systemd
After many years of fragmentation and some vigorous political infighting, nearly all Linux distributions now use the same process manager: systemd. systemd is a drop-in replacement for the init process. By “drop-in replacement” I mean that, even if the way it gets things done can be quite different, to the casual observer, systemd functions just like init always did. That’s why the /sbin/init file is now really nothing more than a link to the systemd program.
This is all a bit theoretical since you’ll probably never actually invoke the systemd program itself by name — either directly or through its /sbin/init front end. This is because, as you’ve already seen, the key administration tasks are handled by systemctl on behalf of systemd.
Technically, systemd’s primary job is to control the ways individual processes are born, live their lives, and then die. The systemctl command we used above is the tool of choice for those tasks. But — somewhat controversially — the systemd developers expanded the functionality far beyond the traditional role of process management to take control over various system services. Included under the new systemd umbrella are tools like a logging manager (journald), network manager (networkd), and device manager (you guessed it: udevd). Curious? The “d” stands for daemon; a background system process.
This article is adapted from chapter 3 (Remote connectivity: safely access networked machines) of my Manning “Linux in Action” book. There’s lots more fun where this came from. Who knows…you might also enjoy my recently published Learn Amazon Web Services in a Month of Lunches.


AWS AMIs: another way to roll your own Linux distros
Open source should be a team sport. Since you’re free to download the code and rewrite it to fit your needs, you should also feel free to share your customizations with your closest friends and family. Over the years, Linux, the centerpiece of the open source world, has been spun into hundreds of distributions (or, “distros’ as they’re more commonly called). Think there’s an underserved niche no one else has addressed? Does your own business need a purpose-built OS environment to fit its unique workflow? Then by all means, customize away.
Creating your own distro doesn’t mean you’ll have to crack open the kernel and fight your way through arcane system calls and ISAs. You can simply install your own software, reset some environment variables, or just install a couple of customizing scripts and, assuming your name is Linda, you can call it Lindux (but that’s your call).
Still, no matter how simple your distro turns out, getting it all packaged up into an ISO archive to share with the world can get really complicated, really fast. Don’t believe me? Just search the internet for guides and tools to “build your own Linux distro” and note how many there are, how many steps each requires, and also how many of the tools have been abandoned as new upgrades to a base distro render them useless.
I’m not trying to discourage you. If you’ve got the new distro bug and you’re up to the challenge, by all means, dive in and build us a great one using traditional tools. But if all you’re after is a custom-built Linux server image that will run in the AWS cloud, then there’s a much simpler approach.
As I describe in some detail in my new Manning book “Learn Amazon Web Services in a Month of Lunches,” the basic virtual machine powering many AWS workloads is the Elastic Compute Cloud (EC2) server instance. EC2 instances come with a nice range of operating systems pre-installed, but the overwhelming majority are running one flavor or another of Linux.

Learn Amazon Web Services in a Month of Lunches
So here’s what you can do:
Select and launch an EC2 instance built with your choice of Linux distributions. This will be the base for your own distro.
Log into your instance using SSH and install the software and environment settings you’ll need for your own distro.
Create an image of your instance (which will effectively be a perfect copy of the instance’s current state). As an Amazon Machine Image (AMI), this image could be made publicly available for anyone to launch within their own AWS accounts. Or you could keep it private to share just among your own team members.
Effectively, the AWS AMI becomes a single tool for both packaging and distributing your image all wrapped up in one. Perhaps it’s not quite 100% accurate to call what comes out the other end a distro – and it’s pretty useless if you‘re looking to provide a desktop GUI experience – but it will work a whole lot faster and easier than just about any alternative.
How does it all work? Here’s the short version. Select the running EC2 instance you want to copy in the EC2 Instances dashboard. Then click Actions, and select Image and then Create Image.
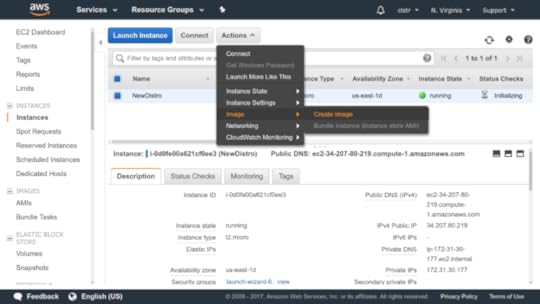
Create a new image based on a running instance
After a few minutes, a new image should appear on the AMI s page of the EC2 dashboard. The next time you launch a new instance from the EC2 dashboard and arrive at the Choose an Amazon Machine Image page, click the My AMIs tab: your new AMI should be there, waiting to be selected. If you chose to make your image public, then other users will find it in the Community AMIs tab.
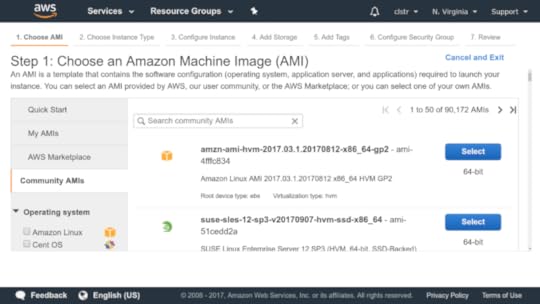
Public AMIs are available from this tab
But where’s the fun in that? If you want to play like the pros, you’ll install and authenticate the AWS CLI and run this through their API.
This is how you’d launch an AMI image by referencing the image ID (as far as I know, this one isn’t active, by the way):
$ aws ec2 run-instances --image-id ami-5cf5c74b \
--count 1 --instance-type t2.micro \
--key-name mykey --security-group-ids sg-7a4d6200
Let’s go through that one step at a time:
aws ec2 run-instances runs a new instance whose details will follow.
image-id ami-5cf5c74b identifies the AMI ’s ID . You can get this information from the AMI page of the EC2 dashboard, or from the
CLI using
aws ec2 describe-images --owners self .
count 1 specifies that you want to launch only one instance of this image.
instance-type t2.micro is the instance type.
key-name mykey is the name of the key pair you’ll use to access the instance once it’s running. This example uses plural — a key-
name example from a previous chapter.
security-groups sg-7a4d6200 is the name of an existing security group you’ll use; you can find it using aws ec2 describe-security-groups . The ID displayed here is unique to the group in my account’s VPC . You’ll need to use a group ID from your own account.
Head back to the Console. You’ll see your new instance initializing, and eventually you’ll see a new copy of your Linux “distro” happily running.
This article is partly adapted from my Manning “Learn Amazon Web Services in a Month of Lunches” book. It was also published on Medium. And there’s more where this came from. Check out my other books.
The Ubuntu Recovery Menu: demystifying Linux system recovery
This article is adapted from the chapter “Emergency tools: build a system recovery device” in my Manning book Linux in Action (use discount code fccclinton3 for 37% off).
Don’t try to convince yourself otherwise: along with all the good stuff, you’re going to have bad days with Linux.
You (or the users you support) are going to mistype commands and permanently destroy documents.
You’re going to experience that sinking feeling when you realize that some really important piece of hardware or software has just gone and failed. That’s gratitude after everything you did for it all those years.
Being properly backed up means that you can walk away from a non-functioning OS or computer and rebuild it all somewhere else. But that’s always going to be Plan B. Plan A is to recover.
Using recovery mode on Ubuntu
Linux not letting you log in normally (perhaps the boot process unexpectedly stops before displaying the login screen, for instance)? You’ll want some basic system administration tools.
But wait: if Linux won’t load, how are you going to launch those tools? Well, even if Linux won’t load all the way to a normal command prompt, often it’ll get you to the GRUB menu. From there you can use the up and down arrow keys and then Enter to select a Linux kernel running in recovery mode which, as you’ll soon see, will open up a whole bag of tricks.
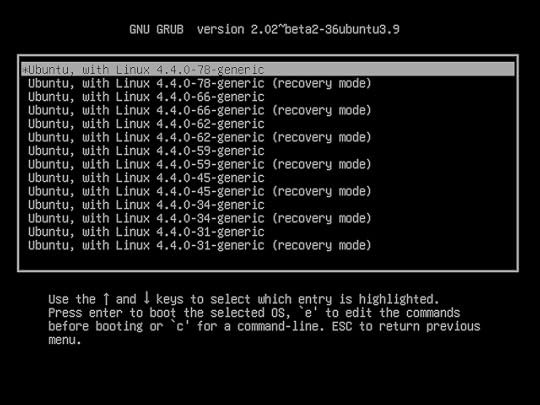
The GRUB “Advance options” menu of an Ubuntu installation with links to both current and older kernel versions along with options for launching in recovery mode
As you can see from the figure below, once Ubuntu is loaded in recovery mode, you’ll be shown a menu of tools that address some common boot-time problems. It’s worth trying each one that seems like it might address your root problem. “Clean”, for instance, will remove unused files if you suspect the trouble stems from a full disk. “dpkg” will attempt to fix any broken apt-based software packages that might be gumming things up. (The “dpkg” tool might require that you first enable networking.)
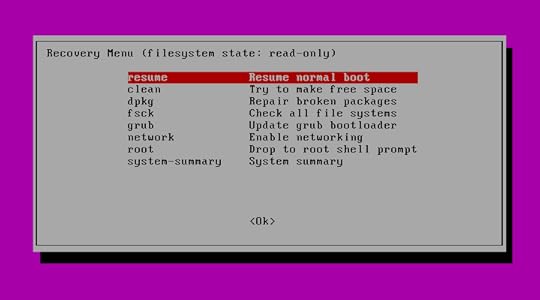
The Ubuntu Recovery Menu with links to some basic diagnostic and repair tools, along with the option of opening a shell session as “root”
The “root” option will open a root command line shell session for you where you’ll have Bash at your disposal. In general, using a simple shell session for recovery rather than a full GUI desktop makes a lot of sense, because the fewer complicated services you’ve got running, the more likely it is that you’ll be able to at least get your system running. Once you do manage to get a working command prompt, you can start poking around to see if you can identify and fix the problem.
But at the very least, you’ll look mighty cool doing it.
But what are those tools? Got an Ubuntu machine running? Go take a look for yourself. The code running the menu must already exist somewhere within an Ubuntu file system. Use “locate” to find it.
$ locate recovery-mode
/lib/recovery-mode
/lib/recovery-mode/l10n.sh
/lib/recovery-mode/options
/lib/recovery-mode/recovery-menu
/lib/recovery-mode/options/apt-snapshots
/lib/recovery-mode/options/clean
/lib/recovery-mode/options/dpkg
/lib/recovery-mode/options/failsafeX
/lib/recovery-mode/options/fsck
/lib/recovery-mode/options/grub
/lib/recovery-mode/options/network
/lib/recovery-mode/options/root
/lib/recovery-mode/options/system-summary
Note that the “l10n.sh” script sets appropriate environment variables for the menu. If you navigate over to the /lib/recovery-mode/ directory you’ll see that the “recovery-menu” file is the script that displays the menu interface that you saw above. The /lib/recovery-mode/options/ directory contains files for executing each of the menu items…like “fsck” that will check and, if possible, fix any broken file systems.
Since, based on previous chapters in the book, you’re now an accomplished Bash scripting expert, why not take a look at each of the scripts in the options/ directory to see if you can figure out how they work. Here are the contents of the “fsck” script to get you going. Note the way the script is nicely documented (using the “#” character) to help you understand what’s going on.
$ cat /lib/recovery-mode/options/fsck
#!/bin/sh
. /lib/recovery-mode/l10n.sh
if [ "$1" = "test" ]; then
echo $(eval_gettext "Check all file systems")
exit 0
fi
# Actual code is in recovery-menu itself
exit 0
Here are a couple of things you can try on your own:
Manually run the “clean” script on a Debian/Ubuntu machine. What happened?
Then try carefully editing the /lib/recovery-mode/recovery-menu script (make a backup copy first). Perhaps just change something simple, like the menu title or one of the script descriptions. Then reboot your machine and, from the GRUB menu, go into Recovery Mode to see what it looks like.
With some variations and exceptions, you should be able to put those examples to good use elsewhere.
This article is adapted from chapter 6 (Emergency tools: build a system recovery device) of my Manning “Linux in Action” book. It was also published on Medium. There’s lots more fun where this came from. Who knows…you might also enjoy my recently published Learn Amazon Web Services in a Month of Lunches.
High Availability: Concepts and Theory
This article is adapted from chapter 7 of my book, Teach Yourself Linux Virtualization and High Availability: prepare for the LPIC-3 304 certification exam .
Let’s focus more on some of the larger architectural principles of cluster management than on any single technology solution. We get to see some actual implementations later in the book – and you can learn a lot about how this works on Amazon’s AWS in my Learn Amazon Web Services in a Month of Lunches book from Manning. But for now, let’s first make sure we’re comfortable with the basics.
Running server operations using clusters of either physical or virtual computers is all about improving both reliability and performance over and above what you could expect from a single, high-powered server. You add reliability by avoiding hanging your entire infrastructure on a single point of failure (i.e., a single server). And you can increase performance through the ability to very quickly add computing power and capacity by scaling up and out.
This might happen through intelligently spreading your workloads among diverse geographic and demand environments (load balancing), providing
backup servers that can be quickly brought into service in the event a working node fails (failover), optimizing the way your data tier is deployed, or allowing for fault tolerance through loosely coupled architectures.
We’ll get to all that. First, though, here are some basic definitions:
Node: A single machine (either physical or virtual) running server operations independently on its own operating system. Since any single node can fail, meeting availability goals requires that multiple nodes operate as part of a cluster.
Cluster: Two or more server nodes running in coordination with each other to complete individual tasks as part of a larger service, where mutual awareness allows one or more nodes to compensate for the loss of another.
Server failure: The inability of a server node to respond adequately to client requests. This could be due to a complete crash, connectivity problems, or because it has been overwhelmed by high demand.
Failover: The way a cluster tries to accommodate the needs of clients orphaned by the failure of a single server node by launching or redirecting other nodes to fill a service gap.
Failback: The restoration of responsibilities to a server node as it recovers from a failure.
Replication: The creation of copies of critical data stores to permit reliable synchronous access from multiple server nodes or clients and to ensure they will survive disasters. Replication is also used to enable reliable load balancing.
Redundancy: The provisioning of multiple identical physical or virtual server nodes of which any one can adopt the orphaned clients of another one that fails.
Split brain: An error state in which network communication between nodes or shared storage has somehow broken down and multiple individual nodes, each believing it’s the only node still active, continue to access and update a common data source. While this doesn’t impact shared-nothing designs, it can lead to client errors and data corruption within shared clusters.
Fencing: To prevent split brain, the stonithd daemon can be configured to automatically shut down a malfunctioning node or to impose a virtual fence between it and the data resources of the rest of a cluster. As long as there is a chance that the node could still be active, but is not properly coordinating with the rest of the cluster, it will remain behind the fence. Stonith stands for “Shoot the other node in the head”. Really.
Quorum: You can configure fencing (or forced shutdown) to be imposed on nodes that have fallen out of contact with each other or with some shared resource. Quorum is often defined as more than half of all the nodes on the total cluster. Using such defined configurations, you avoid having two subclusters of nodes, each believing the other to be malfunctioning, attempting to knock the other one out.
Disaster Recovery: Your infrastructure can hardly be considered highly available if you’ve got no automated backup system in place along with an integrated and tested disaster recovery plan. Your plan will need to account for the redeployment of each of the servers in your custer.
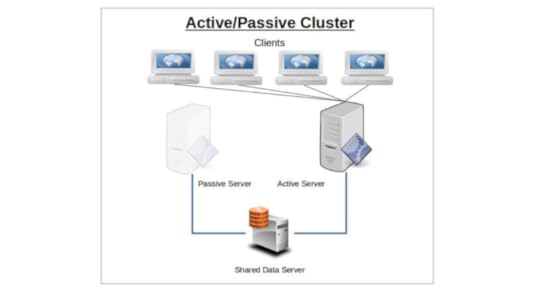
Active/Passive Cluster
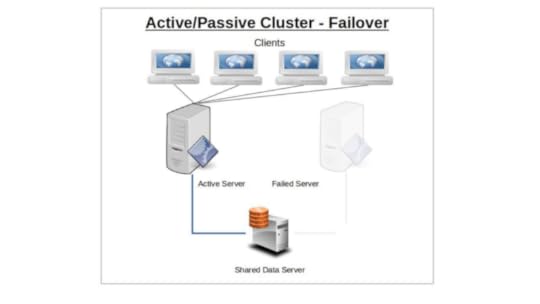
The idea behind service failover is that the sudden loss of any one node in a service cluster would quickly be made up by another node taking its place. For this to work, the IP address is automatically moved to the standby node in the event of a failover. Alternatively, network routing tools like load balancers can be used to redirect traffic away from failed nodes. The precise way failover happens depends on the way you have configured your nodes.
Only one node will initially be configured to serve clients, and will continue to do so alone until it somehow fails. The responsibility for existing and new clients will then shift (i.e., “failover”) to the passive — or backup — node that until now has been kept passively in reserve. Applying the model to multiple servers or server room components (like power supplies), n+1 redundancy provides just enough resources for the current demand plus one more unit to cover for a failure.
Active/Active Cluster
A cluster using an active/active design will have two or more identically configured nodes independently serving clients.
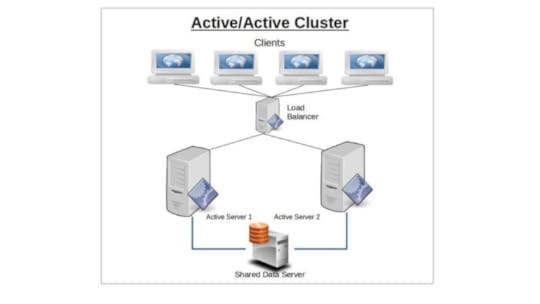
Should one node fail, its clients will automatically connect with the second node and, as far as resources permit, receive full resource access.
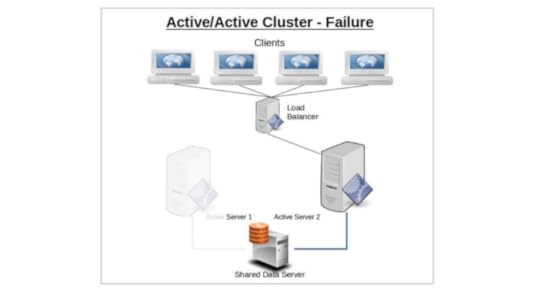
Once the first node recovers or is replaced, clients will once again be split between both server nodes.
The primary advantage of running active/active clusters lies in the ability to efficiently balance a workload between nodes and even networks. The load balancer — which directs all requests from clients to available servers — is configured to monitor node and network activity and use some predetermined algorithm to route traffic to those nodes best able to handle it. Routing policies might follow a round-robin pattern, where client requests are simply alternated between available nodes, or by a preset weight where one node is favored over another by some ratio.
Having a passive node acting as a stand-by replacement for its partner in an active/passive cluster configuration provides significant built-in redundancy. If your operation absolutely requires uninterrupted service and seamless failover transitions, then some variation of an active/passive architecture should be your goal.
Shared-Nothing vs. Shared-Disk Clusters
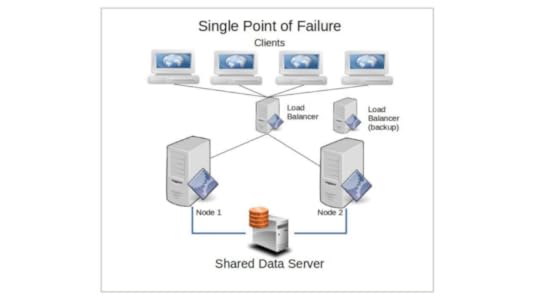
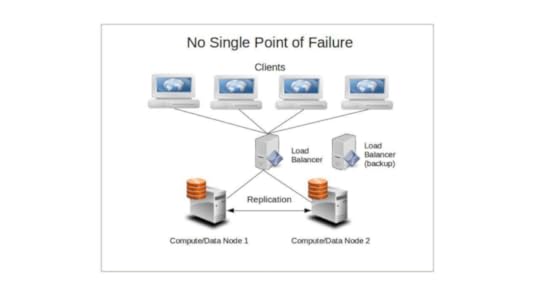
One of the guiding principles of distributed computing is to avoid having your operation rely on any single point of failure. That is, every resource should be either actively replicated (redundant) or independently replaceable (failover), and there should be no single element whose failure could bring down your whole service.
Now, imagine that you’re running a few dozen nodes that all rely on a single database server for their function. Even though the failure of any number of the nodes will not affect the continued health of those nodes that remain, should the database go down, the entire cluster would become useless. Nodes in a shared-nothing cluster, however, will (usually) maintain their own databases so that — assuming they’re being properly synced and configured for ongoing transaction safety — no external failure will impact them.
This will have a more significant impact on a load balanced cluster, as each load balanced node has a constant and critical need for simultaneous access to the data. The passive node on a simple failover system, however, might be able to survive some time without access.
While such a setup might slow down the way the cluster responds to some requests — partly because fears of split-brain failures might require periodic fencing through stonith — the trade off can be justified for mission critical deployments where reliability is the primary consideration.
Availability
When designing your cluster, you’ll need to have a pretty good sense of just how tolerant you can be of failure. Or, in other words, given the needs of the people or machines consuming your services, how long can a service disruption last before the mob comes pouring through your front gates with pitch forks and flaming torches. It’s important to know this, because the amount of redundancy you build into your design will have an enormous impact on the down-times you will eventually face.
Obviously, the system you build for a service that can go down for a weekend without anyone noticing will be very different from an e-commerce site whose customers expect 24/7 access. At the very least, you should generally aim for an availability average of at least 99% — with some operations requiring significantly higher real-world results. 99% up time would translate to a loss of less than a total of four days out of every year.
There is a relatively simple formula you can use to build a useful estimate of Availability (A). The idea is to divide the Mean Time Before Failure by the Mean Time Before Failure plus Mean Time To Repair.
A = MTBF / (MTBF + MTTR)
The closer the value of A comes to 1, the more highly available your cluster will be. To obtain a realistic value for MTBF, you’ll probably need to spend time exposing a real system to some serious punishment, and watching it carefully for software, hardware, and networking failures. I suppose you could also consult the published life cycle metrics of hardware vendors or large-scale consumers like Backblaze to get an idea of how long heavily-used hardware can be expected to last.
The MTTR will be a product of the time it takes your cluster to replace the functionality of a server node that’s failed (a process that’s similar to, though not identical with, disaster recovery — which focuses on quickly replacing failed hardware and connectivity). Ideally, that would be a value as close to zero seconds as possible.

Server Availability
The problem is that, in the real world, there are usually far too many unknown variables for this formula to be truly accurate, as nodes running different software configurations and built with hardware of varying profiles and ages will have a wide range of life expectancies. Nevertheless, it can be a good tool to help you identify the cluster design that’s best for your project.
With that information, you can easily generate an estimate of how much overall downtime your service will likely in the course of an entire year.
A related consideration, if you’re deploying your resources on a third-party platform provider like VMWare or Amazon Web Services, is the provider’s Service Level Agreement (SLA). Amazon’s EC2, for instance, guarantees that their compute instances and block store storage devices will deliver a Monthly Uptime Percentage of at least 99.95% — which is less than five hours’ down time per year. AWS will issue credits for months in which they missed their targets — though not nearly enough to compensate for the total business costs of your downtime. With that information, you can arrange for a level of service redundancy that’s suitable for your unique needs.
Naturally, as a service provider to your own customers, you may need to publish your own SLA based on your MTBF and MTTR estimates.
Session Handling
For any server-client relationship, the data generated by stateful HTTP sessions needs to be saved in a way that makes it available for future interactions. Cluster architectures can introduce serious complexity into these relationships, as the specific server a client or user interacts with might change between one step and the next.
To illustrate, imagine you’re logged onto Amazon.com, browsing through their books on LPIC training, and periodically adding an item to your cart (hopefully, more copies of this book). By the time you’re ready to enter your payment information and check out, however, the server you used to browse may no longer even exist. How will your current server know which books you decided to purchase?
I don’t know exactly how Amazon handles this (but you might get some hints from my Manning “Learn AWS in a Month of Lunches” book), but the problem is often addressed through a data replication tool like memcached running on an
external node (or nodes). The goal is to provide constant access to a reliable and consistent data source to any node that might need it.
This article is adapted from “ Teach Yourself Linux Virtualization and High Availability: prepare for the LPIC-3 304 certification exam ”. It was also published on Medium. Check out my other books on AWS and Linux administration.
June 5, 2017
VirtualBox: Are You Getting Your Money’s Worth?
Well of course you are. It’s free, isn’t it? Ok, so then why not double the return on your investment? Why not broaden your reach by becoming a VirtualBox power user?
Oracle’s VirtualBox is easy to install, easy to run, and gives you the ability to run virtual versions of just about any modern operating system from within any other modern operating system. Mac OS on Windows? Yup. Windows 10 on Ubuntu Linux? I’ve done it myself. FreeBSD on CentOS Linux? Sure, why not?
You can, of course, do similar stuff with the free VMware Player tool and, on Windows 8 and up, with Hyper-V. But this article is about VirtualBox.
I’d been using VirtualBox for years, but it wasn’t until I needed to pull together a number of physical machines sitting around the house to use as nodes in a Docker swarm mode network that things got complicated. After all, manually creating and launching VMs would require spending some serious time in front 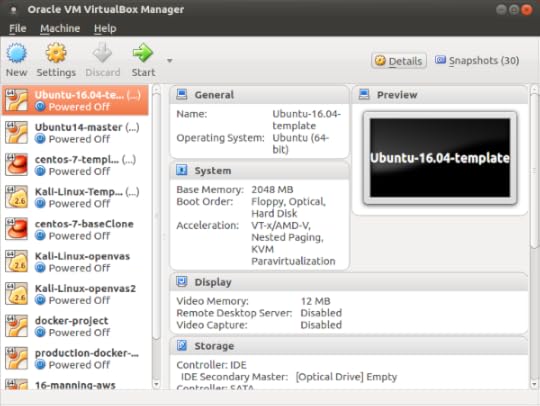 of each PC, babysitting OS installations and configurations. And that, in turn, would mean climbing stairs and sitting on the truly awful chairs in my kids’ rooms. Don’t tell them I said this, but I haven’t a clue why they put up with them.
It turns out that SSH connectivity between my (Linux) PCs and some very basic knowledge of the vboxmanage command line shell were all it took to return me to my lazy sysadmin happiness. It was liberating, and you could probably use some liberation of your own.
But before going there, I’ll talk a bit about the way VirtualBox works and the kinds of things you can do with it. Feel free to skip ahead if that doesn’t sound interesting.
What’s my angle in all this? While engaging in research for my various books and Pluralsight video courses, I often build test environments that include machines running odd combinations of operating systems. For some purposes — especially when I need to work at the operating system kernel level — VirtualBox has repeatedly proven to be the fastest and most effective tool I’ve got. I’m not sure I’d ever want to use the resource-greedy VirtualBox to run permanent services, but for test and development related cases, it’s absolutely king of the hill.
That’s me. But is my experience useful for normal users? In the sense that, once in a while at least, everyone needs to check out new technologies, then absolutely. But I guess I am a bit unusual in that I very rarely move to production. I’m always testing.
Working with VirtualBox
Besides letting you try out entirely new operating systems without having to dig through the garage for unused (but usable) hardware components, VirtualBox is also a terrific sandbox. So even if you don’t really care what OS you’re running, but you’re not too keen on risking the health and welfare of your main workstation on some experimental software configuration, VirtualBox can help.
This will also work if the experimental software configuration is your own. Which is to say that VirtualBox can be used as a tool for safely testing the way your own development projects handle within multiple OS environments.
And don’t forget that VirtualBox is very widely used as a provider for the Vagrant configuration automation system.
As I briefly wrote in my Linux Server Virtualization article, VirtualBox is a type-2 hypervisor. And so it is. But it’s a hypervisor with such a light footprint that, feature-for-feature, it can overlap with container technologies like Docker and LXC/LXD. That opens VirtualBox up to a decent range of uses. But since the overlap can get complicated, here (because you can never have too many spreadsheets) is a visual technology vs. technology comparison:
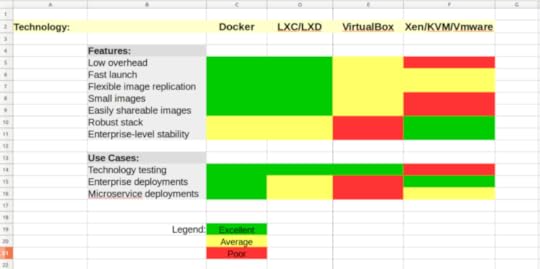
An unscientific feature/use-case matrix for virtualization technologies
Getting Stuff Done
Enough talk already. Let’s get to work.
The VirtualBox GUI is all very pretty, but it’ll really slow you down when you’re firing up VMs on multiple network hosts. So here are some tools that will make things happen — both locally or through a remote connection — from the command line.
Install VirtualBox (here’s how it’s done on Ubuntu or Debian, at any rate):
$ sudo apt install virtualbox
Now it is possible to remotely create a new VM from scratch using commands like these:
vboxmanage list ostypes
vboxmanage createhd — filename Ubuntu64.vdi — size 16384
VBoxManage createvm — name Ubuntu64 — ostype “Ubuntu_64” — register
…But displaying the actual installation interface on a remote screen can sometimes be more trouble than it’s worth. Instead, let’s assume that you’ve already got a “golden-image” VirtualBox VM on your local workstation. You’ll want to use vboxmanage list vms to see what‘s there.
Here’s what it looked like on my workstation:
$ vboxmanage list vms
“Ubuntu-16.04-template” {c00d3b2b-6c77–4919–85e2–6f6f28c63d56}
“Ubuntu14-template” {43e2f9d4–8aa1–4db4-aa59–33b202df32ed}
“centos-7-template” {e2613f6d-1d0d-489c-8d9f-21a36b2ed6e7}
“Kali-Linux-template” {b7a3aea2–0cfb-4763–9ca9–096f587b2b20}
“Kali-Linux-openvas” {1ec41fdd-bf14–4025–9e9e-ee7272acf87f}
“docker-project” {2387a5ab-a65e-4a1d-8e2c-25ee81bc7203}
“Ubuntu-16-lxd” {62bb89f8–7b45–4df6-a8ea-3d4265dfcc2f}
Note, by the way, how I keep clean “template” copies of individual operating systems and then create cloned copies whenever I need to do some actual work. Believe me, this can really speed up your time-to-launch over having to go through the whole installation routine each time. You can create clones from the GUI, or using clonevm like this (where “Kali-Linux-template” is the name of an existing VM and “newkali” is the name we’d like to give to the clone):
$ vboxmanage clonevm Kali-Linux-template --name newkali
Check out the clonevm argument details on the VirtualBox documentation page here.
Here, however, I’m going to show you how to export an existing VM to a .OVA file that you can simply copy to your remote machines and then import into their instances of VirtualBox. The export operation couldn’t be simpler: you enter the name of the VM you want to export (docker-project, in my case), -o to specify an output filename, and the filename itself with the appropriate file extension.
$ vboxmanage export docker-project -o docker.ova
0%…10%…20%…30%…40%…50%…60%…70%…80%…90%…100%
Successfully exported 1 machine(s).
The file will be saved to your current directory. You can display the details of the file you’ve just created:
$ ls -lh | grep docker
-rw — — — — 1 root root 2.1G Jun 4 17:01 docker.ova
One way or another, you’ll need to copy the .OVA file to your other PCs. Here’s how the file transfer might work between Linux/MAC OS machines using scp:
$ scp docker.ova username@192.168.0.34:/home/username
Naturally, you’ll have to make sure you’ve got enough free disk space to both save the .OVA file itself (which can be quite large) and create the new VM.
Now log in to your remote machine and, from the directory containing the file you’ve just transferred, import it into VirtualBox:
$ vboxmanage import docker.ova
0%…10%…20%…30%…40%…50%…60%…70%…80%…90%…100%
Interpreting /home/dad/docker.ova…
OK.
Disks:
vmdisk2 36945920000 -1 http://www.vmware.com/interfaces/specifications/vmdk.html#streamOptimized docker-disk1.vmdk -1–1
Virtual system 0:
0: Suggested OS type: "Ubuntu_64"
(change with "--vsys 0 --ostype "; use "list ostypes" to list all possible values)
1: Suggested VM name "docker-project"
(change with "--vsys 0 --vmname ")
2: Number of CPUs: 1
(change with "--vsys 0 --cpus ")
3: Guest memory: 2048 MB
(change with "--vsys 0 --memory ")
4: Sound card (appliance expects "", can change on import)
(disable with "--vsys 0 --unit 4 --ignore")
5: USB controller
(disable with "--vsys 0 --unit 5 --ignore")
6: Network adapter: orig Bridged, config 3, extra slot=0;type=Bridged
7: CD-ROM
(disable with "--vsys 0 --unit 7 --ignore")
8: IDE controller, type PIIX4
(disable with "--vsys 0 --unit 8 --ignore")
9: IDE controller, type PIIX4
(disable with "--vsys 0 --unit 9 --ignore")
10: SATA controller, type AHCI
(disable with "--vsys 0 --unit 10 --ignore")
11: Hard disk image: source image=docker-disk1.vmdk, target path=/home/dad/VirtualBox VMs/docker-project/docker-disk1.vmdk, controller=10;channel=0
(change target path with "--vsys 0 --unit 11 --disk path";
disable with "--vsys 0 --unit 11 --ignore")
0%...10%...20%...30%...40%...50%...60%...70%...80%...90%...100%
Successfully imported the appliance.
You’ll want to confirm that everything worked by running list vms:
$ vboxmanage list vms
“docker-project” {30ec7f7d-912b-40a9–8cc1-f9283f4edc61}
You can connect your VM to a network using vboxmanage modifyvm. But, before you can do that, you’ll need to know how your host machine refers to the appropriate network interface. On a Linux machine, you can get that using ip addr. In this case, the second interface that’s displayed (“eth0” — that’s “eth” followed by a zero…not the letter o) is the NIC through which that machine gets its internet access, so it’s the connection we’re after.
$ ip addr
1: lo: mtu 65536 qdisc noqueue state UNKNOWN group default qlen 1
link/loopback 00:00:00:00:00:00 brd 00:00:00:00:00:00
inet 127.0.0.1/8 scope host lo
valid_lft forever preferred_lft forever
inet6 ::1/128 scope host
valid_lft forever preferred_lft forever
2: eth0: mtu 1500 qdisc pfifo_fast state UP group default qlen 1000
link/ether 94:de:80:c5:1e:2d brd ff:ff:ff:ff:ff:ff
inet 192.168.1.13/24 brd 192.168.1.255 scope global dynamic eth0
valid_lft 59857sec preferred_lft 59857sec
inet6 fe80::e1c3:f8a2:9f8d:4375/64 scope link
valid_lft forever preferred_lft forever
One way to move your VM’s (virtual) network card onto the eth0 interface by way of a bridge adapter is through the modifyvm command. In this case, “docker-project” points to the VM name, and eth0 is the target of the new bridge, connecting your VM’s internal network interface with the host’s eth0.
$ vboxmanage modifyvm “docker-project” --bridgeadapter1 eth0
Now you’re ready to fire up the VM. The “type” argument tells VirtualBox to run the VM as a server without a GUI.
$ vboxmanage startvm “docker-project” type --headless
Waiting for VM “docker-project” to power on…
VM “docker-project” has been successfully started.
Curious about what’s going on with your new VM? Try showvminfo:
$ vboxmanage showvminfo docker-project
You may need to run a network search program like nmap to get your VM’s IP address. With that piece of information, you’ll be ready to get to work. Log in to your new VM using the same credentials you used on the source VM from which it was copied. Shutting down a VM once you’re done with it is as simple as running the poweroff command:
$ VBoxManage controlvm “docker-project” poweroff
0%…10%…20%…30%…40%…50%…60%…70%…80%…90%…100%
Happy virtualizing!
A version of this post was published on Medium.
May 10, 2017
Too Many Choices: How to Manage Your Docker Clusters
There are all kinds of ways to play the Docker game and, obviously, no one of them is going to be right for every use case. So what I’m going to do here is give you a brief functional overview of each of the most obvious management options in a way that can help you choose for yourself and save you a whole lot of time and frustration in the process. That way you get to look smart and no one has to know it was me all along.
First though, here’s the sentence with which every article on any subject even remotely related to Docker must begin: Over the past n years (where n < 6), container technologies, and Docker in particular, have become dominant tools in the application provision world.
Great. With that out of the way, we can get down to business. So you’re considering delivering your app or networked service through Docker containers…or at least giving them a good look. I certainly won’t argue with you: that’s probably a good choice.
Now presumably you already know that Docker Engine is the open source software environment that lets you virtualize bits and pieces of a host hardware system until they look and act just like real servers. Docker is now available in either its free (Community Edition) of commercially supported (Enterprise Edition) versions.
No doubt you also know that invoking Docker Engine from your command line using things like:
docker ps
docker images
and:
docker network inspect
…will get stuff done. Not so comfortable with all that? There’s some intro-level material you might like that’s included in my Docker-oriented courses over at Pluralsight.
All that will work just fine while you’re just learning your way around. But once you’re ready to start planning a robust and highly scalable deployment – complete with complex configurations that might include microservices and network bridges – then the landscape quickly changes. The question is not so much “how”, but “where and which”: Do you have the compute and network resources to run your app locally, or will you need to find a host? Should you do it yourself or choose a managed service on a public cloud like AWS’s Elastic Beasntalk?
And then what about administration? Are you a hands-on type or do you prefer standing a layer or two back and letting management tools like Kubernetes or Docker swarm mode do some of the heavy lifting for you? Or how about two or three layers back and going with Ansible or Puppet?
Let’s divide things into three categories: repository tools for storing and managing Docker images, administration frameworks for defining, launching, and managing Docker containers through their life cycles, and then some command line and configuration automation management tools.
1. Image Registries
Docker Hub
For most people, the obvious first place to look for Docker images – the packages containing the operating systems and software used to run containers – is Docker Hub. Provided by Docker itself, Docker Hub holds a vast collection of images that come pre-loaded to support all kinds of application projects. You can find and research images on the hub.docker.com web site, and then pull them directly into your own Docker Engine environment.
docker pull ubuntu
Once you begin creating your own images, you can safely store as many of them as you like in public repositories on Docker Hub. In addition, they’ll allow you one private repo for free, and more at a rate of roughly one dollar per repo. Perhaps the nicest thing about Docker Hub is the way it works seamlessly with just about anything else connected to Docker, including public cloud providers like AWS and hosting services like Docker Cloud.
The separate Docker Store service allows you to publish pre-certified images and plugins to satisfy demand for access to trusted resources.
EC2 Container Registry (ECR)
Amazon’s AWS knows all about the power and potential of Docker and wants in on the game. As part of their efforts to open up their cloud ecosystem to as much Docker business as possible, they’ve built their own registry to go with their EC2 Container Service platform: ECR. Images can be pushed, pulled, and managed through the AWS GUI or CLI tool. Permissions policies can closely control image access only to the people you select.
The limitation? ECR is obviously designed to work best with infrastructure running on AWS-based services like ECS and Elastic Beanstalk.
Docker Registry
If you need to maintain your images a bit closer to home – either for security or practical reasons – then you’ll want to know about Docker’s freely available Docker Registry. You designate a registry server with access to and from your other network assets, install and then enable the docker-registry package, tag images so they’re pointed to your local registry, and you’ve got yourself a real, live private repo.
dpkg -i docker-registry_2.4.1~ds1-2_amd64.deb
systemctl enable docker-registry
docker tag hello-world localhost:5000/hello-world:latest
The images themselves are stored deep within the file system on your server, but they’re available through the same CLI tools as those on Docker Hub. Worried about securing your images? Docker Registry lets you apply SSL/TLS certificates and control access by enforcing login authentication to your site.
The Docker Trusted Registry is Docker’s commercial version of the Docker Registry. In exchange for monthly or annual charges, you get extra bells and whistles including support, a browser-based GUI, and LDAP/AD integration.
2. Administration Frameworks
Even once you’ve graduated beyond the just-seeing-how-stuff-works stage, you might still want to keep an active Docker deployment on-premises: Perhaps your clients are all local or your projected workload isn’t all that heavy. Or perhaps you’re just paranoid about security. And by “paranoid about security” of course, I mean “well informed about the current state of network vulnerabilities”.
One way to “stay local” is to just continue with what you’ve been doing until now. As long as you take resource security and capacity considerations into account, there’s no reason to abandon the good old Community Edition Docker Engine you’ve already got installed.
However, if the level of complexity you think you’re going to face leaves you feeling a bit lost, then you might want to consider upgrading to a commercial environment that, along with ongoing support, can offer browser-based admin consoles. Either way though, you’re going to need to provide your own hosting environment where your containers will run. That might be your local servers, or virtual machines running within a public cloud like AWS or Azure.
Docker Datacenter
You set up Datacenter (now marketed as part of Docker Enterprise Edition) by downloading and installing the regular Docker Engine on your local server, along with a second package called the Docker Universal Control Plane (UCP). The UCP provides a browser interface that permits centralized management for all the images, apps, and networks that make up your infrastructure. Security, too, is handled through the interface.
Docker Cloud
Much like Docker Datacenter (which is also an official Docker product), Docker Cloud offers a GUI, browser-based console for managing all aspects of your Docker deployments. This includes administration for your host nodes running in public clouds. The big difference is that, unlike Datacenter, the Docker Cloud administration service is hosted from the cloud.docker.com site: there’s no server software to install on your own equipment.
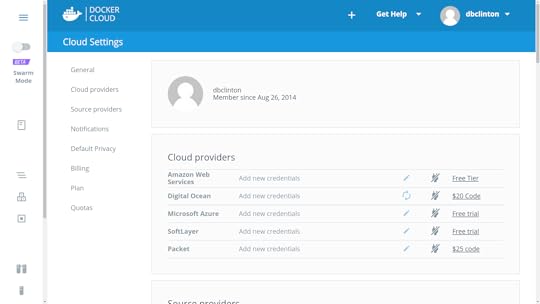
Docker Cloud – cloud provider settings
It works by entering authentication information for your cloud provider accounts (like AWS) or by installing the Docker Cloud Agent on any Linux or Windows machine running anywhere where there’s network connectivity. Clicking the “Bring your own node” button in the Node Clusters window will display a Linux command to download and install the agent that might look something like this:
curl -Ls https://get.cloud.docker.com/ | sudo -H sh -s 90b501cb04e344bfbf76890a09362c39
Docker Cloud organizes resources into node clusters, which are groups of individual nodes being managed as part of a single service, all dedicated to a unified deployment goal.
I think that part of the reason Docker continues to promote two such similar services (Datacenter and Cloud) goes a couple of years back to when Docker purchased a company called Tutum and renamed their web-based product Docker Cloud. Tutum already had a happy customer base and a fairly successful business model, so there was no reason to shut it down. In any case, both work, so just pick whichever one rings your bell.
AWS EC2 Container Service (ECS)
Besides the ECR image registry, AWS has created its own full infrastructure for both hosting and managing Docker container clusters. ECS works by provisioning a purpose-built EC2 instance with both Docker Engine and an ECS agent installed. Using either the ECS console or the AWS CLI, you can define, launch, and manage containers on that EC2 instance.
aws ecs describe-clusters
To be honest, figuring out how all the many ECS pieces fit together can be a tough task. My “Using Docker on Amazon Web Services” course on Pluralsight devotes some time to explaining how the parts work. Here’s the short version:
Tasks: metadata defining an application and its network, storage, and security environment
Services: software that launches, monitors, and controls your containers
Containers: definitions for the machines that will run a task
Clusters: organizing structures for tasks and services
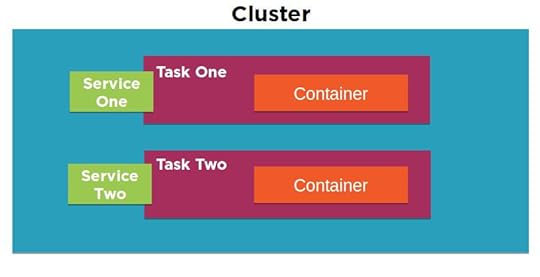
A diagram of the EC2 Container Service architecture
AWS Elastic Beanstalk
Elastic Beanstalk effectively sits on top of ECS, allowing you to deploy your application across all the AWS resources normally used by ECS, but with virtually all of the logistics neatly abstracted away. Effectively, all you need in order to launch a fully scalable, complex microservices environment is a declarative JSON-formatted script in a file called Dockerrun.aws.json. You can either upload your script to the GUI or, from the AWS Beanstalk command line interface, run it using:
eb run
And that’s it. No really.
I should mention that Dockerrun.aws.json files come in two flavors: V1 for single container deployments, and V2 for multiple containers. It’s also worth noting that one big advantage of using the CLI over the browser version is how much easier it can make remote SSH logins to the EC2 host and administration tasks.
Here’s something else to thing about: the first seventeen chapters of my “Learn Amazon Web Services in a Month of Lunches” book traced, step-by-step, the construction of a highly available, scalable, and secure WordPress site. For chapter 19 – just to quickly illustrate how it works – I created a 20-line Dockerrun.aws.json file that did pretty much exactly the same thing…but in just five minutes.
Now that’s not to say that the book’s first 17 chapters were waste of time! In fact, without understanding how each separate AWS service works you wouldn’t fully grasp what it was that Beanstalk actually accomplished. And you’ll certainly miss out on all kinds of functionality that can take you way beyond the things that Beanstalk can deliver. But it sure does say something about the power of scripted deployments, doesn’t it?
3. Management tools
Docker Swarm Mode
Although it’s now a part of Docker Engine right out of the box, perhaps because it’s still undergoing steady change, Docker swarm mode somehow has the flavor of a standalone product. The idea is that you can designate one of your servers (known as a node) as a manager:
docker swarm init
…and other servers as clients:
docker swarm join
From there, using “docker service” commands from the manager will create and administrate clusters of Docker containers as services, and automatically and efficiently spread the containers among all of your available servers, no matter where they might live. You should try this out for yourself just for the thrill of running a simple “service scale” command and seeing the proper amount of containers magically and instantly appear across your network.
docker service create -p 80:80 --name webserver nginx
docker service scale webserver=5
I dedicated part of my Pluralsight “Using Docker with AWS Elastic Beanstalk” course to demonstrating Docker Swarm in action. Take a look if you’re interested.
Kubernetes
Like Swarm, Google’s Kubernetes is also very good at efficiently managing large container clusters. And to say that Kubernetes is popular is like saying rain is wet. Duh.
Kubernetes organizes resources into pods, which themselves are made up of interconnected containers running individual microservices. You should think of a pod as being entirely disposable, its function instantly replaceable by others awaiting their chance to enter this world. In fact, pods are created and destroyed according to the needs defined on the Master node by things like schedulers and replication controllers, all of which can, in turn, be managed by the kubectl program. Pods, and their containers, run on serversknown as worker nodes running their own instances of Docker Engine.
I don’t know about you, but I find it both confusing and annoying that every single IT platform chooses to refer to the constituent elements by different – but often only slightly different – names. There oughta be a law.
Deployment Automation tools
I can’t walk away from a review article like this without at least mentioning how you can use just about any of the popular deployment orchestration tools like Ansible, Jenkins, and Puppet to automate your Docker environments. Diving into the fine details would take me far beyond my original plan for this article, so just pick your favorite tool and document up.
March 13, 2017
Catching Up
Although I’ve badly neglected my poor old blog for months now, it’s never been completely forgotten. For now, though, it will have to make do with some simple updates.

Aside from a few more layers of review, my book “Learn Amazon Web Services in a Month of Lunches” is pretty much complete. It’s already started pre-production and is really taking shape. Of course, chapter drafts have also been selling through Manning’s MEAP subscription for months now.
If you’re curious but still unsure whether you want to pull out your credit card, you can read four articles based on the book on Medium, or take a look through the slideshare intro put together by Manning.
The book on Linux server virtualization and cluster computing I wrote for the LPI’s LPIC-3 304 certification exam may also be coming out soon…despite the fact that it was actually done more than six months ago. That one I had nearly forgotten. I hope to have more information on that coming soon.
I certainly haven’t been ignoring Pluralsight: my tenth PS course (Managing Docker Images) just came online a few weeks ago, and an eleventh (Docker on Elastic Beanstalk) should be following within the month.
December 1, 2016
Who knew e-book pirates did the morality thing?
It was a rare display of truly industrial strength chutzpah. Cheek of such force it’s breathtaking. A kind of work of art.
I don’t often publish multiple projects within days of each other, but it just happened that the MEAP version of Manning’s “Learn AWS in a Month of Lunches“, my “Using Docker on AWS” course on Pluralsight, and Apress’s “Practical LPIC-1 Linux Certification Study Guide” all appeared around the same time.
When the LPIC-1 book appeared, I thought I’d see what I could learn about it from my smart friend, Google. Among the first page or so of search results were links to a few sites offering the book as a free download. Strange. I didn’t remember “free” as a standard Apress pricing model. But who am I to question the wisdom of the marketing gurus?
Whoops! My mistake. It seems these had nothing to do with Apress marketing after all, but were links to downloads of pirated copies of the e-book version of my book. Well, we all have to make a living, I guess. Clicking on the link to the ebookee.pro site, however, I was surprised to be told that I wouldn’t be able to continue enjoying the page, because I was using an ad blocker. ebookee.pro wants me to help them continue to “keep making this site awesome” by participating in their ad display campaign. How heartwarming.
I am sympathetic to the problems facing the owners of many of the sites I often visit, and I will sometimes open up my ad blocker for them. After all, I enjoy reading the regularly-updated content that they work so hard to produce, why shouldn’t they get something back?
But begging me to help support the wholesale theft of intellectual property…MY intellectual property?
C’mon.
November 22, 2016
Learn Amazon Web Services in a Month of Lunches – MEAP edition now available
Among my many sins these past few months, I’ve been quietly working away on a new book for Manning meant to introduce folks to the wonders of the Amazon Web Services (AWS) cloud computing platform. Amazon has made it possible to move just about any digital workload from wherever it lives right now (even if it’s been nothing more than an idea in your head) to their secure, reliable, and – often – cost-effective hosting environment. All kinds of stuff uses AWS, from the complete infrastructure of Internet giants like Netflix down to, well, my own bootstrap-it.com site.
The trick is getting over two big hurdles: the first steps into this massive universe can seem really complicated; and simply visualizing what AWS’s nearly 100 separate services actually all do can be a challenge.
And that, hopefully, is where I come in. The MEAP edition of my “Learn Amazon Web Services in a Month of Lunches” is now online. The book loosely follows the construction of a web application as it grows from its very simple origins to a complex, multi-tiered deployment. All the core AWS services are clearly demonstrated, along with key architectural design principles.
The idea of a MEAP (Manning Early Access Program) is to give you access to a young book while it’s still in development. You’ll be among the first to read each chapter as it arrives, and the Manning team will, hopefully, get your feedback and ideas…which they, in turn, will use to make my life miserable. And that’s a good thing.
The idea behind the “Month of Lunches” series (originally devised by Don Jones – my curriculum director at Pluralsight), is to provide books that teach practical and immediately useful skills, packaged in bite-sized chunks that you can consume – alongside your lunch – in just a few weeks. No excuses.
While not in its final state, the chapters you’ll see in a MEAP will already have been though three or four layers of review. As you’d expect from a strong editorial team like Manning’s, this is in pretty good shape already.
If you’re interested, head over to my book’s MEAP page and subscribe (or just read the free chapter). And enter the discount code mlclinton2 for 50% off.
October 26, 2016
Ignore Your Inodes at Your Own Peril!
 Who knew that ignoring the status of your inodes could bring down your Linux server? I can’t say the possibility crossed my mind all that often. Until, that is, ignoring the status of my inodes actually brought down my server.
First though, just what is an inode? It’s an object used by Unix systems to identify the disk location and attributes of files within a filesystem. There will usually be exactly one inode for each file or directory (the exception being hard linked files that can share a single inode).
You can see the inode numbers for each of the objects within a directory by running ls -i
$ ls -i
59776347 AsciidocFX
55312398 Desktop
55312402 Documents
55312399 Downloads
55312390 examples.desktop
56628996 git
55312403 Music
55312404 Pictures
55312401 Public
55312405 Videos
56236523 VirtualBox VMs
$
Now here’s the tricky bit. Just like the available disk space determines the upper limit on the files you can create or download to a computer, the number of files you can have is similarly capped by the an inode limit. To see your limit, run df -i and check out the value for your root directory under the Inodes column
$ df -i
Filesystem Inodes IUsed IFree IUse% Mounted on
/dev/sda2 60547072 628017 59919055 2% /
$
In the case of my home workstation, I’ve got more than 60 million inodes in total, of which only 2% are being used. No trouble there.
But when I logged into my server to run a security update the other day, I was hit with this:
dpkg: error processing archive /var/cache/apt/archives/linux-headers-3.13.0-100_3.13.0-100.147_all.deb (--unpack):
unable to create `/usr/src/linux-headers-3.13.0-100/drivers/staging/dgap/Kconfig.dpkg-new' (while processing `./usr/src/linux-headers-3.13.0-100/drivers/staging/dgap/Kconfig'): No space left on device
Note the “No space left on device” warning. No space? I ran df and saw that there were still plenty of free GBs on hand. Just to be sure, I tried to create a new file in my home directory (to rule out some kind of permissions problem). No luck there:
$ touch ~/newfile
touch: cannot touch ‘/home/ubuntu/newfile’: No space left on device
I’ll admit that I didn’t immediately think to look at the inodes – as I said above: who knew…? But a quick Google search revealed that I wasn’t the first guy to get hit with this. Suitably informed (and embarrassed) I remembered that df -i will display file system inode usage, and here’s what it looked like for me:
$ df -i
Filesystem Inodes IUsed IFree IUse% Mounted on
/dev/xvda1 524288 524288 0 100% /
IFree = 0, IUsed% = 100%. Not good. But what could possibly be generating enough files to drain my inode supply? Tracking down the directories containing the most files (i.e., using up the most inodes) can be done using some variation of this find command run from your root directory:
$ sudo find . -xdev -type f | cut -d "/" -f 2 | sort | uniq -c | sort -n
But there’s a catch. Find saves its raw data in a temporary file…but it can’t do that as long as you have no free inodes. So you’ll have to delete one or two unneeded files just to get yourself going.
At any rate, with that out of the way, find from my root directory returned this:
$ sudo find . -xdev -type f | cut -d "/" -f 2 | sort | uniq -c | sort -n
5 root
48 tmp
127 sbin
128 bin
377 boot
989 etc
2888 home
6578 var
15285 lib
372893 usr
The problem obviously lay somewhere within the /usr directory. So I moved down to /usr and ran find once again:
$ cd usr
This time the guilty finger pointed straight to /usr/src:
$ sudo find . -xdev -type f | cut -d "/" -f 2 | sort | uniq -c | sort -n
6 include
160 sbin
617 bin
7211 lib
16518 share
348381 src
So just what goes on in /usr/src? Well it turns out that that’s where the kernel headers are kept. All kernel headers, including those left over from previous kernel versions installed on your machine. If you drill down through the directory tree, you’ll see that there are, indeed, a great many files. Mountains of ’em, in fact.
To free up some space, you may need to manually remove some of the older directories. Then, assuming you’re using a Debian/Ubuntu distribution, let dpkg safely remove whatever else isn’t needed through –configure:
$ sudo dpkg --configure -a
Then, to safely remove all old headers, run autoremove:
$ sudo apt-get autoremove
And everything should be back to optimal working order. The moral of the story? Details matter.