
Gennaro Cuofano's Blog, page 197
July 13, 2020
What Is A Financial Statement? Financial Statements In A Nutshell
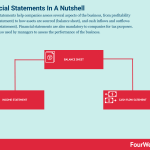
Financial statements help companies assess several aspects of the business, from profitability (income statement) to how assets are sourced (balance sheet), and cash inflows and outflows (cash flow statement). Financial statements are also mandatory to companies for tax purposes. They are also used by managers to assess the performance of the business.
Introduction To The Main Financial Statements
The main financial statements are: Balance Sheet, Income Statement and Cash Flow Statement. Each of these statements has a different purpose and together they give us specific information in regard to: “Return, Risk and Cash”.
First, if you look at the income statement, there is no way you would make any assessment about the risk of the organization in that particular point in time or the cash produced in a certain period.
Instead, the Income Statement (or Profit & Loss) will show you the return generated by the business.
Second, if you want to understand how an organization acquired the resources to operate the business, you have to look at the Balance Sheet. How does the balance sheet assess the risk of an organization?
Simple: there are two ways a company can acquire resources, either through Equity or Debt. As you can imagine, too much debt can be dangerous. What would occur if you run a business and suddenly your creditors ask for the money you owe them?
You would go bankrupt. Instead, when debt in proportion to the equity is dismal, this makes your organization creditworthy and safer.
Third, it happened many times in the financial world history to see profitable companies bankrupted due to a poor cash management.
The cash flow statement helps you to answer questions such as: How much cash did we make? Where did the cash come from?
In fact, an organization can find cash through three main activities: Operating, Investing and Financing.
Income Statement (P&L): Show me The Bottom Line
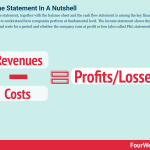
[image error]The income statement, together with the balance sheet and the cash flow statement is among the key financial statements to understand how companies perform at fundamental level. The income statement shows the revenues and costs for a period and whether the company runs at profit or loss (also called P&L statement).
The main purpose of the income statement is to show the return of the business in a certain period: Quarterly, Biannually or Yearly.
The income statement is built around the bottom line, the “net profit”. Do not be surprised to notice your eyes unexplainably falling on the net income.
This distracts you by other metrics on the Income Statement that are as important as the Net Income.
Balance Sheet: The Power Of The Now
[image error]The accounting equation is the fundamental equation that keeps together a balance sheet. Indeed, it states that assets always equal liability plus equity. The foundation of accounting is the double-entry system which assumes that a company balance sheet can be broken down in assets, and how they get sources (either though equity/capital or liability/debt).
The main purpose of the Balance Sheet is to show the risk of the business in the particular moment you are looking at it. In Fact, if you look at the balance sheet on January 1st it won’t be the same on January 2nd.
Of course, this is true for the P&L and CFS (Cash Flow Statement) as well, but the balance sheet is an instant snapshot of the business more than a collage of pictures taken in different moments, like the Income Statement.
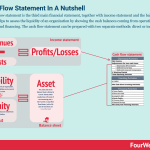
Cash Flow Statement (CFS): Cash Is King
[image error]The cash flow statement is the third main financial statement, together with income statement and the balance sheet. It helps to assess the liquidity of an organization by showing the cash balances coming from operations, investing and financing. The cash flow statement can be prepared with two separate methods: direct or indirect.
The main purpose of the cash flow statement is to show the cash generated by an organization in a certain period: Quarterly, Biannually or Yearly.
It doesn’t matter how much profits a business is making, one way to know whether the business will survive in the next future is to look at the cash.
Generating cash is not easy task and the organizations who are able to keep their profits stable and generate enough cash to sustain their operations and invest for future growth are the ones who thrive.
Real Life Analogy
Let me use a real life analogy here. If you are a photographer in order for you to do your job, you must have a professional camera.
In addition, you can take instant pictures or build a collage of pictures you have taken in the last three months, and remember the camera will work as soon as the battery will be charged.
Indeed, you can compare the single picture or “instant picture”, at your balance sheet, while the “collage” pictures taken in the last three months, at your income statement.
Furthermore, you want to see what’s the level of charge of the battery and how long the camera will operate. The battery life can be compared to your cash flow statement.
Indeed, a lack of cash for a business is almost like a lack of oxygen for an individual.
According to your needs you can look separately at each statement.
However, if you want the whole picture of the business you must look at all of them concurrently.
Resources:
Business FrameworksBusiness Analysis FrameworkCash Flow Statement In A NutshellHow To Read A Balance Sheet Like An ExpertIncome Statement In A NutshellWhat is a Moat?Gross Margin In A NutshellProfit Margin In A NutshellWhat is a Financial RatioTypes of Business Models You Need to KnowThe Complete Guide To Business DevelopmentBusiness Strategy ExamplesWhat Is Market Segmentation? the Ultimate Guide to Market SegmentationMarketing Strategy: Definition, Types, And Examples
The post What Is A Financial Statement? Financial Statements In A Nutshell appeared first on FourWeekMBA.


Capital Expenditure: CAPEX Vs. OPEX And How They Work
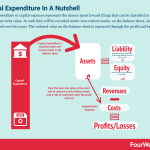
Capital expenditure or capital expense represents the money spent toward things that can be classified as fixed asset, with a longer term value. As such they will be recorded under non-current assets, on the balance sheet, and they will be amortized over the years. The reduced value on the balance sheet is expensed through the profit and loss.
CAPEX vs. OPEX
They are the acronyms for Operating Expenditure and Capital Expenditure. For example, imagine you own a real estate firm.
The firm bought an apartment complex with few units. In order for you to rent the apartments you have to clean and furnish them. The former activity implies that you call the maid, pay him/her $100 to have the apartment cleaned.
The latter activity instead implies buying things, such as: couches, kitchen stoves, beds and so on. They will cost you thousands of dollars but will last for few years.
The Operating Expense is money spent on the day-to-day operations of the business. The Capital Expenditure, instead, is money invested in the business with a long-term perspective.
Stop for a second and think. Is the cleaning service OPEX or CAPEX?
The $100 paid to the maid is OPEX. The money spent on furnishing the apartment, instead, will be defined as CAPEX. What helps to discriminate between the two are actually three factors:
Useful Life (More than one accounting cycle).Amount Spent (Over $2,500).Future Benefits (Will generate revenue).
Indeed, in the first scenario the maid cleaning expense will have a useful life of few weeks. Furthermore, it is worth less than $2,500 and it won’t produce any future benefits.
On the other hand, couches and kitchen stoves will have a useful life of few years. Further, whey will be worth over $2,500 and it will produce future benefits. Of course, there are few exceptions.
Case study
Imagine, the apartment complex your company bought needs to be repainted. Therefore, the painting work is comprised of: material (Paint) for $500 and labor (Painter) for $5,000.
The painter work meets all the criteria above; thereby it is a Capital Expenditure. What about the material (paint)? Even though the paint does not meet all the three CAPEX requirements.
Although, it can have a useful life of more than one accounting cycle, in our specific case it is not worth more than $2,500. Indeed, there is no way the painter would be able to finalize the work without paint.
Therefore, we will consider the paint as part of the overall work. Thereby, the paint, and the labor will be both considered CAPEX. Why is this difference between operating and capital expenditure crucial?
In reporting terms the operating expense will be stated on the Income Statement (Expense Section), the Capital Expenditure instead will be stated on the Balance Sheet (Non-Current Assets Section).
Why is Capital expenditure stated on the Balance Sheet?
Because it will be capitalized. What does it mean? Let me give you a further example. Imagine you bought $20,000 worth of furnishing. Assuming that the useful life of the items is ten years.
If you were to report the $20K furniture as an expense in the first year your profits would be completely eroded due to the fact that you should report a $20K expense under your income statement.
Instead, since this is a capital expenditure it needs to be spread along its useful life. In the specific example: ten years.
Thereby, you will report a depreciation expense of $2,000 on your income statement and concurrently decrease the asset value for $2,000 on your balance sheet. See example below:
[image error]
Difference between Tangible and Intangible Assets
The former are things with a physical entity, while the latter do not have a physical entity. Imagine you own an IT corporation. What do you need to operate the business? Of course, you need the office, computers and office supplies.
Assuming the corporation produces accounting software. How is your organization generating revenue? Through licensing the software. Therefore, it is crucial to make sure no one will clone it.
How can you avoid the cloning? Through patenting the software. In this example, the patent is an Intangible Asset. The remaining assets: Office building, computers and supplies are Tangible Assets.
Why is this difference important?
Depreciation & Amortization (D&A).
In the previous example, the IT Corporation needs computers to operate. Assuming 10 computers were bought for $2,000 each, the total Capital Expenditure was $20K.
Furthermore, they won’t last forever. Assuming a useful life of five years we have to figure out: What is the depreciation and How to record the transaction.
First, depreciation is the decreasing value of the asset on a yearly basis. Second, the formula to compute the depreciation rate is: (Asset Cost – Residual Value) / Useful Life.
Let’s solve the previous example: the asset cost = $20,000 minus the residual value = $2,000. Divide the result by 5.
This is the formula: ($20K Cost – $2k Residual Value) / 5 years Useful Life) = $18K / 5 = $3,600 per year. In conclusion, your schedule will look like the following:
Assuming the computers were bought at the beginning of Year 1, at the end of the year their value would decrease by $3,600 at $16,400. Up to Year 5, when the residual value will be $2,000.
[image error]
This method is called straight-line depreciation. Altough there are several depreciation methodologies, the straight-line is the most commonly used.
Why do we need to depreciate? As we saw in step 1, it would be unfair to report the whole asset cost under the Income Statement since it would completely erode Net Income.
It is correct instead to spread the value of the asset over the useful life.
Amortization follows the same process of Depreciation. Keep in mind: the tangible assets are depreciated; the intangible assets are amortized.
If we go back to the example made a while ago, the IT corporation has at its disposal: tangible assets, such as computers and intangible assets, such as patents.
Therefore, the former will be subject to depreciation, the latter to amortization.
Amortization and Depreciation are linked to ordinary events of the assets lives. When, instead, an asset loses value unexpectedly, it will be subject to impairment.
Imagine your real estate company bought a building at $10 million, with a useful life of 5 years.
At the end of year two due to an earth quick the building is badly damaged. Suddenly the fair market value drops at $5 million. The company decides to sell the building.
How do we estimate the impairment?
First, we have to estimate the carrying value of the Building. This is the Cost of the asset minus its accumulated depreciation = $6 million, or $10 million minus $4 million (10 million/5 years = 2 million x 2 years).
The book value of the building at year two is $6 million and the recoverable amount is $5 million, therefore the impairment amount is $1 million.
The following journal entry will be recorded on our balance sheet and income statement:
[image error]
The impairment loss will be reported under the income statement as an expense and the accumulated impairment on the balance sheet will decrease the value of the building.
Imagine the opposite scenario. The building increased in fair value instead. At the end of year one, the building is worth $9 million.
Given the carrying value of the building of $8 million, it revaluated by $1 million. We have to record the revaluation on our books:
[image error]
The revaluation will increase the value of the building on the balance sheet and determine a surplus/gain on our income statement.
Key takeaways
CAPEX or capital expenditure represents the money spent by the organization, in what are defined as fixed assets, on the balance sheet.The capital expenditure will sit on the balance sheet, and be amortized over the years as amortization expenses under the income statement.
Resources:
Business FrameworksBusiness Analysis FrameworkCash Flow Statement In A NutshellHow To Read A Balance Sheet Like An ExpertIncome Statement In A NutshellWhat is a Moat?Gross Margin In A NutshellProfit Margin In A NutshellWhat is a Financial RatioTypes of Business Models You Need to KnowThe Complete Guide To Business DevelopmentBusiness Strategy ExamplesWhat Is Market Segmentation? the Ultimate Guide to Market SegmentationMarketing Strategy: Definition, Types, And Examples
The post Capital Expenditure: CAPEX Vs. OPEX And How They Work appeared first on FourWeekMBA.
Profitability Framework And How To Analyze Profitability, Quick!
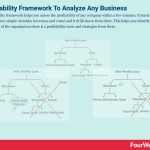
A profitability framework helps you assess the profitability of any company within a few minutes. It starts by looking at two simple variables (revenues and costs) and it drills down from there. This helps us identify in which part of the organization there is a profitability issue and strategize from there.
Profitability analysis framework explained
Analyzing financial statements is one of the most crucial skills to acquire if you want to work in financial accounting, strategy, investing and a good business skill to master.
However, analyzing financial statements implies that you have all the needed information to perform your analysis.
The word “analytical” means being able to select from a wide spectrum of data, the one who is relevant to perform the analysis. Therefore the analyst mindset is one of abundance of information.
In a world that constantly evolves and becomes more complex, there may be situations in which information is very scarce.
Consequently we have to quickly develop a scarcity mindset. One in which no information is provided, however an answer is required in a short amount of time.
How do we deal with such situations? It is crucial to develop the consultant mindset. Thus, instead of using Top-Down approaches, typical of the managerial accountant, we have to use bottom-up approach, typical of a consultant.
The Profitability Framework: Narrow The Problem
Imagine this scenario: One day, you are in your office. The boss comes in and he asks for your opinion.
He wants to know why the earnings for the IT department declined. You do not have idea of what he is talking about and never had any exchange whatsoever with the IT department in the last couple of years.
What are you going to answer? That is where the “profitability framework” helps.
The Income Statement, together with the balance sheet and cash flow statement, is among the main financial statements to look at to analyze a business.
[image error]The income statement, together with the balance sheet and the cash flow statement is among the key financial statements to understand how companies perform at fundamental level. The income statement shows the revenues and costs for a period and whether the company runs at profit or loss (also called P&L statement).
It starts by showing the revenue, then expenses and eventually the bottom line: the net income.
This implies that we have all the information we need to understand how the Net Income/Loss was generated. Let’s go back to the scenario I asked you to imagine at the beginning of the paragraph.
Remember, the boss or your client asks you on the spot an opinion about something we don’t have any information about. There is no time and not even an Income Statement to look at.
The only information about the business cannot be accessed visually. The only way to access it is through questions. Therefore, it is crucial to ask the right questions, two to five to assess the situation.
To structure our thinking process we are going to use the “profitability framework”. This starts from the assumption that we do not have any information about the business but we know that the business had a loss.
This implies a sort reverse engineering of the Income Statement using the falsification process from the scientific method.
Consequently, you will start from the net profit/loss, devise a hypothesis and test it. The profitability framework is like a reversed income statement and it will look like the following:
[image error]
Once tested the hypothesis if it reveals to be true, you have to cross this framework with another business framework to have the answer you are looking for.
To test the hypothesis we have to devise a logical argument. This argument will look like an algorithm where you will ask for example: Did our revenue decrease? It yes, then drill down and figure out whether the issue relates to the price or the volume.
If not, then move on and ask: Did the expense increase? If yes, drill down further to understand whether the issue is in the variable or fixed cost.
Once established where the issue is, you will switch to a business framework to assess whether it was a problem of competition, customers, market and so on.
For example, John, the CEO of your organization, comes to you and says: “Department XYZ, an electric company experienced a decline in profitability (Net Loss), we have a board meeting in six months, how do we improve its profitability?”
Before we assess the how we have to find the why, in three simple steps and five simple questions.
Step 1: Clarify the objective/target.
You want to know: what are they looking for? (Break even or make profits) and what is the time frame. Therefore you ask:
Are we trying to break-even or to make profits? (perhaps if a company is entering a market, breaking even or also losing money might be a short-term strategy to gain market shares).What is your time frame?
The CEO explains that they are looking to break even in six months. Before the board meeting is hosted. Perfect.
Step 2: You start breaking down the case in your head.
You know that profits are comprised of revenue and cost.
Furthermore, you want to understand whether the problem is in the Revenue or in the Cost, before you start drilling down. Therefore, you ask:
Do we have any information about decreased revenue or increased costs?
The CEO explains there was a decline in revenue by 20% while the costs remained the same over time. Great.
From this simple answer you can already exclude half of the framework (the cost side) and focus on the other half (the revenue side). See below:
[image error]
Step 3 You drill down the revenues.
How? Revenue is comprised by: Price per unit and Volume. In this step, you will try to assess whether the 20% decline in revenue was due to decrease in price or decrease in sales volume.
Therefore you ask:
Has the price declined?
The CEO says the price stayed the same.
Furthermore, you ask:
Has the volume declined?
The CEO confirms the volume has fallen by 20%.
The good news is that you have narrowed the issue down in just few minutes. Indeed, your framework will look like the following:
[image error]
This leads to the end of the first stage. Indeed, we figured out “what” is causing the issue. In fact, the decrease in profitability is due to decrease in volume of sales volume.
How this happened? From there, you can move to a more context-based analysis, or business framework that looks at the overall market landscape.
Other ways to assess profitability:
Gross Profit MarginOperating Profit MarginReturn on capital employedReturn on Equity
Other key resources:
Business FrameworksBusiness Analysis FrameworkCash Flow Statement In A NutshellHow To Read A Balance Sheet Like An ExpertIncome Statement In A NutshellWhat is a Moat?Gross Margin In A NutshellProfit Margin In A NutshellWhat is a Financial RatioTypes of Business Models You Need to KnowThe Complete Guide To Business DevelopmentBusiness Strategy ExamplesWhat Is Market Segmentation? the Ultimate Guide to Market SegmentationMarketing Strategy: Definition, Types, And Examples
The post Profitability Framework And How To Analyze Profitability, Quick! appeared first on FourWeekMBA.
July 12, 2020
Cash Flow Statement: Definition Example And Complete Guide
The cash flow statement is the third main financial statement, together with income statement and the balance sheet. It helps to assess the liquidity of an organization by showing the cash balances coming from operations, investing and financing. The cash flow statement can be prepared with two separate methods: direct or indirect.
In the cash flow statement, cash Is King
When we look at the cash flow statement there are three main activities, which generate cash: operating, financing and investing.
To appreciate why a cash flow statement is useful and why it’s different from am income statement and balance sheet, let me tell you a story.
Let’s call this person “James”. He used to run a successful restaurant. Indeed, he had been in business for over ten years now. Every night he had hundreds of customers and everyone knew him in town. He was named restaurateur of the year.
The future seemed so bright. In fact, he believed that having popular customers made his business grow faster or at least made it more popular. Therefore, half of his clientele was comprised of popular people in town.
Many of them went to his restaurant and after bringing other people along, James allowed them to do so. He allowed to other prestigious customers to open credit accounts called “VIP Accounts.”
Therefore, they could come at any time and pay whenever they were able to. Initially, this seemed to work. More regular customers came in and his profits skyrocketed.
Although, business had never been so good, he was short of cash. Furthermore, salaries for half of the staff were not paid. The staff loved James and they were willing to stay few weeks more without getting paid but they expected him to pay within the month.
Taken aback he went to the bank and asked for a Loan. Once there the director of the bank, a long time friend of him wanted to help but couldn’t. Even though the business looked successful from the outside, it was bleeding from the inside.
Cash was short; nonetheless the restaurant produced $50K in profits, there was a $20K hole due to unpaid balances by customers.
In fact, the account receivables showed over $200K due, 75% of it were over two years old balances. The bank director told James if he wanted to borrow money he had to improve the cash situation.
Therefore, he turned to his managers and asked them to use any methods to collect the money lumped as accounts receivable. The AR skyrocketed in the last two years mainly due to the “VIP accounts”.
Lately though, the restaurant managers were trying to collect the balances from the customers. The VIP accounts holders felt offended.
Therefore, they decided to avoid James’ restaurant and not to pay their balances. Not only James lost the chance to collect the money lumped in the AR, but half of the clientele was gone.
Further, his employees decided to leave. James did not see any other solution that closing the business and declaring bankruptcy. The hole went from $20K to over $200K!
What seemed to be a profitable venture and what seemed to be a small cash issue, turned out to be bankrupt. This was mainly due to poor cash management.
The Three Main Sources Of Cash
What are the main sources of cash for a business?
Let’s go back to James’ story.
Initially, he had a hole of $20K due to the fact that its restaurant operations were not generating enough cash. Therefore, he went to the bank to find cash to finance the business but he was turned down.
Eventually, what killed the business was a total lack of investments in long-term assets, since James spent hundreds of thousands of dollars in marketing, with no focus whatsoever on employees or new equipment.
This is how a cash flow statement (CFS) would look like:
[image error]
As shown in the picture above, the first section is related to operations, then investing activities, eventually financing activities. Before moving on to the cash flow from operations let me clarify one thing.
Indeed, if you look at the CFS picture, you will notice a small sign “Δ” called Delta. This is the fourth letter of the ancient Greek alphabet. In our particular case Δ means change or incremental value.
In fact, the income statement and the balance sheet are reported in absolute values. For example, if you look at the P&L, the reported revenue will refer to the entire year.
Instead, in the cash flow statement each item is considered from an incremental value standpoint. If you report the accounts receivable, you will take the difference between the current-year, over the previous year.
For example, in Year Two, you have $100 of AR while in Year One you had $50. This implies that your AR grew of $50 from Year One to Year Two.
So the delta is the difference between Year Two and Year One, or $50. But what happened from the cash standpoint? Let me explain in the next paragraph.
Cash Inflow versus Cash Outflow
In order for you to fully understand the cash flow statement you have to change perspective. Indeed, so far we looked at the income statement and the balance sheet through the accrual basis lenses.
It is time now to shift your perspective to the cash basis.
What does it mean?
Well, let’s look again at the example, from the previous paragraph. Our accounts receivable went from $50 in Year One to $100 in Year Two. From the accrual standpoint, it means an increase in asset.
But what if we change perspective and we look at it from the cash standpoint? Well, from the cash standpoint means a cash outflow!
What? Why? The reason is simple.
The purpose of the CFS is to look at cash inflows and outflows for a certain time frame with no regard to profits generated.
In fact, keep in mind that an Asset increase means a cash outflow, while an Asset decrease means a cash inflow.
Instead, a Liability increase means a cash inflow, while a Liability decrease a cash outflow (to understand assets and liabilities read the balance sheet guide).
The Cash Flow matrix below will help you remember this basic assumption:
[image error]
[image error]
From the previous example, the increase in asset (AR) from Year-Two to Year-One determined a cash outflow of $50. See below:
[image error]
To recapitulate we saw that the cash flow statement takes into account the incremental values, called “Δ” (Delta) and that from the cash standpoint an increase in assets determine a cash outflow, and vice-versa, while an increase in liabilities determine a cash inflow, and vice-versa.
Cash Flow From Operations: Are We Efficient?
In this paragraph we will see how to build a cash flow from operations, using the P&L and Balance Sheet.
The main purpose of this statement is to take off from the net income the non-cash items included in it and all the cash inflows and outflows that happened in a certain period.
Let’s look at the image below:
[image error]
The net income is the starting point. Why do we start from the Net Income?
The Net Income is given by Revenue – Expense.
When revenues or expenses are generated, it does not mean cash was generated. By going back to James’ restaurant example, a profit of $50K for the year generated a hole of $20K.
Why? Well, in the specific case, most of the income reported as revenue was comprised of receivables, which were not collected for over two years.
Therefore, the purpose of the cash flow is to clean the net income from all these non-cash items and non-cash expenditure comprised in it. Let me show you now the three simple steps to build your cash flow from operations:
Step 1: find the non-cash items
Find the non-cash items. In fact, they did not contribute any cash inflow or outflow. Therefore, before we clean the net income from these items, let’s find them:
Depreciation & Amortization expense: The former is the recorded decline in value of assets. The latter is the distribution of cost for intangible assets. On one hand, they were reported as expenses in the P&L and they affected negatively the NI. Indeed, the Depreciation expense allows businesses to reduce their Profit Before Tax and by doing so, reducing their taxable income. On the other hand, the depreciation expense did not determine any cash outflow. Thereby D&A need to be added back to the NI.Impairment: When an asset loses value significantly and abruptly, we have an impairment. It happens when the carrying amount exceeds the recoverable amount. Although, it affects the Net Income negatively, since it will be reported as expense, under the P&L, it does not imply any cash outflow. Therefore, it needs to be added back to the NI. Profit/Loss on sale of non-current assets: When a non-current asset is sold, the profit/loss generated is recognized under the P&L and it will affect the net income. However, at this stage is too early to recognize the sale of the non-current asset, since this will be taken into account in the cash flow from investments. Therefore, to avoid any double counting this item will be subtracted in the OCF and added back in the Cash flow from investing. Increase/Decrease in inventory, receivable and payables: These three items taken into account altogether form the “working capital”. Defined as the resources an organization has at its disposal used to sustain the operations in the short-term; the formula for the Working capital is given by: Current Assets – Current Liabilities. In the cash flow statement though we take into account the Δ in working capital or change in working capital. This means the incremental value reported as result of the Incremental Inventory + Incremental Receivable + Incremental Payable.
Step 2: Take the Net Income and add back all non-cash items
How these items affect the cash? Let me give you an example on each item. Imagine, your restaurant business reported a net income at the end of Year-Two for $300,000, let us see how to adjust the net income to get the cash flow from operations:
Depreciation effect on cash. At the beginning of Year-One you bought the kitchen equipment. The whole cost was $100,000 and it will have a useful life of ten years and a residual value of $5,000. The depreciation expense in Year-Two is $9,500 or ($100,000 – $5,000)/10. Therefore, at the end of Year-Two an expense for $9,500 will be included as Depreciation expense in the P&L. We have to add it back for two main reasons: First the depreciation expense implies no cash outflow. Second, we will take into account the change in non-current assets through the cash flow from investments. In conclusion, we take the $300,000 earnings for Year-Two and add back $9,500 of depreciation expense (non-cash expense) = $309,500. Profit/loss on sale of non-current assets’ effect on cash. In Year-One you bought a machine to produce fresh pasta. You paid $3,000 for the machine and the estimated useful life is three years with no residual value at the end. The depreciation rate is $1,000 or $3,000/3. In Year-Two the machine is reported as worth $2,000 on your BS, since you depreciated it by 1/3 or $1,000. You eventually sell it for $2,500. It means a profit of $500 ($2,500, selling price – $2,000 asset value per BS). The profit from the sale, $500 is included already in the NI in Year-Two. We have to take them out for two reasons. First, although there is a profit of $500, this is just a “paper profit” (In the real world the machine was bought for $3,000 and sold for $2,500). Second, the Profit/Loss coming from the sale of non-current assets will be taken into account in the Cash flow from investment. Therefore, to avoid any double counting it is crucial to take it out from the OCF. Going back to the example, recall in the previous bullet point we added back the depreciation expense from the NI and we had $309,500. Furthermore, Let’s take off the “paper profit” generated by the machine sales. Therefore, $309,500 – $500 = $309,000.Net Working Capital effect on cash. As we said in step 1, the net working capital is given by: Incremental AR + Incremental Inventory + Incremental Payable. Let’s assume in Year-One you had $500,000 in AR, $240,000 in Inventory and $300,000 in AP. In Year-Two, instead, you have respectively $550,000, $200,000, and $350,000. See below how to translate the net working capital from the balance sheet to the OCF:
[image error]
Notice, the increase in AR from Year-One to Year-Two determined a decrease in cash. A decrease in Inventory determined an increase in cash and an increase in AP determined an increase in cash. Therefore, the Net working capital is $40,000, that adds up to $309,000. Eventually, we get $349,000.
Although, the NI for Year-Two was $300,000 the Net OCF was $349,000.
Cash Flow From Investing: Are We Killing The Goose?
In this section are shown the cash inflows/outflows related to non-current assets, such as property, plant and equipment. The non-current assets are the ones that generate future benefits for the organization.
Therefore, they are considered as investments.
Here the key difference to understand is between CAPEX and OPEX.
Indeed, all the money spent on acquiring things that will have a useful life over one year at least, worth more than $2,500 and that will bring future benefits to the organization can be defined as CAPEX. The rest, we’ll call it OPEX.
In this category are included all non-current assets under the balance sheet, such as: property, plant and equipment. In the previous paragraph, we saw that to avoid double counting, items such as depreciation & amortization, sales of non-current assets are added back to the net income to get the operating cash slow. Some examples of cash flows generated from investing activities are:
Disposal or Purchase of fixed assets Disposal or Purchase to buy shares or interest in other joint ventures
If we go back of the example from the previous paragraph, so far the cash generated by operating activities is $349,000. Furthermore, we want to see the cash flows generated by the investing activities.
For example, imagine, at the beginning of Year-Two you decide to renovate the building owned by the restaurant business. The building is worth $300,000 on your balance sheet.
The renovation costs you $50,000 and it lasts few months. The money spent in renovating the building is not operating expenses.
Therefore, they can be defined as capital expenditure since they increase the value of the building on the balance sheet.
From the cash standpoint this means a cash outflow of $50,000. The cash flow will look like the following:
[image error]
As you can see from the image above, the $50,000 spent to improve the building will determine a cash outflow for the same amount. Therefore, CAPEX will be (50,000), that will reduce the cash generated in Year-Two.
Cash Flow From Financing: The Cash Paradox
This is the cash generated through activities focused on raising money for the long-term growth of the business.
For any business, it is important to find the resources to grow the income in the long run. Yet, too much debt can be lethal.
On the other hand, in theory, a business not able to issue debt through banks or other creditors may be a bad signal as well (I want to stress that this is true only in theory, many small businesses – to run – do not need to optimize their debt ratios. The key principle there is avoid debt!).
In fact, when a business is lacking the credibility or trust of the markets, no one will lend money to it. For such reason, although raising debt translates to long-term liabilities and higher risk for the business, finding the optimal capital structure is crucial for any organization.
There is no magic rule for it.
And it really depends on the kind of business you are operating. Of course, if you own a manufacturing company, it will need much more resources to run the operations, since it is much more capital intensive.
Therefore, this implies a higher debt equity ratio, without making the business necessarily riskier, given its more stable income streams.
On the other hand, if you own a service or IT organization, you don’t need much capital to run the operations and given the highly competitive industry, you will report unstable income streams.
This makes the business more risky in its own right. Therefore, it is better to have a lower debt to equity ratio. Not by chance, companies such as Apple and Microsoft keep high cash reserves.
Indeed, a manufacturing company in a traditional industry has more chances to survive for decades.
An IT organization has less chance to pass two decades of life. To go back to our previous example, remember that you bought the kitchen equipment for $100,000, in Year-One.
You found the resources to buy them through one of your partners who loaned the money to the restaurant business to be repaid in three years.
At the end of Year-One you don’t make any payment, but at the end of Year-Two you decide the pay half of the debt. This means you will report a cash outflow of $50,000.
When liabilities decrease, they determine a cash outflow, since the debit is getting repaid and you are using cash to pay it back. Eventually, our cash flow will look like the following:
[image error]
At the end of Year-Two, although a NI of $300,000, the net cash for the period was $249,000, while the cash from operations was $349,000.
Due to an increase in net working capital, given by decreased inventory, that means the company sold more goods that it has purchased.
This had a beneficial effect on cash that generated a cash inflow for $40,000. Further, an increase in AP determines a cash inflow as well.
This is due to new credit condition given by suppliers. They allowed you to have more time to pay for the purchased goods or raw materials.
When a business is able to play on the time difference between accounts receivable and accounts payable, creates liquidity to run the business (Amazon cash conversion cycle is a good example).
Let me explain trough an example. Imagine, you own a business and you sell canned tomatoes. You do not produce them, since the product is bought from other tomato factories.
Therefore, after getting the canned tomato from the manufacturer, you label it and sell it to final customers. Thereby, the tomato factory is your supplier, while the retailers are your customers.
Thanks to the long-term friendship with the manufacturers you are able to secure payments every sixty days. On the other hand, your customers pay you every thirty days.
Imagine, you place the first order of canned tomatoes for $100 and you will repay them in sixty days. In the same day, the canned tomatoes are labeled and sold to customers.
They pay you $2 per piece and buy 100 pieces. At the end of the first month you generated $200 in revenue and one additional month to pay your suppliers.
Therefore, in one month you generated $100 of additional profits financed by your customers. Companies which are able to tight the AR while stretching the AP can generate additional liquidity for the organization, with no additional cost.
[image error]The cash conversion cycle (CCC) is a metric that shows how long it takes for an organization to convert its resources into cash. In short, this metric shows how many days it takes to sell an item, get paid, and pay suppliers. When the CCC is negative, it means a company is generating short-term liquidity.
Above another example of how Amazon unlocked liquidity over the years by playing on the difference between receivables, payables and inventory turnovers.
How To Read A Balance Sheet Like An ExpertIncome Statement In A NutshellWhat is a Moat?Gross Margin In A NutshellProfit Margin In A NutshellTypes of Business Models You Need to KnowThe Complete Guide To Business DevelopmentBusiness Strategy ExamplesWhat Is Market Segmentation? the Ultimate Guide to Market SegmentationMarketing Strategy: Definition, Types, And Examples
The post Cash Flow Statement: Definition Example And Complete Guide appeared first on FourWeekMBA.
The Income Statement Statement In A Nutshell
The income statement, together with the balance sheet and the cash flow statement is among the key financial statements to understand how companies perform at fundamental level. The income statement shows the revenues and costs for a period and whether the company runs at profit or loss (also called P&L statement).
Income statement explained
When you look at your P&L, it will answer questions such as:
Is the company making any return? Is the organization making enough revenues to cover for its expenses?
Let us see a real Income Statement below:
[image error]
The Income Statement or Profit and Loss is a financial statement that shows the Profit or Loss incurred by an organization in a certain period of time. In this example we saw the P&L for the year.
In addition, this statement can be produced for the year, quarter, month. In regard to reporting purposes, instead, the P&L can be published every three or six months.
In the above example the P&L shows the Income as positive and the costs as negative. There are several methods to present the P&L:
On one hand, you can use the method where costs are reported already as negative numbers compared with revenues.On the other hand, you can use another method, where all the items are shown with a positive sign and then you just subtract the costs from the revenues to obtain the Gross Profit.
Whether you decide to use the first or second method it is irrelevant, however what matters is consistency. In fact, if you use this method for your income statement you must use it across all the other financial statements you are building, to avoid confusion.
Revenue
The first item of the Income Statement is Revenue. Imagine you have a bakery that sells donuts at $1 each and you sold 100 donuts, your total revenue for the day will be $100. Even though some customers paid with credit cards and the cash on your bank account will be deposited within thirty days you will still recognize $100 in Revenue.
How can we break down the Revenue? See the diagram below:
[image error]
The two main sources of Income are coming from: core business operations or outside core business operations. Furthermore, we can identify the former as Operating and the latter as Non-Operating revenue.
Operating Revenue
They are generated by the sales coming from the core product an organization produces.
Example: Imagine owning a Pizza Store. The income generated by selling pizzas will be considered an Operating Revenue. In the example, the Operating Revenue formula is: price per unit times Units Sold (Volume). Indeed, if the price for your pizza is at $1 per unit, and 100 pizzas were sold, your revenue will be $100.
Non-Operating Revenue.
They are generated by sales coming from other sources.
Example: Imagine your Pizza Store business is going pretty well and you are generating cash in excess that can be invested in short term instruments such as bonds. Later, you go to the bank and buy $1,000 of T-Bills. This is a short-term debt obligation backed by U.S. government with a maturity of less than one year. Your T-Bills are due in six months, after that you will receive a simple interest of 2% annually or $10. The $10 you receive after six months is Interest Income or non-operating revenue, also described as incidental or peripheral income. However, on your balance sheet the interest income will be reported after the interest expense, almost like an offsetting. It is more accurate to report the interest income together with the other non-operating expenses. In this way the income generated by interests will not distort our Gross Income.
Indeed, the Gross Income divided by sales gives us the gross margins, which is a metric of operational efficiency.
Expense
The other main component of the income statement is cost/expense. There are many costs incurred by an organization. That is why most of the time can be very tricky to categorize them. In addition, cost categorization is crucial for any business, since they represent a big piece of the pie of any organization’s profits. If not managed properly can lead to big issues, ultimately to bankruptcy. In fact, there are several methods that can be used to classify costs, such as: Operating vs. Non-operating, Direct vs. Indirect, Variable vs. Fixed. It all depends by the perspective from which you look at them. Each one of these methodologies has the purpose of better understanding the cost structure of the organization. It is called “cost accounting”.
There are several types of expenses classified in the income statement. Let’s take into account three main categories of costs for reporting purposes:
Cost of Goods Sold (COGS)Operating ExpensesNon Operating Expenses
Cost of Goods Sold (COGS)
This is the cost incurred to generate the revenue for the period in consideration. For example, a company who produces Smart Phones will have actual costs of production.
These costs, such as: Raw Materials, Wages associated to manufacturing, Overhead costs of running the factories, will be all considered COGS. These costs can be defined as direct costs as well.
After subtracting COGS from Revenue we get the Gross Profit.
This metric can be pretty useful in assessing the profitability and efficiency of the business when it comes to the manufacturing process.
[image error]The gross margin is a financial ratio metric, which helps assess the profitability of a business and also its operational efficiency. Indeed, as gross margins take into account cost of goods sold (the cost incurred to deliver the software to the customer) it’s a measure to assess the value of a business.
Operating Expenses
These are all the costs not included in the COGS.
These costs are related to the operations of the business, such as: Advertising, salaries and wages, phone and Internet. However, they are not incurred to generate sales or at least in many cases it is hard to track the effect of this cost over the additional sale incurred by the organization.
After subtracting the operating expenses from Gross Profit we get the Operating Profit. This metric is useful as well to assess the profitability and efficiency of the business when it comes to the overall operations.
Non-Operating Expenses
The remaining costs not included in the previous categories.
They are incurred outside the business operations.
Example: Imagine you own a Coffee Shop. Suddenly your sales plunge, you still need money to finance the operations, since the alternative would be closing the business. Therefore, you go to the bank and ask for a short-term loan of $4,000 that will be repaid in six months. The loan will carry a simple interest of 5% annually. Therefore, at the end of the six months, after paying the principle, you will eventually pay for the interest of $100. The money paid as interest will show under the Income Statement as interest expense for that period.
The revenue minus the operating and non-operating expenses for the period, give us the Net Income. This metric is very important to assess the overall efficiency and profitability of the business. We will see it in detail in Chapter
Connecting the dots: Net profits explained
Whichever profits are shown on your income statement they do not tell you anything about cash.
It might be a shocking truth for who is new to Accounting. Indeed, this is not always true, especially if we operate under the cash basis, instead of the accrual basis principle.
On the other hand, most companies operate under the accrual principle. Thus, while the income statement and its bottom line, the net profits will tell us the story on whether the business model is viable.
It won’t tell us the story on whether the business is liquid (for that we’ll need the cash flow statement).
Example: Imagine you own a bakery that sold $1,000 in chocolate cakes in the first month. This event does not imply that you have $1,000 on your bank account. In fact, most of the time customers pay within 60/90 days. Therefore, half was received in cash; the other half was bought on credit. Thus, the first half ($500) is an actual cash inflow, the other half ($500), instead will be reported on your Balance Sheet. The transaction can be recorded like the following:
[image error]
Imagine now, the bakery incurred $500 of expenses in that same period for raw materials; Half is purchased on account, and half paid on account. This implies a cash outflows for $250. The other half will show on the Balance Sheet, under Accounts Payable (Current Liability’s Section). See below:
[image error]
How To Read A Balance Sheet Like An ExpertWhat is a Moat?Gross Margin In A NutshellProfit Margin In A NutshellTypes of Business Models You Need to KnowThe Complete Guide To Business DevelopmentBusiness Strategy ExamplesWhat Is Market Segmentation? the Ultimate Guide to Market SegmentationMarketing Strategy: Definition, Types, And Examples
The post The Income Statement Statement In A Nutshell appeared first on FourWeekMBA.
Supply Chain In A World Driven By Bits
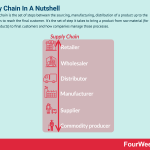
The supply chain is the set of steps between the sourcing, manufacturing, distribution of a product up to the steps it takes to reach the final customer. It’s the set of step it takes to bring a product from raw material (for physical products) to final customers and how companies manage those processes.
Supply chain in a nutshell
The supply chain represents the set of steps it takes to bring a product from raw to finished. And together with it, it also represents the set of steps it takes to bring the product to the final customers.
All the activities needed to fulfil this mission are part of a supply chain.
Imagine a Starbucks espresso. Before it turns into it, it follows a whole supply chain from bean to cup of coffee. All the steps taken from bean to cup of coffee in a Starbucks store will represent the supply chain for that product.
Beyond distribution
In some cases, supply chain and distribution are used interchangeably. However, distribution‘s main focus is to bring the product in the hands of final customers, supply chain represents all the steps to make and also distribute that product.
[image error]
Yet, depending from the position in the supply chain distribution can take on several forms, all depending to how the customer looks like.
In short, distribution is a marketing activity skewed toward the final customer. If you’re a producer who doesn’t sell its product directly to customers, then distribution will be primarily about dealing with wholesalers, that in turn will distribute the product downstream, until it reaches the final customer.
[image error]A digital channel is a marketing channel, part of a distribution strategy, helping an organization to reach its potential customers via electronic means. There are several digital marketing channels, usually divided into organic and paid channels. Some organic channels are SEO, SMO, email marketing. And some paid channels comprise SEM, SMM, and display advertising.
The supply chain instead comprises all the processes that go from raw materials, sourcing, logistics, and distribution.
Upstream vs. downstream
[image error]The supply chain comprises all the steps from raw materials to final customer. Companies can expand within the supply chain by moving upstream (controlling more steps toward production and manufacturing) or downstream (by covering more steps toward the final customer). When moving downstream the company will get closer to final customers through the supply chain. If it goes upstream it will get closer to the sourcing and production.
Why do companies move upstream?
When companies move upstream, they have more control over sourcing and manufacturing of the product. That can give the company more control over the quality of the product. Also, by moving upstream the company can retain more margins, and take advantage of economies of scale.
Why do companies move downstream?
When companies move downstream they get closer to customers, thus gaining more control over customer experience. Any integration, either upstream or downstream can be expensive, yet companies gain more control to ensure the quality of the product (upstream) and the quality of the customer experience (downstream).
Moving both ways
In some cases, companies move in both directions, to enable a fully integrated vertical strategy. The Luxottica case study is a good example of integrating both upstream (toward production) and downstream (toward the sale to final customers it its own retail stores).
Upstream integration case study: Google starts to make its own devices
For years Google had been looking into building its own smartphones. Being the owner of Android, Google now had the chance to take a step upstream the supply chain of data by manufacturing its own phones.
And yet, the first official launch of the Pixel phone only happened in 2016. Google moved upstream by building its own devices, which also led it to be a step closer to customers’ value chain.
The physical phone, part of the Google‘s supply chain could be used as the basis also of acquisition of users’ data, in line with the Google business model.
Therefore, when Google got upstream in the supply chain. It also got downstream in the “data supply chain” as it could gather data closer to users.
Downstream integration case study: Apple starts to build its stores
Back in 2001, Apple launched its own stores. As it highlighted at the time:
“The Apple stores offer an amazing new way to buy a computer,” And Steve Jobs, continued, “rather than just hear about megahertz and megabytes, customers can now learn and experience the things they can actually do with a computer, like make movies, burn custom music CDs, and publish their digital photos on a personal website.”
This downstream integration, over the years, also worked as a powerful distribution strategy that enhanced customer experience for Apple‘s products.
[image error]
While Apple’s stores are extremely expensive to build and maintain, and they do not represent the majority of Apple’s sales. They worked as iconic locations where customers could recognize the Apple’s brand at scale.
And also the place where Apple could build a set of ancillary services for its own devices.
Supply chain vs. customer value chain
[image error]Horizontal integration refers to the process of increasing market shares or expanding by integrating at the same level of the supply chain, and within the same industry. Vertical integration happens when a company takes control of more parts of the supply chain, thus covering more parts of it.
Where the supply chain comprises the steps and actions needed to bring the product from production to sale.
The customer value chain is about the actions the customers take when acquiring a product, and the values they get at each step of the journey.
Supply chains in the bits world
[image error]In business, vertical integration means a whole supply chain of the company is controlled and owned by the organization. Thus, making it possible to control each step through consumers. in the digital world, vertical integration happens when a company can control the primary access points to acquire data from consumers.
Vertical integration can also work in the digital/bits world. Where companies get closer to the customer both upstream and downstream.
In the “data supply chain” the hardware is the closest thing to the customer, therefore we can also consider it to be downstream.
[image error]In a data supply chain the closer the data to the customer the more we’re moving downstream. For instance, when Google produced its own physical devices. While it moved upstream the physical supply chain (it became a manufacturer) it moved downstream the data supply chain as it got closer to consumers using those devices, so it could gather data directly from the market, without intermediaries.
Breaking down the supply chain as a business strategy
[image error]When entering the market, as a startup you can use different approaches. Some of them can be based on the product, distribution or value. A product approach, takes existing alternatives and it offers only the most valuable part of that product. A distribution approach, cuts out intermediaries from the market. A value approach offers only the most valuable part of the experience.
When companies remove steps in the supply chain, thus making it shorter, this is a process of disintermediation.
[image error]Disintermediation is the process in which intermediaries are removed from the supply chain, so that the middlemen who get cut out, make the market overall more accessible and transparent to the final customers. Therefore, in theory, the supply chain gets more efficient and, all in all can produce products that customers want.
In some cases, supply chain might change over time, as those same companies that disintermediated some steps, they might introduce new logics to an existing supply chain.
For instance, in the last-mile problem we saw how Amazon might be disintermediating existing and dominating delivery services, to reintroduce new mechanics of last-mile delivery.
[image error]Reintermediation consists in the process of introducing again an intermediary that had previously been cut out from the supply chain. Or perhaps by creating a new intermediary that once didn’t exist. Usually, as a market is redefined, old players get cut out, and new players within the supply chain are born as a result.
Tesla integrating and disintermediating
[image error]Tesla is vertically integrated. Therefore, the company runs and operates the Tesla’s plants where cars are manufactured and the Gigafactory which produces the battery packs and stationary storage systems for its electric vehicles, which are sold via direct channels like the Tesla online store and the Tesla physical stores.
A good example of both integration and disintermediation, is how Tesla controlled more steps of the supply chain, from production to distribution. While at the same time, it disintermediated the traditional car dealer, by selling its vehicles directly in its Tesla store, and on its e-commerce.
Luxottica integrating and intermediating
[image error]
Luxottica is a good example of a company that took control of more steps in the supply chain, while positioning itself as the go-to licensor for luxury brands, from Bulgari, to Prada, Chanel and many more that produce their sunglasses through Luxottica.
Read more:
Horizontal IntegrationVertical IntegrationWhat is Disintermediation What is a Moat?Types of Business Models You Need to KnowBusiness Strategy: Definition, Examples, And Case StudiesMarketing Strategy: Definition, Types, And ExamplesPlatform Business Models In A NutshellNetwork Effects In A NutshellGross Margin In A Nutshell
The post Supply Chain In A World Driven By Bits appeared first on FourWeekMBA.
July 11, 2020
Horizontal Vs. Vertical Integration In A nNutshell
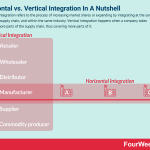
Horizontal integration refers to the process of increasing market shares or expanding by integrating at the same level of the supply chain, and within the same industry. Vertical integration happens when a company takes control of more parts of the supply chain, thus covering more parts of it.
Quick glance at Vertical Integration
[image error]In business, vertical integration means a whole supply chain of the company is controlled and owned by the organization. Thus, making it possible to control each step through consumers. in the digital world, vertical integration happens when a company can control the primary access points to acquire data from consumers.
Vertical integration is about moving upward, or downward the supply chain to either get closer to product sourcing and manufacturing, therefore improve quality or quality control over the steps it takes to make the product.
Or moving toward the end customer, thus getting closer to the customers . Or both ways.
Luxottica case study
[image error]
Luxottica business model is a great example of vertical integration, and how over the years it managed to control the overall supply chain, both from a manufacturing standpoint, and a retail standpoint.
Google KaiOS case study
[image error]KaiOS is a mobile operating system built on the ashes of the discontinued Mozilla OS. Indeed, KaiOS has developed a robust standalone mobile operating system that turns feature phones (so-called “dumb phones”) into smartphones-like phones.
As feature phones powered by KaiOS have access to mobile apps, connectivity and voice search. KaiOS feature phone business model wants to bring connectivity and the digital revolution to those developing countries (like India and Africa) that have missed out on the smartphone wave due to too high costs of those devices.
Besides, KaiOS might be well suited for the IoT revolution!
When Google put his assistant on millions of phones running the KaiOS operating system, those feature phones turned smartphones, became the basis for Google’s assistant to gather valuable data.
That is how a digital vertically integrated pipeline looks like.
Quick glance at Horizontal Integration
[image error]
Horizontal integration refers to the process of increasing market shares or expanding by integrating at the same level of the supply chain, and within the same industry. Perhaps, a manufacturer who buys or merges with another manufacturer, in the same industry, is an example of horizontal integration.
Facebook acquired Instagram and kept it as independent product (for a few years)
[image error]Instagram makes money via visual advertising. As part of Facebook products, the company generates revenues for Facebook Inc. overall business model. Acquired by Facebook for a billion dollar in 2012, today Instagram is integrated into the overall Facebook business strategy. In 2018, Instagram founders, Kevin Systrom and Mike Krieger, left the company, as Facebook pushed toward tighter integration of the two platforms.
Back in 2012, Facebook acquired Instagram, for a billion dollar. What seemed expensive at the time, for a mobile app that wasn’t profitable, it became among the most valuable products for the Facebook portfolio.
The horizontal acquisition of Instagram enabled Facebook to dominate the social media industry for yet another decade.
Read next:
Horizontal IntegrationVertical IntegrationWhat is a Moat?Types of Business Models You Need to KnowBusiness Strategy: Definition, Examples, And Case StudiesMarketing Strategy: Definition, Types, And ExamplesPlatform Business Models In A NutshellNetwork Effects In A NutshellGross Margin In A Nutshell
The post Horizontal Vs. Vertical Integration In A nNutshell appeared first on FourWeekMBA.
Horizontal Integration In A Nutshell
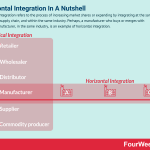
Horizontal integration refers to the process of increasing market shares or expanding by integrating at the same level of the supply chain, and within the same industry. Perhaps, a manufacturer who buys or merges with another manufacturer, in the same industry, is an example of horizontal integration.
[image error]
Horizontal integration, just like vertical integration can happen in several ways. Companies willing to expand will do that by either using their internal resources to take more space within the same part of the supply chain and within the same industry (internal expansion).
Or they might merge, by forming a single entity. Or through acquisition.
When and why horizontal expansion makes sense?
Horizontal expansion can happen for several reasons:
Limiting competition: in some cases, companies look to dominate specific segments of a market, to retain a competitive advantage, for longer. Growth and expansion: horizontal integration can shortcut the growth and expansion within the same industry. Economies of scale: in theory, horizontal integration might help the merged companies to benefit from economies of scale.Survival: in other cases, horizontal acquisition also helps in surviving a market getting increasingly competitive.
What are the potential drawbacks of horizontal integration?
Market monopolies: horizontal integrations can limit competition, at the point of creating monopolies, which overall might reduce the options for consumers. On the other hand, they also raise regulatory concerns. Diseconomies of scale: while in theory horizontal integration can create economies of scale, in practice, from integrating two different groups in he same industry can also lead to the opposite, effect, diseconomies of scale. Cultural clashes: the hardest part of integrating or merging companies, might be about really making it work from a cultural standpoint. And as horizontal integration usually works by creating a new, larger group. This renewed scale might cause cultural clashes, which are hard to overcome.
Horizontal integration case studies
Let’s see a set of horizontal integrations happened in the digital era, which might help us understand how the process has been used by current market players to expand, defend or redefine their business models.
Uber Eats’ acquisition of Postmates to stay competitive in the meal delivery industry
[image error]Uber Eats is a three-sided marketplace connecting a driver, a restaurant owner and a customer with Uber Eats platform at the center. The three-sided marketplace moves around three players: Restaurants pay commission on the orders to Uber Eats; Customers pay the small delivery charges, and at times, cancellation fee; Drivers earn through making reliable deliveries on time.
Uber Eats is among the largest players in the meal delivery industry. Launched by Uber, it gained traction quickly, and it became among the largest players in the US.
In July 2020, Uber announced a multi-billion dollar deal, which would enable it to be among the largest players, as a result of the consolidation happening in the meal delivery industry, which leads us to the next example.
The merger between GrubHub and JustEat to create one of the largest meal delivery players on earth
[image error]Grubhub is an online and mobile platform for restaurant pick-up and delivery orders. In 2018 the company connected 95,000 takeout restaurants in over 1,700 U.S. cities and London. The Grubhub portfolio of brands like Seamless, LevelUp, Eat24, AllMenus, MenuPages, andTapingo. The company makes money primarily by charging restaurants a pre-order commission and it generates revenues when diners place an order on its platform. Also, it charges restaurants that use Grubhub delivery services and when diners pay for those services.
In June 2020, GrubHub and JustEat merged in a deal worth over seven billion dollars, to create one of the largest meal delivery players in the world. The deal happened after Uber had been looking into the possibility of acquiring GrubHub.
That raised concerns as it would have created a monopoly in the US. At the same time GrubHub and Uber might have not found a deal given their cultural differences.
As the deal slipped, the merger between GrubHub and JustEat got finalized.
TikTok acquisition of Musical.ly and its rebranding
[image error]TikTok is the Chinese creative social media platform primarily driven by short-form video content. It launches challenges of various types to tap into the creativity of its users and generate engaging (if not addicting content) accessible via an infinite feed. TikTok primarily makes money through advertising, thus making it an attention-based business model.
Back in 2017, TikTok acquired Music.ly and by 2018 it rebranded it within its own app, to create a single platform, which scaled extremely quickly.
TikTok, therefore, used the acquisition of Music.ly to expand, quickly.
Facebook acquired Instagram and kept it as independent product (for a few years)
[image error]Instagram makes money via visual advertising. As part of Facebook products, the company generates revenues for Facebook Inc. overall business model. Acquired by Facebook for a billion dollar in 2012, today Instagram is integrated into the overall Facebook business strategy. In 2018, Instagram founders, Kevin Systrom and Mike Krieger, left the company, as Facebook pushed toward tighter integration of the two platforms.
Back in 2012, Facebook acquired Instagram, for a billion dollar. What seemed expensive at the time, for a mobile app that wasn’t profitable, it became among the most valuable products for the Facebook portfolio.
At the time, Facebook opted for a multi-product strategy (for the first time), where Instagram was left as an independent product of the Facebook family, free to develop on its own, and by slowly integrating it into the Facebook ecosystem.
Yet, over the years, Facebook tightened its clasp over Instagram, and it became part of its advertising platform. Today Instagram is the product that makes most of the revenues for Facebook, as it successfully converted to mobile.
In addition, thanks to Instagram, Facebook also managed to thrive in the coming wave of social media apps. Where Facebook had to convert its website to mobile, and it took a few years. Instagram was native to that!
Read next:
Vertical IntegrationWhat is a Moat?Types of Business Models You Need to KnowBusiness Strategy: Definition, Examples, And Case StudiesMarketing Strategy: Definition, Types, And ExamplesPlatform Business Models In A NutshellNetwork Effects In A NutshellGross Margin In A Nutshell
The post Horizontal Integration In A Nutshell appeared first on FourWeekMBA.
Profit Margins In The Era Of Unprofitable Tech Platforms
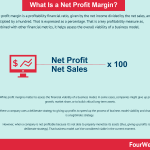
The profit margin is a profitability financial ratio, given by the net income divided by the net sales, and multiplied by a hundred. That is expressed as a percentage. That is a key profitability measure as, combined with other financial metrics, it helps assess the overall viability of a business model.
Do profit margins still matter?
In the era of digital platforms, many of which unprofitable, the question on whether profitability still matters becomes subject of discussion here and there.
I want to shed some lights on why profitability still matters, and in which exceptions we can give up profitability for something else.
In short, there are some cases, where lack of profitability becomes a deliberate financial and operational strategy, where companies give it up because they are focusing on some other aspects of the business.
Free cash flows in place of profit margins
Jeff Bezos recounted in a shareholders’ letter, back in 2006:
As our shareholders know, we have made a decision to continuously and significantly lower prices for customers year after year as our efficiency and scale make it possible.
This might seem a trivial decision now, that Amazon turned into a tech giant. Yet, back then Jeff Bezos also highlighted:
However, our quantitative understanding of elasticity is short-term. We can estimate what a price reduction will do this week and this quarter. But we cannot numerically estimate the effect that consistently lowering prices will have on our business over five years or ten years or more.
He had an important point, which he could not back up with that, but only with business intuition. As he further explained:
Our judgment is that relentlessly returning efficiency improvements and scale economies to customers in the form of lower prices creates a virtuous cycle that leads over the long term to a much larger dollar amount of free cash flow, and thereby to a much more valuable Amazon.com.
What was puzzling at the time, would become one of the most important choices Amazon made.
[image error]Amazon is a profitable company. Its operating income and net income passed $12.4 billion and $10 billion respectively in 2018. The operating income was driven primarily by Amazon AWS, contributing $7.29 billion. Amazon has been consistently profitable since 2015 when it posted 596 million in profits.
For many years, Amazon has been unprofitable or barely so, as it was deliberately prioritizing, both at operational and financial level on free cash flows, which could be used to unlock shorter term growth for its operations.
This is at the core of Amazon cash conversion cycle.
In order for that mechanism to work, Amazon had to make sure to have fast inventory turnover, fast cash collection from customers, and slower payments to third-party sellers/suppliers.
[image error]The cash conversion cycle (CCC) is a metric that shows how long it takes for an organization to convert its resources into cash. In short, this metric shows how many days it takes to sell an item, get paid, and pay suppliers. When the CCC is negative, it means a company is generating short-term liquidity.
As a reference, even during the pandemic Amazon managed to unlock substantial cash from operations, which it used to make its inventory level faster, its delivery shorter, and its service more widely available.
[image error]Throughout the COVID pandemic, Amazon recorded a substantial increase in revenues that also resulted in more cash from operating activities (Amazon has positive cash conversion cycles). However, cash was spent from operations to expand shipping and fulfillment. And from investing activities in increasing the capability of the Amazon tech platform (AWS).
Once again, the lack of profitability, for several years, has been exchanged in place of free cash flows and growth.
The free cash flows unlocked enabled Amazon to build a better infrastructure, further lower its prices, improve the variety of products on the platform, expand globally, and launch new products and segments.
[image error]
Long-term assets in place of profit margins
[image error]Netflix is a profitable company. It generated over $1.2 billion in 2018, a 116% increase compared to 2017, primarily driven by substantial growth in paid memberships. However, Netflix has negative cash flows as it invests massively on content license agreements and original content.
When Netflix turned to original programming, back in 2013, it wasn’t a simple choice, it meant the transition from entertaining platform to entertaining brand.
That might seem a trivial change, yet this is a whole business model change.
Over the years, as Netflix developed its own content, it had also more control over the format, and how it delivered, and distributed it. Which would lead to binge-watching as a content model, which explains well the Netflix business model.
[image error]Binge-watching is the practice of watching TV series all at once. In a speech at the Edinburgh Television Festival in 2013, Kevin Spacey said: “If they want to binge then we should let them binge.” This new content format would be popularized by Netflix, launching its TV series all at once.
In short, Netflix was building up the assets that would lead to a whole new business model, with a stronger brand, proprietary content, strong tech infrastructure, much larger subscription-base, better distribution model.
In addition, over the years, Netflix gained more freedom over content formats, programming and the distribution of that content on its own platform.
Thus, it created a stronger moat.
[image error]Economic or market moats represent the long-term business defensibility. Or how long a business can retain its competitive advantage in the marketplace over the years. Warren Buffet who popularized the term “moat” referred to it as a share of mind, opposite to market share, as such it is the characteristic that all valuable brands have.
A business model revolution!
[image error]
This leads us also to another key point.
Market shares in place of profit margins
Stil taking into account the Netflix business model and how it changed over the years. As Netflix was building up its assets, it was running at lower profits margins and negative cash flows (it still does), but it was also gaining market shares, in a competing industry, with established, long-time players (like Disney).
As as Netflix business strategy rolled out (this transition took almost a decade) Netflix became as valuable (from a market standpoint) as Disney.
As of July 2020, Netflix market capitalization passed $240 billion, passing Disney market cap of over $215 billion.
As Netflix gave away operational and financial efficiency, it gained market shares and it expanded the video streaming market, thus expanding the overall value for the company.
[image error]Example of how, over the years Netflix expanded as a result of surfing and creating new markets. What’s next?
Key takeaway
Profitability is extremely important to evaluate businesses. Indeed, as the market conditions change quickly, the companies that are most sustainable from a profitability standpoint might also be the ones surviving.
However, for a period of time a company might be giving up profitability as a deliberate strategy to:
Unlock more cash for growth: like Amazon’s case shows, you can pass lower prices to customers, further grow the platform and still have plenty of cash left for expansion. Build long-term assets that create moats: moats are business defences that companies build up over the years as they expand their strategic assets. As in Netflix case study, the company gave up for years profitability (and it still does) in exchange for building up assets that changed and are still changing its business model. Gain market shares: in some other instances companies might be giving up profitability to gain market shares.
In most other cases, where companies are simply not profitable, because they could not pull off a proper business model, that’s an example of a company that isn’t viable, yet.
Read next:
What is a Moat?Is Netflix Profitable?Is Amazon Profitable?Netflix Business Model Amazon Business ModelUnderstanding Netflix Business Model Thorough Binge-WatchingAmazon Cash Conversion CycleTypes of Business Models You Need to KnowBusiness Strategy: Definition, Examples, And Case StudiesMarketing Strategy: Definition, Types, And ExamplesPlatform Business Models In A NutshellNetwork Effects In A NutshellGross Margin In A Nutshell
The post Profit Margins In The Era Of Unprofitable Tech Platforms appeared first on FourWeekMBA.
What Is A Moat? Moats, And Share Of Mind In The Digital Era
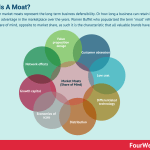
Economic or market moats represent the long-term business defensibility. Or how long a business can retain its competitive advantage in the marketplace over the years. Warren Buffet who popularized the term “moat” referred to it as a share of mind, opposite to market share, as such it is the characteristic that all valuable brands have.
The father of economic moats
In a speech to MBA students, Warren Buffet highlighted what a moat is about.
Holding in his hands a can of soda, Warren Buffet said “you can understand this – referring to the popular cherry soda – anybody can understand this I mean this is a product that basically hasn’t been changed.”
Warren Buffet kept highlighting how the business staid the same over a long period of time, “…since 1886 or whatever it was and it’s a simple business, it’s not an easy business I don’t want a business that’s easy for competitors so I wanted a business with a moat around it.”
And he went on defining moats as castles administered by hardworking and capable dukes (its managers), “I want a very valuable castle in the middle and then I want a duke who’s in charge of that castle to be honest and hardworking and able.”
Then finally he gives some examples of moats in several industries, “…I want a big moat around the castle and that moat can be various things the moat in a business like our auto insurance business at Geico is low cost, I mean if people have to buy auto insurance so everybody’s going to have an auto insurance policy per per car basically for driver and and I can’t sell them 20 you know but but they have to buy one what are they going to buy on they’re going to buy on based on service and cost.”
Moats are not market shares
While many do associate moats with market shares, Warren Buffet highlighted “if you’ve got a wonderful castle (referring to moats) there are people out there going to try and attack it and take it away from you and I want a castle that I can understand but I want a castle with a motor on it.”
Yet moats have something more. Valuable brands do not only take market shares, they gain market shares as a result of something else, which Warren Buffet calls “share of mind.”
When explaining the Kodak’s case, Warren Buffet highlighted, “30 years ago Kodak’s moat was was just as white as coca-cola smoke…they had what I call share of mind. Forget about share market…they had something and everybody’s mind around the country around the world with a little yellow boxing ring that said Kodak is the best, that’s priceless.”
Moats as widening business fences
Warren Buffet kept highlighting, how Coca-Cola (one of his favorite brands and portfolio companies, had just that.
You can’t see the moat day by day but every time you know the infrastructure gets built in some country that isn’t yet profitable for Coke but will be 20 years from now. The moat is widening a little bit that things are all the time changing that moat in one direction other ten years from now you can see the difference. our managers are the businesses we run I’ve got one message to them you know which is the widening moat.
Below example of what Warren Buffet has in mind. As explained, in the Coca-Cola system, as the company enters new markets, as a go to market strategy, it will control most of the operations.
Yet, once operations have been established, Coca-Cola divests, and it follows a franchising model, where it holds control over its franchisees as the company is the sole distributor of the product, and by keeping some equity invested.
[image error]Coca-Cola follows a business strategy (implemented since 2006) where through its operating arm – the Bottling Investment Group – it invests initially in bottling partners operations. As they take off, Coca-Cola divests its equity stakes, and it establishes a franchising model, as long-term growth and distribution strategy.
I redefined this model, franchained.
[image error]In a franchained business model (a short-term chain, long-term franchise) model, the company deliberately launched its operations by keeping tight ownership on the main assets, while those are established, thus choosing a chain model. Once operations are running and established, the company divests its ownership and opts instead for a franchising model.
This is an example, of how Coca-Cola combines branding, distribution, operational and financial efficacy, as it enters new markets, while retaining its brand’s “share of mind” as it keeps scaling its operations.
Market moats are about business defensibility
David George and Alex Immerman, partners at venture capital firm, a16z, when talking about gross margin, they pointe out how those alone are misleading. And it all goes back to what really drives business value.
As they further point out “business quality is about defensibility. Defensibility comes from moats.”
In short, if a company is focusing on higher gross margins at the expense of business defensibility that might over time translate in loss of competitiveness of the business.
But what makes up a moat? There are several ways to build moats and in many cases, depending on the market contexts a moat will come from the mixture of several elements.
Market moats is about the brand and the share of mind
One of the most powerful business defences is the brand, or the direct access to your customer base. For instance, if you take Facebook, it’s still among the most valuable websites on earth, because people recognize its brand.
There is no intermediary, people access their Facebook app, or go directly on the Facebook login page. This is critical, as over time it defends against disintermediation.
[image error]Disintermediation is the process in which intermediaries are removed from the supply chain, so that the middlemen who get cut out, make the market overall more accessible and transparent to the final customers. Therefore, in theory, the supply chain gets more efficient and, all in all can produce products that customers want.
If, let’s say, Facebook depended solely on traffic coming from Google, the day Google had launched its social network, it would have killed Facebook.
Yet, as the product and brand was recognized and people got straight to the source, it didn’t need any intermediary.
Customer obsession
If you take the case of Amazon, over the years it has had a relentless focus on low price, convenience, variety and great delivery, in a mixture they defined “customer obsession.”
[image error]Customer obsession goes beyond quantitative and qualitative data about customers, and it moves around customers’ feedback to gather valuable insights. Those insights start by the entrepreneur’s wandering process, driven by hunch, gut, intuition, curiosity, and a builder mindset. The product discovery moves around a building, reworking, experimenting, and iterating loop.
This built-in low price, convenience and variety took years to build, and in Amazon’s case that was a combination of operational model: inventory facilities and systems; financial model: Amazon gave up profitability for free cash flows), customer modeling (through its e-commerce, Amazon could know exactly what customers wanted); and business experimentation: Amazon launched many failed products that it thought customers would be excited about.
Among those failed launches though, it also came up with things like Amazon Prime and Amazon AWS, which are among the most successful parts of the business.
Low cost
For players in industries where the products offered are mostly undifferentiated, moats are created by economies of scale combined with low costs.
As Warren Buffet explains in his speech about moats, an insurance business like Geico, a lot of defensibility comes with offering lower prices.
Differentiated technology
In a software world where hundreds of new products are launched to market everyday, building up differentiation (in terms of features, technology and value proposition) is a key element.
Distribution
[image error]A distribution channel is the set of steps it takes for a product to get in the hands of the key customer or consumer. Distribution channels can be direct or indirect. Distribution can also be physical or digital, depending on the kind of business and industry.
While strong products and brands can draw directly from their user or customer base. Having a strong distribution network is also a key element.
As highlighted in the Google TAC and if we look at the costs associated to the money invested into distribution of some of the most valuable brands, this goes in the multi-billion dollar mark.
Economies of scale
Economies of scale enable companies to improve efficiency and profitability as the company scales (beware though of diseconomies of scale).
This is one of the elements of creating market moats.
[image error]In Economics, a Diseconomy of Scale happens when a company has grown so large that its costs per unit will start to increase. Thus, losing the benefits of scale. That can happen due to several factors arising as a company scales. From coordination issues to management inefficiencies and lack of proper communication flows.
Growth capital
In periods of economic expansion, when capital becomes available for companies to expand in riskier markets, those companies give up efficiency to gain scale.
This sort of blitzscaling mode, can help companies gain market shares quickly, in markets that are new, but are becoming hot from an investing standpoint.
[image error]Blitzscaling is a business concept and a book written by Reid Hoffman (LinkedIn Co-founder) and Chris Yeh. At its core, the concept of Blitzscaling is about growing at a rate that is so much faster than your competitors, that make you feel uncomfortable. In short, Blitzscaling is prioritizing speed over efficiency in the face of uncertainty.
Those players able to open the market, and retain it, might become long-term dominators. This risky game, however, is good as long as the economy keeps expanding, and the growth capital is available for the company burning cash at fast speed.
If, by luck, good timing, or continued growth, the company is able to sustain this mode of aggressive growth, a competitive advantage can be created.
Examples of this are companies that are opening up new markets, that are still yet to be defined (take the Uber case).
Network effects
[image error]A platform company generates value by enabling interactions, transactions or relationships. A platform company leverages network effects (direct/same side or indirect). Platform companies are also known as platform business models, given their intrinsic way to create value for users.
This is true for platform business models. Where in economies of scale the company gains in efficiency and profitability as it grows (it lowers its per cost unit). In network effects, the platform becomes more valuable as its per user value grows as more users join (beware of negative or reverse network effects).
[image error]In a negative network effect as the network grows in usage or scale, the value of the platform might shrink. In platform business models network effects help the platform become more valuable for the next user joining. In negative network effects (congestion or pollution) reduce the value of the platform for the next user joining.
Value proposition and perception
[image error]A value proposition is about how you create value for customers. While many entrepreneurial theories draw from customers’ problems and pain points, value can also be created via demand generation, which is about enabling people to identify with your brand, thus generating demand for your products and services.
Understand what’s the killer use case that makes your product valuable in the hands of several types of customers is another key ingredient.
While this might go beyond the engineering world, and as such it might seem more foggy, it is though one of those elements that make a long-term difference.
In short, are you willing to test, and experiment with your product to find value propositions that fit the market? If so, you product will evolve contextually, to create moats.
Business model innovation
[image error]A business model is a framework for finding a systematic way to unlock long-term value for an organization while delivering value to customers and capturing value through monetization strategies. A business model is a holistic framework to understand, design, and test your business assumptions in the marketplace.
Those factors combined are all part of your business model recipe, and it often becomes evident only in hindsight. And it takes years to build. What’s left is a lot of business experimentation, a strong long-term vision.
Read next:
Types of Business Models You Need to KnowBusiness Strategy: Definition, Examples, And Case StudiesWhat Is Market Segmentation? the Ultimate Guide to Market SegmentationMarketing Strategy: Definition, Types, And ExamplesWhat is Blitzscaling? What is Growth Hacking?What is Disintermediation Platform Business Models In A NutshellNetwork Effects In A NutshellWhat Are Diseconomies Of Scale And Why They Matter
The post What Is A Moat? Moats, And Share Of Mind In The Digital Era appeared first on FourWeekMBA.


