
Jonathan Clements's Blog, page 258
October 27, 2021
Feeling Better
���I SORELY MISS the peace of mind that comes with universal health coverage.���
Those are the words of a 32-year-old woman from Canada, who is currently a PhD student residing in the U.S. When I read them recently in the comment section of a blog, they changed my thinking about health care.
I���ve been involved in health benefits, health insurance and health plans of various types since 1962. I���ve designed employer plans. I was on the boards of four health maintenance organizations. I negotiated physician contracts and health benefits with five unions.
I lobbied Congress for changes during Hillary Clinton���s attempt at health care reform, and keenly observed the Obama-era changes. I was shocked by some of the unrealistic promises made���and the spurious claims opposing���the Affordable Care Act.
Wherever we travel, I embarrass my wife by asking people about their health care. I���ve asked people aboard the ocean liner QE2, on a tour bus in Costa Rica, pretty much anywhere���it doesn���t matter.
I���m aware of the issues and claims regarding cost, rationing, waiting times, freedom of choice and all the rest. I know that no system is perfect. Every system struggles with costs, and some systems can���t deliver care in the timely manner we might expect.
But I also know from my interviews that many people in other countries are satisfied with their health systems. Why? From their perspective, the low or minimal costs they���re charged when they receive care provide them with ���peace of mind.���
My retired friend in the U.K. now pays no premiums or copays for his care. He���s convinced his health care is free. That isn���t accurate. Still, he enjoys peace of mind about his health care costs.
In the U.S., 34% of the population is currently covered by a government-run system. Yet, if I mention universal coverage���even Medicare���there���s instant controversy. It makes you wonder, what do Americans want?
There will never be a perfect system���one that has no out-of-pocket costs, unlimited and immediate access to care, and no taxes paid to support it. But there���s also no logical reason the U.S. can���t have some form of universal coverage with a public-private partnership. Nudged by the Canadian PhD student���s comment, I think it���s time we provided peace of mind to every citizen.
Sometimes, when I discuss the idea of universal coverage with people who are adamantly opposed to changes, I���ve taken to saying, ���Give me your ideas for something better.��� I���m still waiting.
The post Feeling Better appeared first on HumbleDollar.


Triggering IRMAA
At issue is IRMAA, or income-related monthly adjustment amount, which is the premium surcharge for Medicare Part B and Part D if you exceed certain income thresholds. The surcharge is based on your modified adjustment gross income from two years earlier. Like almost all retirees, I���ll begin Medicare at age 65. That means IRMAA will be based on my income for the tax year when I reach age 63, which will be 2022.
I currently have a pension and an income annuity that, taken together, put me below the IRMAA income threshold. But if I do Roth conversions or realize capital gains, I might exceed the IRMAA thresholds and be subject to the surcharge. I���ve been doing Roth conversions for the past six years but will stop those this year.
What about capital gains? For single individuals, long-term capital gains are taxed at 0% if your 2021 taxable income is below $40,000 ($80,000 if married), 15% if your income is $40,001 to $441,450 ($80,001 to $496,600 if married) and 20% if your income is above $441,450 ($496,600 if married).
IRMAA could potentially add to that cost since capital gains are included in calculating your modified adjusted gross income. On top of that, IRMAA is a so-called cliff penalty, meaning that���if you breach an IRMAA income threshold by $1���you have to pay the full surcharge for that income bracket. You can view the IRMAA income thresholds here. The same thresholds apply for both Part B and Part D.
My goal: Figure out whether taking capital gains this year at a 15% rate was better than delaying until 2022, when I could potentially trigger IRMAA. I looked at the first two IRMAA cliffs, which for single individuals start at $88,000 and $111,000 in modified adjusted gross income.
What I found was alarming.
If I realized a capital gain and exceeded the $88,000 threshold by $1,000, my capital gains tax on that $1,000 would be $150, but my total Part B and Part D IRMAA surcharges would be $860.40, for a combined total tax of $1,010.40. In other words, the combined tax rate on that $1,000 would be 101%, the punishing result of the way Medicare���s cliff penalties work.
What if I exceeded the $88,000 threshold by $5,000? My capital gains tax would be $750, but my Part B and Part D IRMAA surcharges would remain at $860.40, for a combined $1,610.40. That���s equal to a 32% tax rate on my $5,000 in capital gains. At $10,000 over the threshold, the tax rate is 23.6% and, at $23,000 over, the tax rate is 18.7%.
For the first two IRMAA brackets, it���s clear that���if I���m going to exceed the IRMAA threshold and trigger the cliff penalty���I might as well make the most of a bad situation and try to bump up close to the next threshold, so I end up paying a lower overall tax rate on my capital gain. Since the second bracket starts at $111,000, I should come as close to that threshold as possible, which would lower the combined IRMAA-plus-capital-gains tax rate to 18.7%. If I was to exceed $111,000, I should get as close as possible to $138,000, which would result in a combined tax rate of 19.8%.
The bottom line: If I wait until next year to realize capital gains at 15%, IRMAA could turn that 15% rate into something closer to 20%���and that assumes I manage my income properly, and don���t accidentally slip into the next IRMAA bracket and trigger the next cliff penalty. Result? I���m taking more capital gains this year, knowing the cost will be just the standard 15% long-term capital gains rate.
 James McGlynn, CFA, RICP, is chief executive of
Next Quarter Century LLC
��in Fort Worth, Texas, a firm focused on helping clients make smarter decisions about long-term-care insurance, Social Security and other retirement planning issues. He was a mutual fund manager for 30 years. James is the author of��
Retirement Planning Tips for Baby Boomers
. Check out his earlier articles.
James McGlynn, CFA, RICP, is chief executive of
Next Quarter Century LLC
��in Fort Worth, Texas, a firm focused on helping clients make smarter decisions about long-term-care insurance, Social Security and other retirement planning issues. He was a mutual fund manager for 30 years. James is the author of��
Retirement Planning Tips for Baby Boomers
. Check out his earlier articles.The post Triggering IRMAA appeared first on HumbleDollar.
October 26, 2021
Stealing Second
Second, late October usually means I���ve moved on to other pursuits���because the sports teams I follow either have a terrible record or have been eliminated from tournament play already.
Except this year. The Atlanta Braves are still alive and competing in the World Series. Which is, in a word, amazing.
I haven���t tuned in to watch much baseball over the past several years. I was reserving my mental bandwidth for things that brought me happiness. Or, at the very least, weren���t depressing. But now that baseball has once again captured my attention, I was surprised to hear an announcer explain why players don���t steal bases as often as they once did.
Apparently, defensive players have become so skilled against the steal that basic math now defines the outcome. Quick pitchers will have a consistent time of just 1.1 to 1.29 seconds to home plate.��The average catcher can throw to second base in just two seconds. Add these together, and it means a base stealer has only 3.1 to 3.29 seconds to reach second safely.��Not much time.
Because of the recordkeeping now common in baseball, managers know right away whether their baserunner is fast enough to steal second successfully. Once a player reaches first base, it���s a foregone conclusion whether he���ll steal second.
The parallels with saving for retirement are striking. The statistics on retirement are also formidable. It���s easy to predict how much the average investor needs to save���and when she can retire successfully���using Monte Carlo��simulations.
But unlike today���s base stealing, the odds of success are harder to figure out, thanks to the average investor���s saving and investing (mis)behavior. Some investors play the equivalent of mistake-free modern baseball. But most are still mired in the game of chance that I grew up watching a few decades ago.
The post Stealing Second appeared first on HumbleDollar.
Who’s Counting?
INVESTORS SHOULD diligently track two things: their portfolio’s performance and their asset allocation.
To monitor overall performance is humbling. If you’re like me, you eventually realize how much your cockamamie market-beating schemes have lagged the market—and it dawns on you that you could do much better by simply mimicking the market with index funds and occasionally rebalancing.
What percentage of your portfolio should be in U.S. shares, foreign stocks, cash, bonds and other assets? Only you can answer that. Question is, do you know where your assets are right now? Does that mix fit with your preferences and risk tolerance? How has it affected your performance?
I monitor my year-to-date performance and asset allocation in one place: an Excel spreadsheet that’s also a kind of investment journal. In it, I have running notes about moves I’ve made and those I’m considering. While I do use some tools offered by Yahoo Finance and Morningstar, I haven’t found any online portfolio trackers totally to my liking.
My spreadsheet is customizable to my precise and ever-evolving preferences, even if I do have to manually enter some data. The accompanying example is just a simplified illustration. My real spreadsheet has a lot more rows and columns. For instance, with the help of Morningstar data, I monitor how much I have invested in China, which I want to strictly limit.
 I use the Fidelity Freedom Index 2035 Fund (symbol: FIHFX) as my benchmark. Its stock-bond mix is similar to what I’ve chosen for myself at this point in my life, but my portfolio has unique aspects that are important to me, such as the limit on China. My return was a little behind the Fidelity fund last year and I’m a little ahead this year.
One reason my returns have improved: About 40% of my actual portfolio is in the fund I’ve chosen as my benchmark. Another big chunk is in total U.S. and world index funds. Funny how that works: If you can’t beat ’em, join ’em. I now have a limit on how much I can invest in things that aren’t broad-market index funds.
The sample spreadsheet only tracks performance, total value and allocation to bonds, U.S. shares and foreign stocks. Pared down as it is, it would still be a perfectly useful guide for rebalancing when, say, the bull market pushes my stock-market weighting much beyond my target.
At the beginning of the year, by which time I’ve probably rebalanced my portfolio, I enter in the value of each investment as of Dec. 31 in Column H, which is where I list my cost basis for the year. I let the spreadsheet auto sum the values. I also manually type in the result just below the auto sum. That helps me check my math as the year goes on and the cost basis changes.
I update Column B every month—or whenever I feel like it—with the values shown online for my brokerage accounts. No need to track shares or reinvested dividends. The current value reflects all that.
Meanwhile, I turn to Morningstar to get the data for what portion of my funds is in each asset class. For instance, Fidelity 2035 was recently 31% in foreign stocks, so I create the appropriate calculation in the relevant cell, as shown in the sample table.
Of course, tracking trades and new contributions adds a wrinkle to all this. It isn’t all that difficult, but I won’t bore you with the details. As you can see at the bottom of Column H, I make a note of the last investment contribution I've made.
My spreadsheet probably wouldn’t pass muster with a trained financial analyst, but it works for me. Could it work for you?
 William Ehart is a journalist in the Washington, D.C., area. In his spare time, he enjoys writing for beginning and intermediate investors on why they should invest and how simple it can be, despite all the financial noise. Follow Bill on Twitter @BillEhart and check out his earlier articles.
The post Who’s Counting? appeared first on HumbleDollar.
Who���s Counting?
INVESTORS SHOULD diligently track two things: their portfolio���s performance and their asset allocation.
To monitor overall performance is humbling. If you���re like me, you eventually realize how much your cockamamie market-beating schemes have lagged the market���and it dawns on you that you could do much better by simply mimicking the market with index funds and occasionally rebalancing.
What percentage of your portfolio should be in U.S. shares, foreign stocks, cash, bonds and other assets? Only you can answer that. Question is, do you know where your assets are right now? Does that mix fit with your preferences and risk tolerance? How has it affected your performance?
I monitor my year-to-date performance and asset allocation in one place: an Excel spreadsheet that���s also a kind of investment journal. In it, I have running notes about moves I���ve made and those I���m considering. While I do use some tools offered by Yahoo Finance and Morningstar, I haven���t found any online portfolio trackers totally to my liking.
My spreadsheet is customizable to my precise and ever-evolving preferences, even if I do have to manually enter some data. The accompanying example is just a simplified illustration. My real spreadsheet has a lot more rows and columns. For instance, with the help of Morningstar data, I monitor how much I have invested in China, which I want to strictly limit.
I use the Fidelity Freedom Index 2035 Fund (symbol: FIHFX) as my benchmark. Its stock-bond mix is similar to what I���ve chosen for myself at this point in my life, but my portfolio has unique aspects that are important to me, such as the limit on China. My return was a little behind the Fidelity fund last year and I���m a little ahead this year.
One reason my returns have improved: About 40% of my actual portfolio is in the fund I���ve chosen as my benchmark. Another big chunk is in total U.S. and world index funds. Funny how that works: If you can���t beat ���em, join ���em. I now have a limit on how much I can invest in things that aren���t broad-market index funds.
The sample spreadsheet only tracks performance, total value and allocation to bonds, U.S. shares and foreign stocks. Pared down as it is, it would still be a perfectly useful guide for rebalancing when, say, the bull market pushes my stock-market weighting much beyond my target.
At the beginning of the year, by which time I���ve probably rebalanced my portfolio, I enter in the value of each investment as of Dec. 31 in Column H, which is where I list my cost basis for the year. I let the spreadsheet auto sum the values. I also manually type in the result just below the auto sum. That helps me check my math as the year goes on and the cost basis changes.
I update Column B every month���or whenever I feel like it���with the values shown online for my brokerage accounts. No need to track shares or reinvested dividends. The current value reflects all that.
Meanwhile, I turn to Morningstar to get the data for what portion of my funds is in each asset class. For instance, Fidelity 2035 was recently 31% in foreign stocks, so I create the appropriate calculation in the relevant cell, as shown in the sample table.
Of course, tracking trades and new contributions adds a wrinkle to all this. It isn���t all that difficult, but I won���t bore you with the details. As you can see at the bottom of Column H, I make a note of the last investment contribution I've made.
My spreadsheet probably wouldn���t pass muster with a trained financial analyst, but it works for me. Could it work for you?
William Ehart is a journalist in the Washington, D.C., area. In his spare time, he enjoys writing for beginning and intermediate investors on why they should invest and how simple it can be, despite all the financial noise. Follow Bill on Twitter @BillEhart��and check out his earlier articles.
The post Who���s Counting? appeared first on HumbleDollar.
October 25, 2021
No Complaints
Here���s how much I���m paying in 2021 for each of my health care plans:
Traditional Medicare: $148.50 per month or $1,782 total
Prescription drug plan: $29.20 per month or $350 total
Medigap policy: $213.68 per month or $2,564 total
I know some people are critical of federal-run programs. But I have no complaints about traditional Medicare. I���ve received great coverage and timely service, and I sure needed those this year. For instance, I had a couple of health care issues that required multiple tests, including a CT scan and ultrasound, plus I had physical therapy. All these were performed in a timely manner and without any administrative hiccups.
When I think about it, I also have nothing but good things to say about the Social Security Administration. My checks are always deposited in my checking account on time.
Now, if I could get the same reliable service from my cable television provider, maybe I wouldn���t have to spend so much time on the phone dealing with service and billing issues.
That said, I do have two things on my retirement benefits��� wish list. First, I wish Congress would drop all the political posturing and continue to fund the federal government responsibly, so I can keep getting the same great uninterrupted service from Social Security and Medicare.
Second, I wish Congress would pass a bill that provides Medicare coverage for hearing, vision and dental. I could never figure out why a retiree's ears, eyes and teeth aren���t covered under traditional Medicare. Are our heads not attached to our bodies?
The post No Complaints appeared first on HumbleDollar.
Simply Works
The same strategy can help beginner investors. Novices often find the stock market intimidating and mysterious. Result? Inaction and opportunity cost. Solution? Simple steps.
A former coworker comes to my mind. He was uninterested in stocks, including the company shares he received as part of his pay. He sold the shares immediately���often the smart thing to do���but he didn���t know what to do with the cash.
For people like him, a simple solution is a fund like Vanguard Total World Stock ETF (symbol: VT). No need to research individual stocks. All my friend had to do was sell his company shares as he received them and then buy this fund. Over time, his interest in investing grew, and he���s no longer ignorant about the stock market.
Another example: A friend���s daughter needed help with investing. She learned fast and decided to invest equal amounts in four commission-free index funds. She adopted a shortcut for rebalancing. Whenever she had money to invest, she���d buy the fund with the lowest balance. Was this the best strategy? Maybe not. But it works for her.
My last example: A recent acquaintance had a large sum sitting in her bank account for years. She was too afraid to invest and too embarrassed to ask. After we chatted a few times, she realized that���while she was avoiding risk���she was also avoiding return. She decided to start investing in small installments, but invest less if stock prices were high.
To keep things simple, she transfers just enough from her bank each month so her investment account reaches a fixed dollar target. If she started with $1,000 in the first month, she���d top up her account���s value to $2,000 in the second month, $3,000 in the third and so on. This way, she buys less when share prices are up. It���s a simple strategy that she���s happy with���and it offers the somewhat contrarian approach offered by value averaging, a version of dollar-cost averaging.
The post Simply Works appeared first on HumbleDollar.
Recession Watch
According to economists Paul Samuelson and William Nordhaus, a recession is defined as ���a period of significant decline in total output, income, and employment, usually lasting from six months to a year and marked by widespread contractions in many sectors of the economy.���
The job of calling a recession belongs to the National Bureau of Economic Research. While there are no strict criteria for dating a recession, a common working definition is two consecutive quarters of negative GDP growth. The most recent recession lasted from February to April 2020���the so-called COVID-19 recession.
The first two quarters of 2021 saw real GDP growth of 6.3% and 6.7%, respectively. This is undoubtedly robust. But it���s important to remember that the COVID-19 recession was one of the most severe���and shortest���in modern history, with GDP declining 19.2% from peak to trough. The rebound in GDP in the first half of 2021 was off a fairly low base.
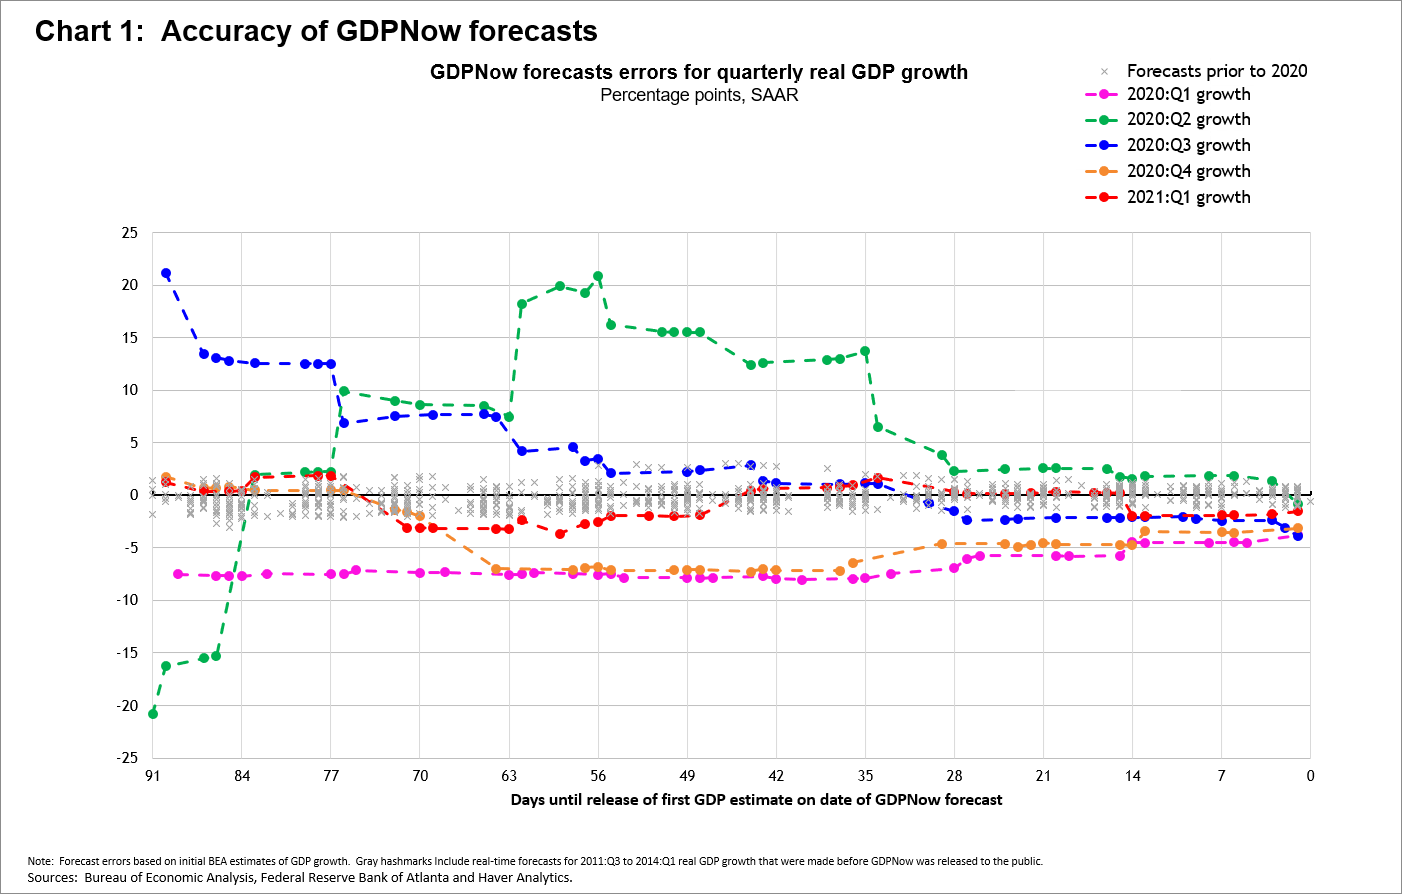
What���s in the cards for the third quarter? According to the Atlanta Federal Reserve���s GDPNow forecasting tool, the latest estimate of third-quarter GDP growth is an anemic 0.5%. This is an annualized estimate. How accurate is GDPNow? As shown in this chart, it depends on the proximity to the release date of GDP. Within four weeks of the release date, it does a pretty good job.
Of course, there's far greater uncertainty in economic forecasts since the onset of the global pandemic. Still, 0.5% GDP growth is not that far from zero���and third-quarter GDP could surprise to the downside.
What about other recession indicators? Previously, I���ve written about the power of the yield curve in predicting recessions. It���s traditionally been one of the most robust tools in forecasting recessions.
The yield curve is currently upward��sloping, meaning Treasurys with longer maturities have higher yields than those with shorter maturities. But I���m not so sure we can put quite as much faith in the yield curve as a recessionary predictor in an environment of near-zero interest rates. I would also argue that massive quantitative easing has distorted the yield curve in significant ways, perhaps making it a less useful indicator than it has been historically. Finally, the prospect of inflation may be causing long-term Treasury yields to be higher than they would otherwise be.
Personal consumption is the largest component of GDP and has recently surged to 69%, a multi-decade high. How are consumers feeling these days? According to the Conference Board, consumer confidence has fallen for three straight months, down 15% from the recent peak in June.
The Conference Board���s survey also looks at consumers��� appraisal of both their present situation and expectations six months out, both of which have been worsening. The deterioration of the latter is especially worrisome for consumer spending in the months to come.
I���m certainly not forecasting a recession, at least not with any degree of confidence. As the saying goes, economists have predicted 10 of the past five recessions. But what I am pointing out is that the odds of a recession are rising and are not insignificant. At a minimum, investors need to be mentally prepared for a rough stretch in the economy and the financial markets. If inflation doesn���t recede meaningfully, this raises the unpleasant specter of stagflation���stagnant economic growth plus inflation.
Should we enter a period of stagflation, where can investors hide? Bonds, especially long duration bonds, would likely suffer. Bond prices would be driven lower by higher market interest rates, while the value of the fixed payments from bonds would be diminished by inflation. Stocks of companies without pricing power would also face headwinds. Ditto for growth stocks with lofty price-earnings multiples, which tend to struggle when interest rates rise and cause investors to put a lower value on future earnings. In addition, cash would be unattractive because its purchasing power would be eroded by inflation.
Series I savings bonds, which I wrote about recently, would provide inflation protection and may serve as a good cash alternative. Value stocks may catch a break as investors flee from frothier growth names. Commodities and natural resource companies might benefit from a scenario of higher energy prices. Finally, if history is any guide, gold could be a major beneficiary of a stagflationary environment.
 John Lim is a physician and author of "How to Raise Your Child's Financial IQ," which is available as both a free PDF and a Kindle edition.��Follow John on Twitter @JohnTLim��and check out his earlier articles.
The post Recession Watch appeared first on HumbleDollar.
October 24, 2021
Managing to Profit
My two cents: Never forget that the managed-care companies offering Advantage plans are mostly for-profit companies that are publicly traded. The government���s purpose is to transfer its insurance risk to those companies. These managed-care companies must then manage that risk through rationing, limiting choice and negotiating provider payments, as well as encouraging healthy behavior among their customers. To the extent they���re allowed, they deny coverage or charge higher rates to those with preexisting conditions.
Although Medicare Advantage was first offered in the late 1990s, enrollment really took off about 10 years ago. That was when Congress made the program more palatable to insurance companies. Advantage plans became their growth driver and industry marketing got more aggressive. Enrollment has doubled over the past decade.
I looked at the major national managed-care companies in the Medicare Advantage market over that time period. Here are their stock returns for the past 10 years, without dividends reinvested, as of Oct. 18:
Aetna (AET) +499%
Anthem (ANTM) +537%
Humana (HUM) +514%
UnitedHealth Group (UNH) +873%
S&P 500 (SPX) +271%
Over the long haul, the stock market recognizes value.��Don���t imagine that managed-care companies are charitable ventures. This factors into how they ���manage��� your care. Rather than choosing one of their Advantage plans, your best bet might be to become a stockholder. That way, you can smile at your brokerage statement because you���ll be betting with the house.
I spent years in hospital administration sitting across the table from insurance companies. When it came time to decide, I opted for traditional Medicare plus a Medigap policy. It may cost more. But choice is a valuable commodity���and you see its true value at the most critical times in your life.
The post Managing to Profit appeared first on HumbleDollar.
More of the Same
International funds��� relative weakness has become so routine that it rarely makes the financial news. What���s different this time: The economic landscape would seem to favor foreign shares, particularly emerging markets.
Go back one year. Stock markets around the world were in a garden-variety correction���dropping about 10% from their third-quarter peak���with technology companies feeling the brunt of the selling. Small caps and value sectors were holding up a little better.
Then the buying frenzy began anew, and we got the second wave of the COVID-19 bull market that began in March 2020. As 2021 dawned, foreign markets were outperforming, propelled in part by a weakening dollar. But the dollar reversed course and U.S. stocks soon nosed ahead���and that���s where they���ve stayed.
Now consider today���s economic backdrop: inflation fears, climbing commodity prices and rising interest rates. In the mid-2000s, when these factors converged, they proved bullish for foreign firms, especially those in emerging markets. In 2003, 2005 and 2007, emerging market indexes led the bull market charge. That isn���t happening this year. While commodities are on fire in 2021, shares of foreign companies just can���t find their footing���at least relative to the S&P 500.
If you���re like me, you own a globally diversified basket of low-cost index funds, which means just a portion of your portfolio is invested in large-cap U.S. stocks. It can feel like you���re missing out, even if your overall portfolio is up handsomely in 2021.
It���s even tougher for older investors who have a high allocation to bonds. Vanguard Total Bond Market ETF (BND) is down 2.1% in 2021, rivaling its 2013 loss, which was the worst year since the fund began trading in 2007. And that���s with dividends reinvested. Seeing inflation eat away at returns only adds to the unpleasantness.
Bottom line: Financial markets are having a party���but many investors aren���t having a great time.
The post More of the Same appeared first on HumbleDollar.


