
Karen Lynn Allen's Blog, page 7
February 18, 2013
One Family's Energy Evolution--How We Dropped our Utility Bills by 80%
 Top red line is average cost/month for years '99-'03. Black line is average cost for years '04-'08. Bars at bottom are for individual years '09 - '13
In the year 2000, our family spent $2615 on our utility bill. For a family of five in a 2800 sq. ft. house we used on average 33.4 kilowatt hours (kwh) per day of electricity and 4.28 therms/day of natural gas. Our electricity consumption was almost twice that of the average household in our utility region (an area that includes most of California north of Los Angeles), though very close to the national household average. And our natural gas consumption was almost four times (!) that of the average household in our region. It was expensive! It was nuts.
We live in San Francisco where it never gets very hot or very cold. However, our house was built in 1935 with pretty much zero insulation. In 2000 most of the windows were original and single-paned and only a few walls had been insulated. We didn’t have air conditioning or electric heat, so no big electrical draws there, but when the wind blew and the fog rolled in, you could’ve flown a kite in the breeze down our hallway.
Looking back, I only hazily remember what we did to deal with that initial monster energy use. We put in a lot of fluorescent bulbs, got rid of an electric space heater, nagged the kids to turn off lights and stopped leaving outdoor lights on all night. That was also the year we got our first front-load washing machine and a new, more efficient refrigerator, both necessary replacements of dying ones. The next year our electricity use dropped nearly in half! Our natural gas use, however, was just about the same, and unfortunately that was the winter natural gas prices went through the roof in California.
 Yellow lines are solar production. Bars are what we bought. Negative numbers mean we sold more than we bought that month.
 Solar clothes dryerThe next year I paid more attention to our programmable thermostats, experimented with the house temperature dropping a few degrees at night, and began hanging my laundry outside to dry. That resulted in a 10% drop in therms. At the beginning of the following year, we had a big remodeling project that involved, among other things, replacing fourteen single-pane windows with double-pane ones and insulating the walls of about a third of our house. Our natural gas use dropped 25% the following year! In 2004, both electricity and natural gas consumption crept back up, as energy use is wont to do. We added more insulation to the attic (there was a minimal amount already), and, for the next four years, our natural gas ran about 2.5 therms a day and electricity around 21 kwh/day. Things had definitely improved. But energy prices had also crept up. Even though we were using a third less electricity and 40% less natural gas than in 2000, we were spending $2000 per year on energy.
  Red line=avg '99-'03. Black=avg '04-'08. Bars='09 - present (Side note: another huge benefit of adding wall insulation and replacing single-pane windows with double-pane ones is that it makes the interior of the house much quieter, a big plus in a city with street noise.)
 Solar panels east Then I started reading about climate and energy issues. That was the point we began to tackle energy efficiency and renewable energy in earnest. In 2009 we installed solar panels on our roof. Our roof breaks east-west and is partly shaded in the winter by a taller building directly south, so seven panels ended up facing east and eight faced west on the sunniest half of the roof. Not optimal, but so it goes. To deal with vampire loads, I went around like a maniac unplugging every unnecessary gadget and wall wart I could from wall sockets in every room of our house. (It’s amazing what gets plugged in and stays there, drawing power year after year for no benefit whatsoever!) I plugged our media equipment into a power strip and turned it off at night. I put in ultra low flow showerheads (1.5 gallons per minute). I bugged my kids about taking shorter showers and using towels at least twice before putting them in the wash. My oldest went off to college, so there was some less energy use, but I still had two active teens at home gobbling energy with showers, piles of laundry and electronic media gadgets.
 Solar panels westI turned down the heat. Boy did I get howls about that. I would point out to my kids that since they didn’t live Hawaii, they should expect to wear slippers and sweaters in the winter. This was not popular. I pointed out I wore wool and was willing to have the house even colder while home alone during the day. (Though I do admit it’s hard to sit still for any length of time in a house colder than 59 degrees.) Eventually we reached a compromise that 64 degrees was a reasonable ambient temperature when they were home.
 We had an energy audit by an energy efficiency company. Out of this we decided to have insulation blown into our uninsulated walls (over half the house), we had the attic sealed and more attic insulation installed, and we had the downstairs heating system optimized and its ductwork sealed. Later that year we also had six very leaky single-pane windows in my daughters’ bedrooms replaced. It was after this that I got brave enough to turn our inefficient upstairs heating system off entirely. (Luckily the laws of physics proved correct and heat really does rise.)
The combination of all these actions dropped our electricity usage by one fifth, down to 14.4 kwh/day. On average we produced 11.7 kwh/day from our panels and bought 2.7 kwh/day from our utility. (In the summer we produce more electricity than we use and sell some back to our utility. In the winter we use more than we produce and so buy.) The insulation, heating system optimization, new windows, and cooler house temperatures made a dramatic impact on our natural gas use, which dropped by 40% to 1.7 therms per day. And yet there was more to do.
 Solar hot water panelsThe following year we installed a solar hot water system that dropped our natural gas another half therm/day. It went on the east-facing side of our roof, which is fine since most of our hot water use (showers, dishwasher, laundry) is in the morning. (Morning is also when electrical rates are cheaper.) Because the back up warming element of the solar hot water system is electric, it did bump up our electrical use an average of 2 kwh/day.
 On demand hot waterThe year after that, when remodeling our decrepit downstairs bathroom, we installed an on-demand hot water system to replace our downstairs hot water heater, decreasing both water and natural gas use. We are down, now, to an average of less than one therm of natural gas per day, but it does vary depending on how cold our winter temperatures are. For both electricity and natural gas we rarely use amounts above our baseline quantity, which keeps the energy we do buy at the lowest rate.
As we progressed along on our energy journey, we made a few step-level technology changes but, more importantly, we also made many, many little changes that added up in a big way. This is why I call it an evolution. It took time, experimentation, and a failure here and there to achieve our results, plus a willingness to change habits.
 Solar hot water gutsOver the years energy prices have increased, more steeply-tiered electricity rates have been introduced, and the baseline quantity for both electricity and natural gas has shrunk. (The number of kilowatt-hours or therms included in the baseline rate—a number that both rate structures hinge on—varies in California per geographical area. Curiously, this baseline definition has shrunk more in San Francisco than in other parts of our utility provider’s district. It ends up being a mostly invisible, though I have to admit clever, form of rate hike.)
 The result is that energy, especially electricity in San Francisco, is quite a bit more expensive than it was in 2000. I calculate that if in 2012 we’d used the same amount of electricity as back in 2000, we would’ve paid $2402. (Back in 2000 we paid $1350 for this energy.) And if we’d used an equivalent amount of natural gas, we would’ve paid $1680 at today’s rates. Put the two together, we would’ve paid $4082 for energy last year. That means we’ve dropped our energy bills from what we would’ve paid by $3581 a year, or 87%!
What we’ve invested (after tax credits and incentives): solar PV $12,000; solar hot water $5600; wall insulation, more attic insulation, house sealing, HVAC duct sealing and optimization $8000; repairing decorative paint on walls after insulation blown in $800; on demand hot water $1200; new windows not part of remodel $6000; various light bulbs, low flow showerheads and power strips $400. Total $34,000. (Am not counting appliances or windows we had to replace anyway or insulation mandated by building code during various remodels.) I figure we’ve already recovered $15,000 of our investment in savings. If energy prices increase by only two percent per year, we’ll recover the rest in six years. If energy prices increase by three percent per year, we’ll recover it in five.
 Also in 2008 we got rid of our minivan, leaving us just our 2004 Prius. Our annual gasoline purchases dropped from $2300 per year down to $1250. The average price for a gallon of gasoline in 2008 in the US was $3.16; in 2012 it was $3.63. That means we bought 728 gallons of gas in 2008 and 344 gallons in 2012. If we’d used as much gasoline in 2012 as in 2008, we would’ve spent roughly an additional $1400.
 Of course the expense of owning a car is only partly the gasoline. All the other costs to operate it come to far more. Though our van was totally paid for by the time we offed it, if we’d kept it we would’ve spent an additional $500 on car insurance, $3000 on repair and maintenance (van was getting old and falling apart), $170 on car registration, $150 on tires, $200 on parking, tolls and the rare carwash. This comes to $5420/year in car expenses avoided.
 Electric-assist grocery getter. Carries 5 bags uphill, no sweat!Without the extra car we did spend about $220/year on City Carshare (car rental by the hour), and about $1200 on family transit. However, at least two-thirds of that transit cost would’ve happened even with a second car as I wouldn’t have wanted to drive my kids around much more than I ended up doing anyhow. Although my husband and I mostly travel around town by regular bicycle, because we live up a ginormous hill, we also spent $800/year to buy and maintain two electric bikes. (Initial cost + maintenance + 1 battery replacement for each bike at year 3, with this total amortized over six years.) And we now spend $360/year for a storage locker on the island where we go on vacation every summer to hold stuff we formerly hauled there annually in our van. So net, our yearly savings are $3640. On top of this, by our teens not getting driver’s licenses between the ages of 16 and 21, we’ve saved on average $2000 per kid per year, which adds up to $20,000 so far and counting. (Thanks, kids! The money went to your college tuition.) And also, no kids driving meant no kids crashing, which meant no shelling out-of-pocket to pay the deductible on insurance claims, no increases in car insurance rates due to accidents, etc.
What we learned on our energy evolution: cutting energy use in half the first time is pretty easy, especially if your use is high to begin with. The things that have the biggest bang for the buck are actually quite cheap—replacing incandescent bulbs with fluorescents (although at this point I would replace with LEDs,) attic insulation, unplugging useless stuff, unplugging second refrigerators, putting in power strips to deal with vampire load, and whenever you replace an appliance spending a few percent more to get the most energy-efficient one possible. And anytime you remodel, take advantage of open walls to insulate like crazy and put in the most efficient fixtures you can. (You will thank yourself later.) Cutting energy use in half the second time requires more investment, but if you take your savings from the first energy drop, you’ll have some money to play with. Cutting use in half the third time takes even more money per therm or kilowatt saved and has less monetary return unless you expect energy costs to keep rising (which I do.)
But we are not done! Future goals are to install a ductless heat pump, deal with our drafty fireplace with some kind of insert, eventually replace all of our leaky single-pane windows, and, if we ever get our house tight enough, install a heat-exchange ventilator. With middle child now in college, we expect our vehicles miles travelled (VMT) to drop another 20 percent this year. Perhaps once we finish paying for college for all three kids (Done with one! Two left to go!) we’ll consider an electric car, but like everyone else I’m concerned about range issue for long trips. In addition, even minimal use of an electric car would raise our electricity consumption by at least a third, so we’d need to install more solar panels on our roof. If there were a medium-speed train that took less than ten hours to get from San Francisco to Seattle (heck, that’s only 80 mph—European trains do double that), I think we’d go car-free altogether and just rent a car when we needed to.


February 6, 2013
The End of the Age of Oil Has Arrived
<!-- /* Font Definitions */ @font-face {font-family:"MS 明朝"; panose-1:0 0 0 0 0 0 0 0 0 0; mso-font-charset:128; mso-generic-font-family:roman; mso-font-format:other; mso-font-pitch:fixed; mso-font-signature:1 134676480 16 0 131072 0;} @font-face {font-family:"MS 明朝"; panose-1:0 0 0 0 0 0 0 0 0 0; mso-font-charset:128; mso-generic-font-family:roman; mso-font-format:other; mso-font-pitch:fixed; mso-font-signature:1 134676480 16 0 131072 0;} @font-face {font-family:Cambria; panose-1:2 4 5 3 5 4 6 3 2 4; mso-font-charset:0; mso-generic-font-family:auto; mso-font-pitch:variable; mso-font-signature:3 0 0 0 1 0;} /* Style Definitions */ p.MsoNormal, li.MsoNormal, div.MsoNormal {mso-style-unhide:no; mso-style-qformat:yes; mso-style-parent:""; margin:0in; margin-bottom:.0001pt; mso-pagination:widow-orphan; font-size:12.0pt; font-family:Cambria; mso-ascii-font-family:Cambria; mso-ascii-theme-font:minor-latin; mso-fareast-font-family:"MS 明朝"; mso-fareast-theme-font:minor-fareast; mso-hansi-font-family:Cambria; mso-hansi-theme-font:minor-latin; mso-bidi-font-family:"Times New Roman"; mso-bidi-theme-font:minor-bidi;} .MsoChpDefault {mso-style-type:export-only; mso-default-props:yes; font-family:Cambria; mso-ascii-font-family:Cambria; mso-ascii-theme-font:minor-latin; mso-fareast-font-family:"MS 明朝"; mso-fareast-theme-font:minor-fareast; mso-hansi-font-family:Cambria; mso-hansi-theme-font:minor-latin; mso-bidi-font-family:"Times New Roman"; mso-bidi-theme-font:minor-bidi;} @page WordSection1 {size:8.5in 11.0in; margin:1.0in 1.25in 1.0in 1.25in; mso-header-margin:.5in; mso-footer-margin:.5in; mso-paper-source:0;} div.WordSection1 {page:WordSection1;} </style>--> <br /><table cellpadding="0" cellspacing="0" class="tr-caption-container" style="float: left; margin-right: 1em; text-align: left;"><tbody><tr><td style="text-align: center;"><a href="http://3.bp.blogspot.com/-KMtkEjIGLmg..." imageanchor="1" style="clear: left; margin-bottom: 1em; margin-left: auto; margin-right: auto;"><img border="0" height="320" src="http://3.bp.blogspot.com/-KMtkEjIGLmg..." width="212" /></a></td></tr><tr><td class="tr-caption" style="text-align: center;">Sunset or Sunrise?</td></tr></tbody></table><div class="MsoNormal" style="text-align: justify;">Perhaps rather than the end of the age of oil, we should say this is the century of reinventing our relationship with energy. How we create it, how we consume it. How we squander it, how we husband it. Whether we have enough or whether we have shortages. And what harm it does (now and in the future) as it is created and consumed.<span style="mso-spacerun: yes;"> </span></div><div class="MsoNormal"><br /></div><div class="MsoNormal" style="text-align: justify;">For most of the last sixty years, energy was like garbage, something most Americans paid little attention to. For a small monthly sum waste magically disappeared, energy magically appeared, and we didn’t have to worry our heads about either. With a supply of energy seemingly infinite and a price close to free, all but the poorest could use as much as they wanted, entirely unconscious of how it underpinned modern life. </div><div class="MsoNormal"><br /></div><div class="MsoNormal" style="text-align: justify;">The end of this feast is close upon us. Our relationship with energy is destined to profoundly change, and not in someone else’s lifetime. In ours. Soon. </div><div class="MsoNormal"><br /></div><div class="MsoNormal" style="text-align: justify;">But this can’t be! Almost every day we hear of new sources of oil and how the US will shortly be the new Saudi Arabia. And if not us, then the Canadians, who are our good buddies, especially when we want something from them. We will have all the energy we could ever want. Forever.</div><div class="MsoNormal"><br /></div><div class="MsoNormal" style="text-align: justify;">The all-the-energy-we’ll-ever-need version of the future looks something like this, a recent forecast by the International Energy Agency (IEA):</div><div class="MsoNormal" style="text-align: justify;"><br /></div><div class="MsoNormal" style="text-align: justify;"><a href="http://2.bp.blogspot.com/-OWsRH_UgzRI..." imageanchor="1" style="margin-left: 1em; margin-right: 1em;"><img border="0" height="187" src="http://2.bp.blogspot.com/-OWsRH_UgzRI..." width="400" /></a> </div><div class="MsoNormal" style="text-align: justify;">Hey, the world supply of oil is ever increasing and by 2035 will reach 100 million barrels a day! No need for concern. </div><div class="MsoNormal"><br /></div><div class="MsoNormal" style="text-align: justify;">This forecast, however, only faintly resembles the reality actually approaching. To examine unvarnished reality we must untint our rose-colored glasses with the following five steps. </div><div class="MsoNormal"><br /></div><div class="MsoNormal" style="text-align: justify;"><b style="mso-bidi-font-weight: normal;">First step.</b> Let’s turn that bar graph into a continuous line graph, courtesy of Antonio Turiel, a scientist at the Institut de Ciencies del Mar del CSIC in Barcelona, who created all the following graphs and published them in a post <a href="http://crashoil.blogspot.it/2012/11/e..." target="_blank">here</a>, in Spanish. A translation of his excellent original article can be found <a href="http://cassandralegacy.blogspot.com/2..." target="_blank">here</a>. (The blog post you are reading is largely a reinterpretation of his points for those who may not be familiar with the concepts and vocabulary that energy specialists are wont to use.)</div><div class="MsoNormal" style="text-align: justify;"><br /></div><div class="separator" style="clear: both; text-align: center;"><a href="http://4.bp.blogspot.com/-xEZuE6mMVVg..." imageanchor="1" style="clear: left; float: left; margin-bottom: 1em; margin-right: 1em;"><img border="0" height="280" src="http://4.bp.blogspot.com/-xEZuE6mMVVg..." width="400" /></a></div><div class="MsoNormal" style="text-align: justify;">So let’s look at what we have. The black wedge at the bottom shows world <span style="background: gray; mso-highlight: gray;">crude oil currently in production</span> (real data through 2011.) The light blue shows production that will come from <span style="background: aqua; mso-highlight: aqua;">crude oil reservoirs known about but not in production</span>. The medium blue is crude oil from <span style="background: blue; mso-highlight: blue;">reservoirs yet to be discovered</span>. The magenta represents <span style="background: fuchsia; mso-highlight: fuchsia;">natural gas liquids</span>. The yellow represents <span style="background: yellow; mso-highlight: yellow;">all non-conventional oil except shale oil</span>, and the red represents <span style="background: red; mso-highlight: red;">shale oil</span>. The green represents <span style="background: lime; mso-highlight: lime;">refining processing gains</span>. So there you have it. Up, up and away. We'll all be zipping around in flying cars before you can say, “Frack, baby, frack.”</div><div class="MsoNormal"><br /></div><div class="MsoNormal" style="text-align: justify;"><b style="mso-bidi-font-weight: normal;">Step two.</b> Now we must consider that what’s important about an energy source is not how much space it fills (such as a barrel) but how much energy it possesses per volume. And it turns out that not all “oil” is equal in this regard. All non-conventional oils have lower energy per volume than crude oil—roughly 70%. (Corn-based ethanol has only 66% of the energy of oil. This is why your car gets worse gas mileage when you fill the tank with ethanol-blended gasoline.) So a barrel of non-conventional oil should count for 70% of a barrel of crude, not a full barrel as the IEA counts it. Step two takes care of this.</div><div class="MsoNormal"><br /></div><div class="MsoNormal" style="text-align: justify;"><b style="mso-bidi-font-weight: normal;">Step three</b>. Refinery gains are not energy gains and should not be double counted as additional energy. It takes as much energy in the refinery process (these days usually provided by natural gas) to create the additional volume of oil you get from these so-called gains. So what the IEA counts as a gain is just translating one form of energy for another (and losing some in the process) rather than creating additional energy. </div><div class="MsoNormal"><br /></div><div class="MsoNormal" style="text-align: justify;">After adjusting our rosy glasses with steps two and three, our view of oil reality now looks like this:</div><div class="MsoNormal" style="text-align: justify;"><br /></div><table align="center" cellpadding="0" cellspacing="0" class="tr-caption-container" style="margin-left: auto; margin-right: auto; text-align: center;"><tbody><tr><td style="text-align: center;"><a href="http://4.bp.blogspot.com/-AvIWZnHRu7A..." imageanchor="1" style="margin-left: auto; margin-right: auto;"><img border="0" height="280" src="http://4.bp.blogspot.com/-AvIWZnHRu7A..." width="400" /></a></td></tr><tr><td class="tr-caption" style="text-align: center;"><span style="font-family: Cambria;">Taking into account energy content and refinery gains</span></td></tr></tbody></table><div class="MsoNormal" style="text-align: justify;"><br /></div><div class="MsoNormal" style="text-align: justify;">A little less exuberant, though seemingly no cause for concern. After all, the overall trend is still up. Notice, however, that the IEA claims that in 2011 the world produced 86.2 million barrels of “oil” per day (mb/d). But when we apply steps two and three and translate this production into the energy equivalent of a true barrel of oil, we end up with only 79.5 mb/d. (This is part of the reason why oil prices are still high even though we constantly hear about oil production going up.) In addition, after applying steps two and three, the forecast for 2035 drops from 100 mb/d to 87.5 mb/d. This is starting to look a little tight, but, hey, no worries. Someone will think of something, and nothing much will change. Except we still have steps four and five ahead.</div><div class="MsoNormal"><br /></div><div class="MsoNormal" style="text-align: justify;"><b style="mso-bidi-font-weight: normal;">Step four.</b> We have to consider Energy Returned on Energy Invested (EROEI).<span style="mso-spacerun: yes;"> </span>This isn’t a difficult concept to understand, but it is quite different from how we thought about energy for pretty much the entire twentieth century.</div><div class="MsoNormal"><br /></div><div class="MsoNormal" style="text-align: justify;">It takes energy to make or capture energy in a form we can use. Back when you could practically stick a straw in the ground in Texas and get oil to spout out, we could produce 100 barrels of oil energy for just one barrel expended. What a deal! Over time, the easy oil was all sucked out. Over time, that left the more difficult oil to extract. Today we get about 20 barrels of oil energy for every barrel expended. But still, that means we only lose 5% of the energy. Not too bad.</div><div class="MsoNormal"><br /></div><div class="MsoNormal" style="text-align: justify;">But now even that moderately difficult stuff is declining and we’re forced to go after oil that has an EROEI of around 5 or so. So with this oil we lose 20% of the energy in just getting it. This is why this oil didn’t get used up first—it’s not as profitable.</div><div class="MsoNormal"><br /></div><div class="MsoNormal" style="text-align: justify;">Now let’s consider the petroleum yet to be discovered. Why hasn’t it been discovered? Because this oil is the stuff no one wanted to go after until the price of oil was high enough to make it worth it. These reservoirs (which geologists think are likely there, but again, haven’t been confirmed) are mainly in deep waters, are trickier to find, to drill, to pump out, and have high rates of decline. They also have more problems with maintenance and shutdowns. (Think hurricanes.) The petroleum that might be in the Arctic is fraught with even more difficulties. The result is that the EROEI for this yet-to-be-discovered oil sinks down to 3. We will expend a full third of the energy just getting the oil out. If we’re lucky.</div><div class="MsoNormal"><br /></div><div class="MsoNormal" style="text-align: justify;">Biofuels (especially corn-based ethanol) have an EROEI of 1 or less. (It takes a heck of a lot of energy to grow corn and then process it into fuel. Worse, with the Midwest drought we are quickly reaching a point where we need our arable land to actually produce food again.) Shale oils have an EROEI of 3 or less. Again, the IEA numbers ignore the energy in part and just count the energy out.</div><div class="MsoNormal"><br /></div><div class="MsoNormal">Put all the EROEI considerations together and we get a net oil energy picture that looks like:</div><div class="MsoNormal"><br /></div><table cellpadding="0" cellspacing="0" class="tr-caption-container" style="margin-left: auto; margin-right: auto; text-align: center;"><tbody><tr><td style="text-align: center;"><a href="http://3.bp.blogspot.com/--GysT_CJmZY..." imageanchor="1" style="clear: right; margin-bottom: 1em; margin-left: auto; margin-right: auto;"><img border="0" height="280" src="http://3.bp.blogspot.com/--GysT_CJmZY..." width="400" /></a></td></tr><tr><td class="tr-caption" style="text-align: center;">Taking into account EROEI</td></tr></tbody></table><div class="separator" style="clear: both; text-align: center;"></div><div class="MsoNormal" style="text-align: justify;">With our glasses de-rosified, we see that as oil becomes more and more energy-intensive (and expensive) to get out of the ground, oil production peaks in 2015 and then sinks to 79.7 Mb/d in 2035. Not so rosy after all.</div><div class="MsoNormal"><br /></div><div class="MsoNormal" style="text-align: justify;">Now at this point you might be asking why can’t we count oil that was essentially created from natural gas (via refinery gain or ethanol) even if there is no energy gain or a small loss? If we have plenty of natural gas, is it so bad to use it to create the oil we desire? The first problem with this is that there won’t always be as much as natural gas available as there is now. In fact, in the US, natural gas comes in boom and bust cycles. During boom years when the price is high, companies start drilling like crazy to get in on the profits. Soon we have so much natural gas, it becomes dirt cheap! But then all the companies that drilled like crazy begin losing money and cut way back on drilling. (This is where we are now.) Since the wells have high decline rates, natural gas production drops dramatically within a few years. Then, as supply falls and the price shoots up, the cost-effectiveness of turning it into “oil” plummets, refineries stop using it as an energy source, ethanol (unless wildly subsidized by the government) disappears altogether, and the cycle starts again. In addition, since natural gas is not infinite, it should be put to the best possible use, arguably electricity generation in place of coal. We also have to consider that the EROEI for natural gas is not great—only about 10 when we include shipment/transportation to the end user—and appears to be falling. Add on to that, there are environmental problems with fracking, and add on to that, even natural gas contributes to climate change, so within the next couple decades we need to wean ourselves from it as an energy source as well. In the end we have to comprehend the energy available to us as an entire whole. By pretending that converting one source of energy into another creates new energy, we double count the energy and distort both our understanding and our decision-making.</div><div class="MsoNormal"><br /></div><div class="MsoNormal" style="text-align: justify;">We have one more step to truly clear our vision<b>: </b><b style="mso-bidi-font-weight: normal;">the fifth step</b>, which has multiple parts.</div><div class="MsoNormal"><br /></div><div class="MsoNormal" style="text-align: justify;">The IEA projections of oil production include an optimistic 3.3% decline rate per year from current wells. The observed historical decline rate is 5%. Which decline rate should we be counting on? Step five says use historical precedent.</div><div class="MsoNormal"><br /></div><div class="MsoNormal" style="text-align: justify;">Some of the oil projected to be produced is of a form so costly to refine or in areas so difficult to extract that this oil will ultimately stay in the ground because no one will pay the price it takes to produce and/or refine it. Reserves aren’t reserves if, for example, gasoline needs to be $30 a gallon to make the economics work out. If gasoline did rise to $30 a gallon, very little would be sold because it would leave households with no money for anything else. So the really difficult stuff just isn’t ever going to see the light of day. Step five subtracts them off.</div><div class="MsoNormal"><br /></div><div class="MsoNormal" style="text-align: justify;">The IEA projections assume a profoundly unrealistic pace of discovery of as-yet-unknown reserves, a rate four times greater than what has actually occurred over the past 20 years. (And this while oil prices quadrupled.) In addition, oil companies have proven to have less appetite for risk and investment during times of economic uncertainty, making them less likely to go after high risk plays that may or may not pay for themselves. Step five fine-tunes the projections in line with historical precedent.</div><div class="MsoNormal"><br /></div><div class="MsoNormal" style="text-align: justify;">A substantial amount of projected “oil” production is natural gas liquids. But only one third of these “liquids” (they are actually gases) can be refined into gasoline.<span style="mso-spacerun: yes;"> </span>(And they can’t be refined at all into diesel.) So they are overstated as “oil” by two thirds. In addition, due to shale oil’s dramatic decline curves, intense water usage, and cost of horizontal drilling, Turiel believes the IEA’s optimistic estimates of how much shale oil will ever be produced are overstated by half. Step five corrects these overstatements.</div><div class="MsoNormal"><br /></div><div class="MsoNormal" style="text-align: justify;">So here is the final graph of world oil net energy that awaits us looking through our reality-based glasses that are now clear of distortions:</div><div class="MsoNormal" style="text-align: justify;"><br /></div><table align="center" cellpadding="0" cellspacing="0" class="tr-caption-container" style="margin-left: auto; margin-right: auto; text-align: center;"><tbody><tr><td style="text-align: center;"><a href="http://2.bp.blogspot.com/-_c0a8FGLgJg..." imageanchor="1" style="margin-left: auto; margin-right: auto;"><img border="0" height="280" src="http://2.bp.blogspot.com/-_c0a8FGLgJg..." width="400" /></a></td></tr><tr><td class="tr-caption" style="text-align: center;"><span style="font-family: Cambria;">Net Oil Energy Reality</span></td></tr></tbody></table><div class="MsoNormal" style="text-align: justify;"><br /></div><div class="MsoNormal" style="text-align: justify;">This is possibly the most important graph you will look at this year. What we have is a very serious downward slope that starts very soon. In fact, it’s started all ready.<span style="mso-spacerun: yes;"> </span></div><div class="MsoNormal"><br /></div><div class="MsoNormal" style="text-align: justify;">Oil provides 36% of the energy that the US consumes. We import 48% of the oil we use. (Energy-wise, not barrel-wise.) Oil currently powers 96% of our transportation. We are less than 5% of the world’s population but use 22% of its oil. At the moment the world produces only about 70 mb/d of real oil energy, and by 2018 this output will likely drop by almost a fourth. Even more ominous, oil-exporting countries such as Saudi Arabia, Mexico, Russia, Iraq, Canada, Algeria, and the UAE are using more and more oil domestically, leaving less for importers (like the US) to buy on the world market. (In 2012 there was 5% less oil available on the world market for importers to buy than in 2006.) And last but not least, there are a number of up and coming countries (like China, India, Vietnam, Brazil, and Turkey) who historically have used very little oil per person, whose use has increased the last five years, and who want to use a whole lot more. If it weren’t for some European countries <a href="http://karenlynnallen.blogspot.com/20..." target="_blank">dropping oil consumption like a rock</a> (UK, Spain, Greece, Italy, Portugal—they’ve all dropped consumption by 6 – 11% in 2012 alone) the US would already be in a world of hurt (even though we’ve also dropped our consumption slightly.) But the time is not far off.<span style="mso-spacerun: yes;"> </span></div><div class="MsoNormal"><br /></div><div class="MsoNormal" style="text-align: justify;">The good news is that in the US we waste energy like crazy, so we could cut our energy use in half and still have a comparable standard of living. The good news is the EROEI for solar PV has been rising so it’s now close to 7, and the EROEI for wind is over 20. The good news it’s easy to drop energy consumption with house insulation, whole house fans, ceilings fans, heat pumps, bicycles, trains, rail freight, LED lights and living close to shops and jobs. The bad news is we’ve waited to the last minute to do all this, so the change is necessarily going to be dramatic and uncomfortable. The other bad news is that this decline in oil consumption won’t save us from increasingly violent climate change. It’s going to take the world getting off both coal and oil <i style="mso-bidi-font-style: normal;">and</i> a worldwide program of massive reforestation to do that. <span style="mso-spacerun: yes;"> </span></div><div class="MsoNormal"><br /></div><div class="MsoNormal" style="text-align: justify;">Perhaps the most obvious bad news is that cars with internal combustion engines (99% of all vehicles on the road) are going away in the US, likely half of them by 2018. Currently the average household has two cars. By 2018 this will drop to one.<span style="mso-spacerun: yes;"> </span>Currently the average household travels 19,652 vehicle miles/year. By 2018 this number will be under 10,000. Though this may seem unimaginable, the fact is internal combustion engines are an extraordinary waste of good gasoline. Our cars fritter away a full 3/4ths of the energy in every gallon, largely in the form of heat. Gasoline is amazing stuff. Each gallon is easily equal to three weeks of human labor. If we paid its value in minimum wage, the price at the pump would be $870.00 per gallon. As the amount available decreases, you can bet its dense, portable energy will be applied to far more efficient, productive uses than propelling 5000 lbs of metal to the grocery store in order to transport 8.4 lbs (a gallon) of milk home. </div><div class="MsoNormal"><br /></div><div class="MsoNormal" style="text-align: justify;">But won’t everyone just drive electric cars, you might ask? Right now in the US 37% of our electricity comes from coal. Not only can we not increase our electricity consumption, we need to decrease it until enough solar PV and wind can be built out to replace the electricity coal produces. (We also need to seriously upgrade our nation’s electrical grid infrastructure.) If we try to power electric cars with coal we will turn this planet into a crispy tostada. Yes, some rich people might have electric cars (along with a very large home solar array) but for the bulk of the population it’ll be at least a 10 – 15 year wait before enough electricity that won’t destroy the planet will be available to power even one electric car per household to go 8000 miles a year. In an energy-limited world you can count on transit and rail (far more energy-efficient than private cars) to predominate for long trips. (We won’t even mention the enormous difference in energy it takes to maintain a vast road network versus rail tracks.) For short trips, since walking and biking win out hands down energy-wise, you can expect Americans to relearn what our legs are for.</div><div class="MsoNormal"><br /></div><div class="MsoNormal" style="text-align: justify;">If we’d started twenty years ago to prepare for the energy transition ahead of us, we’d be in much better shape. As it is, fasten your seatbelt, or (you bicyclists) hold on tight to your handlebars. The end of the age of oil means we’re in for bumpy ride.</div>
January 13, 2013
Looking into the Crystal Ball: Predictions for 2013
 I’ll start off with the easy stuff, continuations of trends already in progress.
 1. Young people turn urban. The under 30 crowd will continue to flock to urban areas, eschew car purchases, bicycle in ever-larger numbers, as well as walk, take transit and use a car sharing service from time to time. This means in 2043, 50-somethings will be in much better health than they are today.
2. Oldsters turn urban. Boomers between the ages of 50 and 70 will downsize, abandon suburbia and head for urban areas where there is more to do and less lawn to mow. They will bring their cars with them and then be grouchy they can’t park anywhere.
3. Housing prices uneven. Housing in urban areas on the US coasts will appreciate slightly on average while housing in distant suburbs of the same cities will continue to lose value.
 Up, up, up4. Some difficult trends continue. As in 2012, in 2013 food stamp use will again increase in the US, the average price for a gallon of gas in will again be higher than the previous year, the Gini Index measure of inequality will again rise in the US, and median real household income will again decline.
5. Turmoil in the Middle East and North Africa. (Not a hard call!) Specifically, there will be turmoil in countries that have recently transformed or are in the process of transforming from net oil exporter to net oil importer. The exporter to importer transition creates upheaval not only because an important source of revenue dries up but also because precious hard currency now has to buy energy imports, wreaking even more havoc with balance of payments. Middle East and North African countries likely to encounter turmoil (or more turmoil) are Egypt, Syria, Yemen, and Tunisia. Other countries that might experience turbulence are Argentina, Uzbekistan, Indonesia, Malaysia, Vietnam, and the United Kingdom. Might even see a little upheaval in Denmark.
 2012 was painful enough6. Serious oil import pain. These countries will drop oil imports by more than 5% in 2013: Greece, Portugal, Spain, Italy, Ireland, UK, Poland, Hungary, Bulgaria, and Syria. This will largely be due to painful economic necessity and occur through drops in passenger miles traveled rather than through investment in energy-efficient mass transit. The countries in the graph above already dropped by 5% or more in 2012.
7. Moderate oil import discomfort. These countries will drop oil consumption by 1 to 5%: USA, Belgium, Netherlands, Finland, Sweden, Austria, Germany, and France. In most of these countries (except the US), wasteful oil use has already been curtailed so consumption will drop primarily through increased investment in and use of public transportation. This will improve the economic performance of these countries. In the US oil consumption will drop through greater vehicle efficiency, fewer miles traveled, and a moderate amount of increased public transit use. To achieve the transportation efficiency of most European countries, US oil consumption will eventually have to drop in half, and miles traveled by private vehicles will eventually have to drop two-thirds. This will happen, but not next year.
8. Still on the upswing. Countries that will increase consumption by more than 1%: Canada, Australia, South Korea, Japan, Mexico, Turkey, Vietnam, India, Brazil, Thailand, Argentina, Iraq, Venezuela, Libya, Saudi Arabia, Qatar, Iran, Jordan, Turkmenistan. Most of these countries are oil producers who have long subsidized oil sales to placate their populations. (Once a country subsidizes anything, removing the subsidy is difficult.) Some countries, such as Turkey, Brazil, Vietnam and Thailand, are still expanding economically, have a lot of population, have historically used very little oil, and get a lot of economic return from even small additional amounts of oil used.
9. Solar booming in some places. California will continue to outpace the rest of the US in rate of solar PV installation. Germany will continue to outpace both California and the US for same.
10. The US will not run a balanced budget in 2013. A hamster could predict this.
11. The Federal Reserve will continue to monetize US government debt. The hamster’s sister could predict this.
12. The US economy will continue to slowly contract as households with at least one member unemployed will “insource” domestic tasks rather than purchase/hire them for pay. Outsourcing of shopping, cooking, gardening, sewing, laundry and childcare, which caused apparent economic expansion when women entered the work force in volumes in the 80s and 90s, will become again part of the domestic, uncounted, economy. (The amount of real work done, however, won’t change.)
13. Some will do better than others. US cities that offer attractive alternatives to fossil fuel-powered transportation—safe routes to walk and bike, electrified trams, metros and buses—will be have stronger economies in 2013 than those that don’t because less consumer spending will immediately leave their economies. (The exceptions will be cities directly involved in the gas and/or oil business.) Somewhat dicier calls:
1. Greece or Germany will leave the Euro. (One or the other.) If Greece goes, likely Spain will leave as well. 2. Oil exports from Mexico plus Venezuela will decrease as much as oil exports from Canada increase.3. US consumption of oil and coal will drop by 5%. US consumption of natural gas will increase by 4%. 4. Each region of the US will have a period of gasoline supply troubles, either due to weather, other natural disaster, or refinery capacity. These incidents will cause shortages or gasoline prices at the pump above $5/gallon. 5. Japan’s economy will come apart at the seams, in no small part due to having to import fossil fuels to meet a large portion of their energy needs. (But this doesn’t mean their society will follow suit, seam-wise.) 6. China’s economy will flatline, going neither down nor up in 2013, although with their population, this means running pretty fast just to stay in same place. 2014 is a question mark. China's smog and pollution issues will grow so dire that they will actually not increase coal consumption in 2013. 7. If the Middle East remains stable, US oil production will plateau in 2013 due to high production drop off rate of tight oil wells (oil production in North Dakota.) US production of natural gas will drop due to reduction in natural gas well drilling and sharp well depletion rates. 8. If the Middle East becomes chaotic enough to disrupt oil production (possibly due to high worldwide grain prices resulting from US Midwest drought and/or US corn ethanol production), oil prices will sky rocket. This will cause oil that is currently uneconomic to drill and pump in the US to suddenly become economic. In that scenario, US oil production would increase while overall US oil consumption would drop. 9. The deduction homeowners can take off their taxes for mortgage interest will be reduced (possibly just for upper incomes) or dropped altogether. 10. Fearing political backlash, Congress will still refuse to raise the gas tax or even index it to inflation. Instead, road repair and maintenance will continue to be paid for with debt. Individual states, however, will begin to raise state gas taxes in 2013. 11. The Midwest drought will raise the price of ethanol so much that everyone except corn farmers will curse the mandated 10% ethanol content in gasoline. The amount of corn going into ethanol will also raise the price of animal feed which will raise the price of meat and dairy. However, if high grain prices actually cause revolutions in oil-producing countries, ethanol may again seem cheap in comparison to oil.
Medium term, the items below can’t continue because we will no longer be able to afford the squandering of resources and/or absorb the harm inflicted. One way or another they’ll be gone/kaput by 2018, but they may still wreak havoc in 2013:
1. US spending 18% of GDP on health care. (Other wealthy countries spend 11.5%)
2. US spending 5% of GDP on military. (Other wealthy countries spend 1.5%)
3. US debt 106% of GDP
4. Ethanol
5. War on drugs
6. $1 trillion dollars in student debt
7. One third of Americans obese
8. 11% of US adults diabetic
9. Internal combustion engines (due to gross inefficiency--over 75% of energy input lost)
10. High fructose corn syrup
11. Coal-burning power plants
12. Freight shipment by methods other than water or rail (and perhaps electric truck for the last few miles.)
13. Average of 845 square feet of living space per person in the US.
14. Over-use of air conditioning and air conditioning of the outdoors
The above mean these parts of the economy will shrink/diminish over the next five years: health care, prisons, brick and mortar college education, military, corn farming, coal mining, diesel trucking, airfreight, air transport, road building.
These areas will expand/increase over the next five years: farming of all products other than corn, on-line education, renewable energy, electrical power grid expansion and upgrade, rail and transit construction and maintenance, rail and transit operation, rail freight, bicycles, electric bicycles, energy-efficient housing, energy efficiency retrofits, housing near transit/in urban settings.
January 6, 2013
Drunk Driving in San Francisco
 I love data and the stories it can tell us. But one data point that saddens me is that two weeks ago in San Francisco a drunken 23-year-old woman hit three Chinese tourists with her car and killed one of them. The driver, who had three passengers in various states of inebriation with her, left the scene (hit and run) but was later apprehended by the police. At the very least, this is a terrible way for the city to treat its tourists. But it made me consider just how prevalent a problem drunk driving is in San Francisco and how well or ineptly we are dealing with it.
Let’s look at the data. First off, overall crime has been decreasing in San Francisco the last ten years. This has been true in big cities nationwide, but murders, assaults, rapes and robberies are all down in San Francisco, so let’s give our police department and judicial system some credit.
However, one statistic isn’t down in San Francisco—fatalities and injuries due to alcohol-related collisions. The number of alcohol-related fatalities have held steady the last five years and alcohol-related injuries are actually up. In 2010, there were 50 murders in San Francisco and 32 traffic deaths. 41% of those traffic deaths involved alcohol. (Statewide the number is 39%.) In 2010 there were 2386 assaults and 4788 traffic injuries. (Traffic injuries tend not to be reported unless they warrant a trip to the hospital where a report is filed.) 10% of those traffic injuries involved alcohol. (Statewide the number is 10.6%.) So you can see as violent crime rates come down and alcohol-related traffic fatalities and injuries don’t, alcohol-related traffic issues grow in significance.
 So then we might wonder, just how tough is San Francisco on alcohol-impaired driving? It turns out that while California has some of the stricter DUI laws in the US, San Francisco is one of the laxest counties in the state when it comes to enforcement. In a 2011 DMV report, “An Evaluation of Factors Associated with Variation in DUI Conviction Rates Among California Counties,” that evaluates data from 2000 – 2006, it turns out that the county of San Francisco is the fifth worst of all 58 California counties in DUI conviction rates. Our conviction rate is 58.2% while Marin County’s is 85.8 and San Mateo County’s is 76.7. (It turns out that Marin has a remarkably low alcohol-related fatality rate—only one death in all of 2010.)
 And San Francisco has the lowest, let me repeat, lowest DUI arrest rate of any county in the state. In 2006 it was .3 per 100 licensed drivers. In 2010, it was still .3. The statewide average is .9. In 2010 fewer DUI arrests were made in San Francisco than the previous two years (2008—1483, 2009—1534, 2010--1480.) And we have the highest rate in the state (10.4%) of letting DUI-arrested people plea bargain down to “dry reckless,” meaning a reckless driving charge with no alcohol-related penalties, points or priors involved. And we have a very high rate (13.6%) of letting DUI arrested people plea bargain down to a “wet reckless” charge, meaning an alcohol-related reckless driving charge. Neither “wet reckless” or “dry reckless” plea bargains involve license suspension at all. (For a troubling look at how San Francisco lawyers help DUI-arrested people plea bargain down, see here.) Drivers for whom San Francisco allowed “wet reckless” plea bargains had a mean blood alcohol content (BAC) of .112, well over the legal limit of .08! The people actually convicted of DUIs in San Francisco had a mean BAC of .169, more than double the legal limit! (The San Francisco archbishop who was arrested this last October for a DUI with a BAC of .11 plea bargained down to a “wet reckless” which meant a fine, probation and no license suspension. Because, you know, a license suspension would be inconvenient.)
 Stricter blood alcohol levels
Note than in Sweden and Norway the legal limit for blood alcohol content is .02. Over .02 and you get your license suspended for three months. In San Francisco we don’t give DUIs unless the person is so drunk he/she basically can hardly put their keys in the ignition.
 Calibrate the darn thingAnd then we have the issue last spring of probable faulty calibration of the breathalizers used to determine blood alcohol content levels. This sloppiness by SFPD may result in over a thousand DUI cases since 2006 being overturned. Honestly, it’s pathetic.
The study mentioned before found that counties with low DUI conviction rates (of which San Francisco was one) had a 45% higher rate of alcohol-related crashes and injuries than in counties with high DUI conviction rates. The 2012 Annual Report of the California DUI Management Information System shows that statewide 3.1% of DUI first offenders had crashes within a year after their conviction, while only 1.9% of second offenders (who routinely receive much harsher penalties) had crashes within a year of their second conviction. Of course, this may be due to the fact that second offenders get their licenses suspended for a much longer period of time. (No license = fewer crashes.)
The 2012 Annual Report mentioned above shows the findings of a 1994 study which determined that 24% of first-time DUI offenders will incur another DUI incident within the next 8 years. It also shows that at the end of 13 years, 30% of male DUI offenders had reoffended as compared to 21% of women DUI offenders. (87% of all DUI offenders in 1994 were male. In 2009 close to a fourth were female.) DUI recidivism did use to be much higher before 1980. The drop is largely attributable to the implementation in 1982 of tougher sanctions on DUI offenders and implementation a lower legal blood alcohol limit. The report also offered up findings that show that assigning alcohol-reckless drivers to a either a 3 month or 9 month DUI intervention program has very limited effect on 1-year crash rates or further DUI incident rates.
So who is causing the fatal crashes, first timers or chronic drink and drivers? In 2009, 69% of drivers arrested in alcohol-involved fatal crashes had no prior DUI or alcohol-related reckless driving convictions. (Though in San Francisco they might have effectively plea-bargained down to “dry reckless” which wouldn’t have shown up in the data.) Another 24% involved drivers with one prior. When you throw into the mix the fatal crashes of drivers who had been drinking (according to the crash report) but were not even arrested, 74% of all alcohol-related fatal accidents involve no prior DUI, and 19% involve a driver with one prior. The chronic recidivists account for only 7% of fatal accidents.
It is interesting to look at alcohol-related injury and crashes—who is responsible and when they happen. In 2010 in California, alcohol-impaired men between the ages of 18 and 32 killed at a rate 5 – 8 times that of alcohol-impaired women. However, after age 32, men killed at rate only 3 times that of women. Peak age for alcohol-impaired driver to kill someone: 24. Peak age to injure someone: 21. Peak age for driver to be killed: 24. Peak age for driver to be injured: 21. Peak age for passenger to be killed in a collision involving alcohol: 21. Peak age for passenger to be injured: 18. Peak ages for pedestrians to be killed in a collision involving alcohol: 29, 46, and 58. (Not sure why there should be three mini peaks?) Peak age for a pedestrian to be injured: 22. Peak age for a bicyclist to be killed in a collision involving alcohol: three peaks at 21, 46 and 52. (Obviously people who are 46 years old should watch the heck out.) Peak age for bicyclist to be injured: 24.
 When the fatal accidents occurAlcohol-related fatal collisions in California are most likely to happen at 2am Saturday morning, but actually all Saturday evening and the wee hours of Sunday morning are pretty darn bad, as is Friday evening/ early Saturday morning. What’s surprising to me is how bad Sunday evening is from 5pm to 10 pm—worse than Friday from 5 pm to midnight.
 Now let’s look at San Francisco public health in general. First the good news—San Franciscans are a healthy bunch, much healthier than the US average! Our men on average live 77.7 years, 2.3 years more than the US average, and our women live to 83.6 years, 3.2 years more than the national average. We have a much lower cancer rate than the national average, lower rates of chronic liver disease, coronary heart disease, diabetes (half the national rate!), Alzheimers, breast cancer, prostate cancer, and lung cancer. However, we have more drug-related deaths than average and more homicide deaths than the national average. We are equal to the nation’s average for firearm-related deaths and suicides. Children don’t tend to die at high rates in general, but for children in San Francisco ages 1 – 4, motor vehicle accidents are tied for the second leading cause of death. For children ages 5 – 14, motor vehicle accidents are tied for fourth. For persons aged 15 – 24, violence/assault is the leading cause of death, self-inflicted injuries come in second, and motor vehicle accidents are the third. For ages 25 – 34, violence/assault and self inflicted injuries are again one and two, and motor vehicle accidents are down at number 5. By age 35 people really start dying of enough different causes that motor vehicle accidents don’t make the top ten.
 Your liver should not look like this.(Just as an aside, I have to say from the data, if you’re 35 – 44 and can manage not to unintentionally overdose yourself with drugs, not commit suicide, not abuse drugs, not abuse alcohol, and not get hit by a car, you stand a very good chance of living to see 45. And if from 45 – 54 you can take it easy on the drugs and alcohol, not get hit by a car, and not commit suicide, you will very likely make it to 55.After 55, heart disease kicks in, but if you’ve been walking and biking the preceding years you’ll be protected from that, so again taking it easy on the drugs and alcohol will really increase your odds of making it to 65. I am just amazed how many San Franciscans die of cirrhosis of the liver, though it's true some could be due to hepatitis. But it’s pretty much all men. Very few women die of cirrhosis or alcohol abuse.)
So why am I putting so much effort into research and writing this? Do I hate alcohol? Do I just want no one to have any fun? Actually I’m very fond of a nice glass of wine, and philosophically I am against prohibitions of all kinds. When it comes to substances/items/behaviors that create public health risks, I favor policies of regulation, taxation and concerted education campaigns rather than making the substance/item/activity illegal. Yes, I have friends and family members who have died or suffered tragedy due to traffic accidents and drunk driving. I would be extremely surprised if anyone reading this has not.
But to go even further, the more I look at the data surrounding DUIs in San Francisco, the more appalled I am. Since my family does not drive much, my family members and I are often out on the streets of San Francisco walking, biking or waiting to take transit. This makes us vulnerable to irresponsible vehicle drivers. In fact, because members of my family walk and bike so much we are generally fit and healthy enough that a traffic accident will be the most likely cause of our early death! This is especially true for my children. And since 40% of all traffic fatalities in San Francisco involve alcohol, you bet this concerns me. Though we’d rather not face it, cars kill more people than guns do in the United States. In 2010, firearms killed 31,513 people, 19,308 of which were suicides. Traffic accidents killed 32,788. If you are not suicidal, you are far, far more likely to be killed by a car than a gun.
 Some countries drink and don't killNow guns kill almost nobody in Europe, but cars also kill way less people there. (Yes, it's people who shoot the guns, and people who drive the cars.) The traffic fatality rate in Sweden is one fourth of ours. Yes, they drive less, but even their fatality rate per vehicle mile traveled is 40% of ours. And they consume more alcohol per capita than we do! The traffic fatality rates of the Netherlands, Finland, Denmark, Switzerland and Norway are 34%, 48%, 43%, 41%, and 41% of ours respectively, and all but Norway consume more alcohol per capita than we do. (The Finns and the Danes drink 30-40% more!) Traffic accidents cost the US $300 billion dollars a year, of which less than half is paid for through drivers’ insurance premiums. The rest is shouldered by all of us through increased health care premiums, increased Medicare costs, increased emergency personnel costs, clean up costs, and lives lost. If licensed drivers in the US were to pay the full cost of all the accidents motor vehicles incur, each would pay an additional $1500 per year. When you think about it, that is a pretty hefty subsidy.
Cars are powerful, dangerous and heavy. Their mass combined with potential for extremely fast acceleration is not to be taken lightly. Monetary penalties and points on a license are not sufficient deterrents to irresponsible driving, especially when it is so easy to reduce these penalties on the first offense. Besides, we don’t need reckless drivers to be poorer—we need them off the road until they truly commit to driving more responsibly. The penalty for irresponsible, reckless driving should be significant license suspension (90 to 180 days) rather than monetary penalties, alcohol programs (which don’t work) or even jail time. And the suspension needs to happen the very first offense. (In addition, driving with a suspended license or without a license should result in the car involved being permanently impounded.) License suspension is the one penalty that drivers fear enough to actually change their behavior. But because we’ve by and large designed our way of life around car driving, because we consider driving a necessity rather than a privilege granted only to responsible people, it is tragic that the one penalty that might reduce reckless driving and save lives is the penalty our court system is most loath to hand out.
January 2, 2013
Conquer Twin Peaks and Stand on the Rooftop of San Francisco
<!-- /* Font Definitions */ @font-face {font-family:"MS 明朝"; panose-1:0 0 0 0 0 0 0 0 0 0; mso-font-charset:128; mso-generic-font-family:roman; mso-font-format:other; mso-font-pitch:fixed; mso-font-signature:1 134676480 16 0 131072 0;} @font-face {font-family:"MS 明朝"; panose-1:0 0 0 0 0 0 0 0 0 0; mso-font-charset:128; mso-generic-font-family:roman; mso-font-format:other; mso-font-pitch:fixed; mso-font-signature:1 134676480 16 0 131072 0;} @font-face {font-family:Cambria; panose-1:2 4 5 3 5 4 6 3 2 4; mso-font-charset:0; mso-generic-font-family:auto; mso-font-pitch:variable; mso-font-signature:-536870145 1073743103 0 0 415 0;} /* Style Definitions */ p.MsoNormal, li.MsoNormal, div.MsoNormal {mso-style-unhide:no; mso-style-qformat:yes; mso-style-parent:""; margin:0in; margin-bottom:.0001pt; mso-pagination:widow-orphan; font-size:12.0pt; font-family:Cambria; mso-ascii-font-family:Cambria; mso-ascii-theme-font:minor-latin; mso-fareast-font-family:"MS 明朝"; mso-fareast-theme-font:minor-fareast; mso-hansi-font-family:Cambria; mso-hansi-theme-font:minor-latin; mso-bidi-font-family:"Times New Roman"; mso-bidi-theme-font:minor-bidi;} .MsoChpDefault {mso-style-type:export-only; mso-default-props:yes; font-family:Cambria; mso-ascii-font-family:Cambria; mso-ascii-theme-font:minor-latin; mso-fareast-font-family:"MS 明朝"; mso-fareast-theme-font:minor-fareast; mso-hansi-font-family:Cambria; mso-hansi-theme-font:minor-latin; mso-bidi-font-family:"Times New Roman"; mso-bidi-theme-font:minor-bidi;} @page WordSection1 {size:8.5in 11.0in; margin:1.0in 1.25in 1.0in 1.25in; mso-header-margin:.5in; mso-footer-margin:.5in; mso-paper-source:0;} div.WordSection1 {page:WordSection1;} </style> <br /><div class="separator" style="clear: both; text-align: center;"><a href="http://4.bp.blogspot.com/-z0NGjvNfGhw..." imageanchor="1" style="margin-left: 1em; margin-right: 1em;"><img border="0" height="207" src="http://4.bp.blogspot.com/-z0NGjvNfGhw..." width="400" /></a></div><div class="MsoNormal"><br /></div><div class="MsoNormal" style="text-align: justify;">San Francisco is a scenic city. It just can’t help itself. Vistas with ever-changing combinations of bridges, fog, sunlight and water can bewitch and bemuse even the most jaded long-time resident. We all have our favorite beguiling corners of town, but for spectacular 360-degree views, the two hills rising in the city’s very center cannot be beat. (Except, of course, on those days when they are entirely shrouded in fog. Even it has its allure.)</div><div class="MsoNormal"><br /></div><div class="MsoNormal" style="text-align: justify;">Twin Peaks rises to 922 or so splendid feet, beaten out for highest point in the city honors by Mount Davidson by a paltry six feet. But though Mount Davidson might be tallest, it offers nowhere near the views.<span style="mso-spacerun: yes;"> </span></div><div class="MsoNormal"><br /></div><div class="MsoNormal" style="text-align: justify;">There are many modes of transport to Twin Peaks—by car, tour bus, or even by bicycle. But if you are willing to make the effort, getting to the roof of the city on foot is a uniquely jubilant, exhilarating experience. Though you might think it would be an ordeal to scale mighty Twin Peaks under your own power, it’s really not that bad of a walk—it takes only 40 or 45 minutes. (You might even call it a nice afternoon stroll with a bit of a hike at the end.) To help you on your way, I will outline a route that is both scenic and the easiest climb up the hill.<span style="mso-spacerun: yes;"> </span>After a certain point, it’s also quiet and almost car-free, allowing a nice separation from the hustle and bustle of the city below.</div><div class="MsoNormal"><br /></div><table cellpadding="0" cellspacing="0" class="tr-caption-container" style="float: left; margin-right: 1em; text-align: left;"><tbody><tr><td style="text-align: center;"><a href="http://3.bp.blogspot.com/-ONWSRaVhJVE..." imageanchor="1" style="clear: left; margin-bottom: 1em; margin-left: auto; margin-right: auto;"><img border="0" height="200" src="http://3.bp.blogspot.com/-ONWSRaVhJVE..." width="150" /></a></td></tr><tr><td class="tr-caption" style="text-align: center;"><span style="font-family: Cambria;">Castro Muni Station</span></td></tr></tbody></table><table cellpadding="0" cellspacing="0" class="tr-caption-container" style="float: right; margin-left: 1em; text-align: right;"><tbody><tr><td style="text-align: center;"><a href="http://4.bp.blogspot.com/-PuvV9YPjUXU..." imageanchor="1" style="clear: right; margin-bottom: 1em; margin-left: auto; margin-right: auto;"><img border="0" height="200" src="http://4.bp.blogspot.com/-PuvV9YPjUXU..." width="150" /></a></td></tr><tr><td class="tr-caption" style="text-align: center;">Walkway from station</td></tr></tbody></table><div class="MsoNormal" style="text-align: justify;">First off, take the Muni underground (or the scenic F-line if you’ve got time to burn) to the Castro/Market Street station. If you’ve never been to the Castro before, head down Castro Street to 18<sup>th</sup>, then turn right and walk up 18<sup>th</sup> Street to get your scenic fill.<span style="mso-spacerun: yes;"> </span>(At Eureka you’ll join up with my preferred route.) If the Castro is old hat and you want a route with the least hill, make a hard left coming out of the Muni station, walk along the walkway that crosses above the station (Market Street will be directly parallel on your right.) </div><div class="MsoNormal" style="text-align: justify;"><br /></div><table cellpadding="0" cellspacing="0" class="tr-caption-container" style="float: left; margin-right: 1em; text-align: left;"><tbody><tr><td style="text-align: center;"><a href="http://1.bp.blogspot.com/-AOb0ypG7wWg..." imageanchor="1" style="clear: left; margin-bottom: 1em; margin-left: auto; margin-right: auto;"><img border="0" height="400" src="http://1.bp.blogspot.com/-AOb0ypG7wWg..." width="300" /></a></td></tr><tr><td class="tr-caption" style="text-align: center;">Golden Winter Ginko</td></tr></tbody></table><div class="MsoNormal" style="text-align: justify;"><a href="http://1.bp.blogspot.com/-zC8sD9tLtRY..." imageanchor="1" style="clear: right; float: right; margin-bottom: 1em; margin-left: 1em;"><img border="0" height="200" src="http://1.bp.blogspot.com/-zC8sD9tLtRY..." width="150" /></a>Cross Collingwood, continue along Market until Eureka. Turn left on Eureka and walk up Eureka to 20<sup>th</sup> street. On your way you may be lucky and see some vivid golden Ginko trees, their leaves scattered like silent haikus on the ground.</div><div class="MsoNormal"><br /></div><table cellpadding="0" cellspacing="0" class="tr-caption-container" style="float: right; margin-left: 1em; text-align: right;"><tbody><tr><td style="text-align: center;"><a href="http://4.bp.blogspot.com/-NoRvzzZtscM..." imageanchor="1" style="clear: right; margin-bottom: 1em; margin-left: auto; margin-right: auto;"><img border="0" height="200" src="http://4.bp.blogspot.com/-NoRvzzZtscM..." width="150" /></a></td></tr><tr><td class="tr-caption" style="text-align: center;">Victoriana</td></tr></tbody></table><table cellpadding="0" cellspacing="0" class="tr-caption-container" style="float: left; margin-right: 1em; text-align: left;"><tbody><tr><td style="text-align: center;"><a href="http://3.bp.blogspot.com/-76XSsTTzjkE..." imageanchor="1" style="clear: left; margin-bottom: 1em; margin-left: auto; margin-right: auto;"><img border="0" height="200" src="http://3.bp.blogspot.com/-76XSsTTzjkE..." width="150" /></a></td></tr><tr><td class="tr-caption" style="text-align: center;">Your first stairs</td></tr></tbody></table><div class="MsoNormal" style="text-align: justify;">At 20<sup>th</sup> Street turn right.<span style="mso-spacerun: yes;"> </span>Now you’re going to really get away from cars. Enjoy the Victorian charm you come across.<span style="mso-spacerun: yes;"> </span>At the top of this somewhat steep little block (at the corner of 20<sup>th</sup> and Douglass) you will see a staircase on your left.<span style="mso-spacerun: yes;"> </span>Take it. You will pass gardens offering blooming plants, even on New Year’s Day (the date most of these photos were taken.)<span style="mso-spacerun: yes;"> </span> </div><div class="MsoNormal"><br /></div><div class="MsoNormal"><br /></div><table cellpadding="0" cellspacing="0" class="tr-caption-container" style="float: left; margin-right: 1em; text-align: left;"><tbody><tr><td style="text-align: center;"><a href="http://1.bp.blogspot.com/-lqdK1LCj-Ks..." imageanchor="1" style="clear: left; margin-bottom: 1em; margin-left: auto; margin-right: auto;"><img border="0" height="200" src="http://1.bp.blogspot.com/-lqdK1LCj-Ks..." width="150" /></a></td></tr><tr><td class="tr-caption" style="text-align: center;"><span style="font-family: Cambria;">Take these, too.</span></td></tr></tbody></table><table cellpadding="0" cellspacing="0" class="tr-caption-container" style="float: right; margin-left: 1em; text-align: right;"><tbody><tr><td style="text-align: center;"><a href="http://4.bp.blogspot.com/-TcA38gdgTtc..." imageanchor="1" style="clear: right; margin-bottom: 1em; margin-left: auto; margin-right: auto;"><img border="0" height="200" src="http://4.bp.blogspot.com/-TcA38gdgTtc..." width="150" /></a></td></tr><tr><td class="tr-caption" style="text-align: center;">Up you go</td></tr></tbody></table><div class="MsoNormal" style="text-align: justify;">At the top you will see another staircase across the street. Take it. At the top of these stairs veer left and walk along (and above) Douglass until Romain Street. Turn right on Romain. Go a block and half admiring small gardens along the way.<span style="mso-spacerun: yes;"> </span>At Market Street you’ll see a barrier in the center that prevents pedestrians from crossing.<span style="mso-spacerun: yes;"> </span>But this is not a problem because on your right is a very pleasant pedestrian overpass with an easy curling ramp. Take it up and over Market Street. If you turn around, you’ll get your first glimpse of views but these are minimal compared to what lies ahead.<span style="mso-spacerun: yes;"> </span></div><div class="MsoNormal"><br /></div><table cellpadding="0" cellspacing="0" class="tr-caption-container" style="float: left; margin-right: 1em; text-align: left;"><tbody><tr><td style="text-align: center;"><a href="http://3.bp.blogspot.com/-oUlfVGJ3yJs..." imageanchor="1" style="clear: left; margin-bottom: 1em; margin-left: auto; margin-right: auto;"><img border="0" height="320" src="http://3.bp.blogspot.com/-oUlfVGJ3yJs..." width="240" /></a></td></tr><tr><td class="tr-caption" style="text-align: center;">Romain garden</td></tr></tbody></table><div class="MsoNormal" style="text-align: justify;"><a href="http://2.bp.blogspot.com/-p7A5HcMuMzE..." imageanchor="1" style="clear: right; float: right; margin-bottom: 1em; margin-left: 1em;"><img border="0" height="150" src="http://2.bp.blogspot.com/-p7A5HcMuMzE..." width="200" /></a>After the overpass you’re on a lovely quiet block with gardens, few cars and no overhead wires. Take this to Corbett where you will turn left. On your right will be the aptly named Rooftop Elementary School and their sparkling glass tile murals. </div><div class="MsoNormal"><br /></div><table cellpadding="0" cellspacing="0" class="tr-caption-container" style="float: right; margin-left: 1em; text-align: right;"><tbody><tr><td style="text-align: center;"><a href="http://3.bp.blogspot.com/-iuhHv172y_8..." imageanchor="1" style="clear: right; margin-bottom: 1em; margin-left: auto; margin-right: auto;"><img border="0" height="150" src="http://3.bp.blogspot.com/-iuhHv172y_8..." width="200" /></a></td></tr><tr><td class="tr-caption" style="text-align: center;">The correct stairs</td></tr></tbody></table><div class="MsoNormal" style="text-align: justify;">Walk along Corbett to Hopkins and then turn right. Yes, Hopkins is steep but it only lasts a block.<span style="mso-spacerun: yes;"> </span>You may see people who have just conquered Twin Peaks walking towards you. You will know them from the rosy glow of their satisfied faces. At the top of Hopkins, you will see a staircase. Don’t take this! Turn left on Burnett, walk 50 yards, look right, and take the staircase across the street you see there.<span style="mso-spacerun: yes;"> </span>This is the first of four consecutive staircases you’ll take. This is the trek part of your journey, although not the final hike! </div><div class="MsoNormal"><br /></div><table cellpadding="0" cellspacing="0" class="tr-caption-container" style="float: right; margin-left: 1em; text-align: right;"><tbody><tr><td style="text-align: center;"><a href="http://2.bp.blogspot.com/-MXmwFZSszJw..." imageanchor="1" style="clear: right; margin-bottom: 1em; margin-left: auto; margin-right: auto;"><img border="0" height="200" src="http://2.bp.blogspot.com/-MXmwFZSszJw..." width="112" /></a></td></tr><tr><td class="tr-caption" style="text-align: center;">Someone's always faster</td></tr></tbody></table><table cellpadding="0" cellspacing="0" class="tr-caption-container" style="float: left; margin-right: 1em; text-align: left;"><tbody><tr><td style="text-align: center;"><a href="http://3.bp.blogspot.com/-wNnYfnoblGM..." imageanchor="1" style="clear: left; margin-bottom: 1em; margin-left: auto; margin-right: auto;"><img border="0" height="320" src="http://3.bp.blogspot.com/-wNnYfnoblGM..." width="240" /></a></td></tr><tr><td class="tr-caption" style="text-align: center;">The sidewalk speaks</td></tr></tbody></table><div class="MsoNormal" style="text-align: justify;">The four staircases are kept swept and the foliage trimmed, by whom (the city or the neighbors) I don’t know. If you’re lucky someone will leave you sidewalk poetry to peruse. There will undoubtedly be someone ascending these stairs faster than you.<span style="mso-spacerun: yes;"> </span>(They may even be jogging up them. Your mind will boggle.) That’s all right. Take your time. You’re almost at the top!</div><div class="MsoNormal"><br /></div><div class="separator" style="clear: both; text-align: center;"><a href="http://4.bp.blogspot.com/-e9hbpxDzzlA..." imageanchor="1" style="clear: right; float: right; margin-bottom: 1em; margin-left: 1em;"><img border="0" height="200" src="http://4.bp.blogspot.com/-e9hbpxDzzlA..." width="150" /></a></div><div class="MsoNormal" style="text-align: justify;">After the fourth staircase turn right onto Parkridge. Ahead you will see the first sign of real wildness, what the entire hill looked like once upon a time, a hillside covered with sage and brush.<span style="mso-spacerun: yes;"> </span>Follow Parkridge to the left as it becomes Crestline and climbs a mild hill. When the road crests, look to your right where you’ll see a sign with a little hiker.<span style="mso-spacerun: yes;"> </span>It looks like:</div><div class="MsoNormal"><br /></div><div class="separator" style="clear: both; text-align: center;"><a href="http://2.bp.blogspot.com/-jYammX0i7iU..." imageanchor="1" style="clear: right; float: right; margin-bottom: 1em; margin-left: 1em;"><img border="0" height="320" src="http://2.bp.blogspot.com/-jYammX0i7iU..." width="240" /></a></div><div class="MsoNormal" style="text-align: justify;">Now for the hike part. You are entering the Twin Peaks Natural Area managed by San Francisco Recreation and Park’s Department. These stairs require sure footing, but they don’t last forever. You can pause from time to time, turn slightly, and really see some views. </div><table cellpadding="0" cellspacing="0" class="tr-caption-container" style="float: left; margin-right: 1em; text-align: left;"><tbody><tr><td style="text-align: center;"><a href="http://3.bp.blogspot.com/-YUFU9OSBDlY..." imageanchor="1" style="clear: right; margin-bottom: 1em; margin-left: auto; margin-right: auto;"><img border="0" height="200" src="http://3.bp.blogspot.com/-YUFU9OSBDlY..." width="150" /></a></td></tr><tr><td class="tr-caption" style="text-align: center;">Wood ties invite you</td></tr></tbody></table><div class="MsoNormal"></div><div class="MsoNormal"><br /></div><div class="MsoNormal"><br /></div><div class="MsoNormal"><br /></div><div class="MsoNormal"><br /></div><div class="MsoNormal"><br /></div><div class="MsoNormal"><br /></div><div class="MsoNormal"><br /></div><div class="MsoNormal"><br /></div><div class="MsoNormal"><br /></div><div class="MsoNormal"><br /></div><div class="separator" style="clear: both; text-align: center;"></div><table cellpadding="0" cellspacing="0" class="tr-caption-container" style="float: right; margin-left: 1em; text-align: right;"><tbody><tr><td style="text-align: center;"><a href="http://1.bp.blogspot.com/-lZgRrll2BMI..." imageanchor="1" style="clear: right; margin-bottom: 1em; margin-left: auto; margin-right: auto;"><img border="0" height="150" src="http://1.bp.blogspot.com/-lZgRrll2BMI..." width="200" /></a></td></tr><tr><td class="tr-caption" style="text-align: center;">What's in your way</td></tr></tbody></table><table cellpadding="0" cellspacing="0" class="tr-caption-container" style="float: left; text-align: left;"><tbody><tr><td style="text-align: center;"><a href="http://3.bp.blogspot.com/-8ekYMN2JUGk..." imageanchor="1" style="clear: left; margin-bottom: 1em; margin-left: auto; margin-right: auto;"><img border="0" height="150" src="http://3.bp.blogspot.com/-8ekYMN2JUGk..." width="200" /></a></td></tr><tr><td class="tr-caption" style="text-align: center;">Where you want to go</td></tr></tbody></table><div class="MsoNormal" style="text-align: justify;"><br /></div><div class="MsoNormal" style="text-align: justify;"><br /></div><div class="MsoNormal" style="text-align: justify;"><br /></div><div class="MsoNormal" style="text-align: justify;"><br /></div><div class="MsoNormal" style="text-align: justify;"><br /></div><div class="MsoNormal" style="text-align: justify;"><br /></div><div class="MsoNormal" style="text-align: justify;"><br /></div><div class="MsoNormal" style="text-align: justify;"><br /></div><div class="MsoNormal" style="text-align: justify;"><br /></div><div class="MsoNormal" style="text-align: justify;"> At the top, you will come to a path that runs along Twin Peaks Boulevard, the road that snakes around our Peaks. You will see two Peaks in front of you. The one to the north is Eureka Peak and is most popular with tourists.<span style="mso-spacerun: yes;"> </span>The one to the south, Noe Peak, is right across the street from you, is slightly taller than its twin, and is my slight preference, though both are fabulous. To get to either you will have to get yourself over the concrete barrier and then cross two lanes of traffic.<span style="mso-spacerun: yes;"> </span>(You might wonder why there isn’t an opening in the concrete barrier that would allow the many people on foot to cross between the two clearly marked hiking paths with ease. You would not be alone in your wonder.)<span style="mso-spacerun: yes;"> </span>Luckily the cars on this road are few so crossing here is not difficult.</div><div class="MsoNormal"><br /></div><table cellpadding="0" cellspacing="0" class="tr-caption-container" style="float: left; margin-right: 1em; text-align: left;"><tbody><tr><td style="text-align: center;"><a href="http://2.bp.blogspot.com/-4CioNtRQo4Y..." imageanchor="1" style="clear: left; margin-bottom: 1em; margin-left: auto; margin-right: auto;"><img border="0" height="150" src="http://2.bp.blogspot.com/-4CioNtRQo4Y..." width="200" /></a></td></tr><tr><td class="tr-caption" style="text-align: center;"><span style="font-family: Cambria;">The final ascent</span></td></tr></tbody></table><div class="MsoNormal" style="text-align: justify;">Hike up the last set of wood tie stairs.<span style="mso-spacerun: yes;"> </span>At the top you get your reward--views, views, views, every way you look. <span style="mso-spacerun: yes;"> </span>You can see four bridges (Bay, Golden Gate, San Rafael, San Mateo), Mt Diablo, Mt Tam and the Santa Cruz mountains.<span style="mso-spacerun: yes;"> </span>You can see the Marin Headlines, Angel Island and Alcatraz. If it’s clear enough, you can see the Farallons to the west and ocean freighters steaming their way to China. As the sun descends a thousand windows in the East Bay briefly flame red with reflected light.<span style="mso-spacerun: yes;"> </span>Just after sunset pearls of light appear on the bridges outlining traffic streaming in and out of San Francisco.</div><div class="MsoNormal" style="text-align: justify;"><br /></div><div class="MsoNormal" style="text-align: justify;">You can see:</div><div class="separator" style="clear: both; text-align: center;"><a href="http://4.bp.blogspot.com/-3C1ry8aoZbA..." imageanchor="1" style="margin-left: 1em; margin-right: 1em;"><img border="0" height="225" src="http://4.bp.blogspot.com/-3C1ry8aoZbA..." width="400" /></a></div><div class="MsoNormal" style="text-align: justify;"> Or this:</div><div class="separator" style="clear: both; text-align: center;"><a href="http://4.bp.blogspot.com/-zDB_x2eDyh0..." imageanchor="1" style="margin-left: 1em; margin-right: 1em;"><img border="0" height="263" src="http://4.bp.blogspot.com/-zDB_x2eDyh0..." width="400" /></a></div><div class="MsoNormal" style="text-align: justify;">Or this:</div><div class="separator" style="clear: both; text-align: center;"><a href="http://1.bp.blogspot.com/-MM9lNKIWmLo..." imageanchor="1" style="margin-left: 1em; margin-right: 1em;"><img border="0" height="223" src="http://1.bp.blogspot.com/-MM9lNKIWmLo..." width="400" /></a></div><div class="MsoNormal" style="text-align: justify;"> </div><div class="MsoNormal" style="text-align: justify;">Be warned:<span style="mso-spacerun: yes;"> </span>it’s usually windy up here. Proper attire for this walk consists of multiple layers that you can zip and unzip as you warm up or hit windchill. This is a fabulous place for sunsets but the wood tie stairs are not lit, so either bring a flashlight or leave before deep darkness descends.<span style="mso-spacerun: yes;"> </span>The rest of the way down is quite well lit—even the pedestrian overpass has decent lighting.<span style="mso-spacerun: yes;"> </span></div><div class="MsoNormal"><br /></div><div class="MsoNormal" style="text-align: justify;">It doesn’t have to be a brilliantly clear day to make the walk worthwhile.<span style="mso-spacerun: yes;"> </span>I’ve gone up half an hour before sunset as the front arms of a storm system moved into the Bay, and then watched the city and lower sky turn shell pink with massive grey clouds lurking above. Fabulous.</div><div class="MsoNormal"><br /></div><table cellpadding="0" cellspacing="0" class="tr-caption-container" style="float: right; margin-left: 1em; text-align: right;"><tbody><tr><td style="text-align: center;"><a href="http://1.bp.blogspot.com/-BzmGdriwTcY..." imageanchor="1" style="clear: right; margin-bottom: 1em; margin-left: auto; margin-right: auto;"><img border="0" src="http://1.bp.blogspot.com/-BzmGdriwTcY..." /></a></td></tr><tr><td class="tr-caption" style="text-align: center;"><span style="font-family: Cambria;">Mission Blue wonder</span></td></tr></tbody></table><div class="MsoNormal" style="text-align: justify;">And there are other reasons to make the climb. Here, away from cars, city noise and city smells, you have as much as chance as anywhere in San Francisco to be in contact with the indigenous natural world of this tip of peninsula. The air is fresh, and if there are not too many people around, you’ll see and hear many different kinds of birds flitting among the hillside sage and lupine. One of Twin Peaks’ claim to fame is that it is home to the endangered Mission Blue butterfly. In fact, Twin Peaks is one of only five places in the world where the Mission Blue butterfly is known to still exist. Evidently Mission Blue butterflies are considered quite gorgeous by butterfly connoisseurs. Though I have yet to see one (having only recently become a regular visitor to Twin Peaks), since they are most likely espied between March and June I may succeed in the upcoming months.</div><div class="MsoNormal"><br /></div><div class="separator" style="clear: both; text-align: center;"><a href="http://4.bp.blogspot.com/-snKPfmOsjio..." imageanchor="1" style="clear: left; float: left; margin-bottom: 1em; margin-right: 1em;"><img border="0" height="320" src="http://4.bp.blogspot.com/-snKPfmOsjio..." width="211" /></a></div><div style="text-align: justify;"><span style="font-family: Cambria; font-size: 12.0pt; mso-ansi-language: EN-US; mso-ascii-theme-font: minor-latin; mso-bidi-font-family: "Times New Roman"; mso-bidi-language: AR-SA; mso-bidi-theme-font: minor-bidi; mso-fareast-font-family: "MS 明朝"; mso-fareast-language: EN-US; mso-fareast-theme-font: minor-fareast; mso-hansi-theme-font: minor-latin;">On your way down, if you want a real “get away from it all in the heart of the city” experience you can connect up with the <a href="http://www.ucsf.edu/about/cgr/current..." target="_blank">Mt. Sutro Open Space Reserve</a> to the north where you can hike three or four miles through woodlands so dense only the distant roar of street noise let’s you know you’re still in a city. Or you can go down the way you came up. After you’ve crossed the pedestrian bridge on Romain, the shops and restaurants of Noe Valley lie ten to twelve minutes to your right and the shops and restaurants of the Castro await you ten to twelve minutes to your left. Since you have just conquered Twin Peaks on your own power and stood on the rooftop of San Francisco--an ascent you share with the ancients since humanity first arrived on these shores--you have well-earned the rosy glow of satisfaction and exhilarating memories of adventure that are now yours.</span></div><div style="text-align: justify;"></div><div style="text-align: justify;"><a href="http://goo.gl/maps/KVAav" target="_blank"><span style="font-family: Cambria; font-size: 12.0pt; mso-ansi-language: EN-US; mso-ascii-theme-font: minor-latin; mso-bidi-font-family: "Times New Roman"; mso-bidi-language: AR-SA; mso-bidi-theme-font: minor-bidi; mso-fareast-font-family: "MS 明朝"; mso-fareast-language: EN-US; mso-fareast-theme-font: minor-fareast; mso-hansi-theme-font: minor-latin;">Link to Google Map of route</span></a></div>
December 18, 2012
The Nine Best-Run Countries in the World, What They Have in Common, and What They Have to Teach the U.S.
 How to be among the best?
For much of the twentieth century the United States could, quite factually, consider itself the most prosperous nation on earth. This, however, is no longer the case. While the US is not doing terribly, nine countries scattered over three continents are outperforming us along a wide variety of spectra. The nations in this “best-run” club all have higher levels of wealth, health and quality of life than the U.S. Though it’s hard to say definitively why they are healthy, wealthy and living so well, their public policy choices and infrastructure investments diverge significantly from ours. As we dig into their stats, we’ll see they share many traits in common.
Compared to the US, these nine countries are more egalitarian and less murderous. Per capita, they imprison far fewer people, and far fewer of their citizens die in road accidents. Their governments are less corrupt. Their cities are the greenest in the world and offer their residents advanced infrastructure, low crime rates, and high levels of security and stability. Each country as a whole saves more and has less debt per capita than the US. The populations of these countries own fewer cars than their US counterparts, and the ones they have they drive less. They take trains and transit, walk and bike at greater levels, and they spend less of their income on transportation as a household expense. These countries spend far less on their militaries and on health care than we do, but they spend far more at the pump for a gallon of gasoline. And all but one country achieve their high quality of life with less CO2 emissions per person than the US—many with less than half as much.
One might wonder if these countries are just as urban as ours? The answer is yes. Perhaps they are more homogenous and don’t have the challenges of assimilating immigrant populations? The answer is four have a higher percentage of immigrants than the US, one has comparable, and four have a lower percentage. Over half of these countries have vast, sparsely populated portions of countryside like we do. Four have rich mineral resources like the US does; five have almost none. Four are net energy exporters; five are net energy importers like the US. All but two have their own currency like the US does. All are democracies.
Who are these paragons of good national management? Norway, Switzerland, Australia, Sweden, Denmark, Finland, Netherlands, Austria and Canada. Let’s look closer at some of the surprising statistics that help us understand why and how these countries are doing so well.
Wealth
 These nine countries are in the very top tier of GDP per capita in the world. All have greater GDP per person than the US. More importantly, all have higher GDP per capita after subtracting off their government deficit.
  And all nine have high gross savings as a percent of GDP. As nations they consume smaller portions of what they earn. All except Austria and Finland ran trade surpluses in 2011. (In 2011, the US ran the greatest trade deficit in the world.)
  These countries are more egalitarian in wealth distribution. Their GINI coefficients (which measure how far from the center income is distributed) are all substantially lower than that of the U.S. This means there are fewer really poor people, fewer really rich people, and a lot more in the middle. (The US GINI is so high that our peers in inequality are Cameroon, Uruguay and Jamaica.)
 These nine best-run countries also have more social mobility than the US as measured by how much one’s parents’ income predicts one’s own. The result is all nine countries are easier places to pull yourself up by your own bootstraps. And these nine countries aren’t over-regulated or hostile to business. Seven of the countries rank among the top 15 nations in the world for ease of doing business.
GovernmentThese nine countries have less government debt as a percent of GDP and they run substantially less annual deficits as a percent of GDP. Or, in the cases of Norway, Sweden and Switzerland, they run no deficits at all. In terms of national credit ratings tabulated by the World Economic Forum they rank 1, 2, 3, 4, 5, 8, 10, 12 and 13.(The US is number 11.) The same forum ranks these countries much higher than the US for protection of property, intellectual property protection, judicial independence, less favoritism in decisions of government officials, and less wasteful government spending.
 These nine countries also have more efficient legal frameworks for settling disputes, their government policy-making is more transparent, and, according to the Corruption Index, they are among the least corrupt governments in the world. The US, though certainly not the worst on the corruption measure, doesn’t even rank as first tier.
 In the Worldwide Governance Project rankings, these nine countries stood out as the most well-governed with the highest marks in the world (all higher than the US) for control of corruption, rule of law, regulatory quality, government effectiveness, political stability, absence of violence/terrorism, and voice and accountability (a measure of political participation, freedom of association, freedom of expression and a free media.)
 These nine countries all have a higher percentage of women elected to their main parliament or Congress, 25% - 45% versus the US rate of 18%. (More women = better governance? Just saying . . .) They also all have smaller parliamentary bodies (perhaps smaller = better functioning?) and each parliamentary member represents many fewer citizens (perhaps giving each individual citizen more influence and say in the political process?)
In the World Economic Council’s assessment of infrastructure, seven of the nine countries ranked higher than the US. The rankings were: Switzerland (1), Finland (3), Austria (8), Netherlands (10), Denmark (13), Canada (15), Sweden (19), Australia (36) and Norway (39). The US came in number 25. All nine countries ranked higher than the US in quality of electrical supply.
 The nine best-run countries all offer more weeks of paid maternity leave. (The US offers none.) In eight of these countries workers routinely get 1-4 weeks more vacation, all mandated by government policy. (The US has no legal vacation minimums.)
These nine countries all allocate substantially more of their annual GDP in aid to foreign countries.
MilitaryAs a percentage of their GDPs, these countries spend 1/5th to 2/5ths of what the US does. (The US spends more on its military than all other countries of the world combined.) None of these countries possess nuclear weapons. The nine countries ranked high (2, 4, 6, 9, 10, 14, 18, 22 and 28) out of 158 countries on the Global Peace Index. (The US ranked 88.) The index includes measures of internal and external stability, security and conflict.
 HealthThis is an area where the well-run nine run circles around the US. They spend oodles less on health care, both per capita and as a percent of GDP. And, to top it off, their results are better! First off, they have longer life expectancies. More importantly, they also have longer expected years of healthy life. (Which is the point of health care, right?)
 They all have lower infant mortality rates. In addition, they have lower rates of obesity and diabetes, lower rates of heart disease. Most have lower rates of asthma and lung diseases of all kinds (7 countries out of 9) and alzheimers/dementia (8 out of 9). Their citizens are less likely to die from drug use, kidney disease, leukemia or birth trauma. The US cancer death rate is about average--four countries die from cancer at a lower rate than the US, five die at a higher rate. All nine countries have more practicing doctors per 1000 population than the US.
  And then there’s lifestyle impacts on health costs. Smoking and drinking don’t seem to be responsible for inflating our health care costs. Six of these countries drink more alcohol per person than we do, seven of these countries smoke more than we do. But the citizens of these countries do consume far less high fructose corn syrup per person. The US consumes 55lbs of the stuff per person per year!
In these countries people eat less meat, especially (except for Australia) beef. Their many fewer road accidents help keep health care costs down as well. (AAA estimates the costs of road accidents in the US to be $300 billion annually, or $955 per person.)
Other factors contributing to high US health care costs are that the US has the highest rate of CT scans, MRI exams, prescription drug use, prescription drug prices, and prescription drug spending. (Over 50% of Americans take at least one prescription drug each day. 25% of US adults take four or more different prescription drugs each day!) Not all of these nine countries have single payer health care but in none of these countries is healthcare tied in any way to employment.
Crime
 These nine countries imprison fewer people and have much lower murder rates. However, to be fair, the US is third in the world on the “Do you feel safe walking at night?” statistic. (Just behind Sweden and Canada, just ahead of Denmark, Finland and the Netherlands.) None of the nine have capital punishment.
 According to the World Economic Forum, organized crime imposes much less toll on businesses in these countries. The US ranks 87 out of 144 countries on this measure, while our nine best-run countries rank 4, 12, 14, 19, 21, 22, 28, 30, and 44. On reliability of police services, they rank 1, 2, 6, 7, 8, 12, 13, 17, 18 while the US ranks 30th. On ethical behavior of firms they rank 2, 4, 5, 6, 7, 8, 9, 11, and 18 while the US ranks 29th. On auditing and reporting standards they rank 2, 6, 7, 8, 11, 12, 18, 23 and 33 while the US ranks 37th.
Transportation
 All but Canada have stricter blood alcohol levels legal for driving (US and Canada--.8, Finland, Austria, Switzerland, Netherlands, Australia--.5; Sweden and Norway--.2) All but Canada use less oil per person—five (Sweden, Denmark, Switzerland, Finland and Austria) consume approximately half the oil per person as the US. Gas pump price per gallon in these countries averages $7.59, more than twice the US price ($3.75.) (Note: highest gas price is in Norway, a net oil exporter.)
  People in these nine countries have many fewer cars per capita. They travel many more miles by train.
 All nine nations have auto fatality rates that are a third to two-thirds of ours. Their pedestrian fatality rates per capita are, on average, half of ours, even though they do double the walking.
CitiesThese nine countries have cities with the highest quality of living in the world as calculated by the Mercer Index (2012)—they fill 5 of the top ten spots, and 16 of the top 35 spots: Vienna, Austria (1), Zurich, Switzerland (2), Vancouver, Canada (5), Geneva, Switzerland (8), Copenhagen, Denmark (9), Bern, Switzerland (10), Sydney, Australia (11), Amsterdam, Netherlands (12), Ottawa, Canada (14), Toronto, Canada (15), Melbourne, Australia (17), Stockholm, Sweden (19), Perth, Australia. (21) Montreal, Canada (23), Helsinki, Finland (32), Oslo, Norway (32). The only US cities that rank in the top 35 are Honolulu (28) and San Francisco (29), and Boston (35).
These countries have the greenest cities in the world. The Siemens Green City Index rates cities based on their environmental performance and impact. Copenhagen had the highest rating in the world with (87.31) The other top city ratings were Stockholm (86.65), Oslo(83.98), Vienna (83.34), Amsterdam (83.03), Zurich (82.31,) Vancouver (81.30), Helsinki (79.29). US cities with the highest ratings were San Francisco (83.80), New York (79.20), Seattle (79.10) (Australian cities were not evaluated.)
Energy
 Energy is a complex topic. Consumption and production patterns are influenced by each country’s mineral and hydroelectric resources as well as by their investment in various forms of energy-producing infrastructure. In the coming decades energy use will have an enormous impact on every country’s prosperity. Four of the nine countries (Norway, Denmark, Canada and Australia) are net energy exporters. Five are net energy importers like the US. Two of them (Austria and Finland) import close to two-thirds of the energy they consume.
  All the countries but Norway and Canada use less total energy per person than the US (some half as much) and all use less energy for transportation. Except for Australia, they all emit less CO2 per person (some half as much).
  Sweden, Denmark and Canada in particular have made greater investments in installed solar and wind capacity per capita than the US, and the Netherlands and Austria are catching up.
 In general the more coal consumed, the greater the CO2 emissions. Oil consumption also has a large impact on CO2 emissions; natural gas has less. Not surprisingly the nations that are extremely energy efficient with extensive transit and train systems tend to have the lowest CO2 emissions. (Note: TOE stands for Tons of Oil Equivalent, a way to compare different sources of energy.)
HappinessSo what in the end is a point of a government, the point of a country, if not the happiness and life satisfaction of its citizens? In the World Happiness Report produced by the Earth Institute of Columbia University, happiness and life satisfaction levels are assessed through a number of different evaluation measures. Living standards and income undoubtedly contribute to happiness but so do a person’s health (physical and mental), education, values held (such as the level of materialism or altruism), job security, meaningful work, social connections and social engagement. Or, on a more macro level, good governance, freedom (ability of citizens to choose the course of their own lives,) levels of trust in society, and levels of social mobility. (Spiritual connection/spiritual meaning and/or connection with the natural world also come into play.) On happiness/life satisfaction scales we see Denmark (1), Finland (2), Norway (3), Netherlands (4), Canada (5), Switzerland (6), Sweden (7), Australia (9), and Austria (13) out of 150 countries, with the US coming in at (11).
What Does All This Tell Us? Now correlation is not causation. And there are so many factors at work here it’s hard to pin down what might be cause and what might be effect. But it's pretty clear that low corruption is a prerequisite for good governance. It’s pretty clear that low CO2 emissions require reduced burning of fossil fuels. It’s pretty clear that electricity via sources other than coal and transportation via methods other than private auto result in less burning of fossil fuels. It’s pretty clear if a nation puts a disproportionate portion of its wealth towards its military and poorly-run health care system, it will have little money to put towards infrastructure such as transit, trains or renewable energy.
If we could achieve the energy efficiency of Denmark, the transportation efficiency of Sweden, the walking and biking rates of the Netherlands, the lack of government corruption of Finland, the oil consumption and transit use rates of Austria, the rail travel rates of Switzerland, the low healthcare costs and high healthy life expectancy of Australia, the low coal use of Norway, and Canada’s level of military expenditure, the US would be in extremely good shape. We could stop burning coal, end fracking, end foreign oil imports and be entirely energy self-sufficient. Our health care and energy costs would drop dramatically, as would our trade deficit. With reduced expenditure on the military, it’s even possible our national deficit would disappear. Our population would be happier, healthier, live longer, and enjoy a higher quality of life.
To go further, if the US wants to be among the most prosperous nations on earth, we need to encourage active forms of transportation for short trips, develop transit and rail systems for longer trips, reduce income inequality and corruption, become highly energy-efficient, reduce military expenditures to 1.5% of GDP, and reduce health care expenditures to 11% of GDP. This appears to me to be the lesson of our nine best-run countries.
Sources of data: OECD library, UN Data, BP Statistical Review of World Energy 2012, IEA Statistics 2012, EIA, CIA World Factbook, IRTAD Road Safety Annual Report 2011, Mercer Quality of Living Rankings 2012, World Happiness Report, Journal of Physical Activity and Health, Bicycling and Walking in the United States 2012 Benchmarking Report, EU Transport in Figures Statistical Pocketbook 2012, EU EDGAR data, World Economic Forum, International Transport Forum, Human Development Report 2007/2008, Global Competivenss Report 2012/2013, Renewables 2012 Global Status Report, Global Peace Index, Trends in Global CO2 emissions 2012 Report, Corruption Perception Index, The Economist, Siemens Green City Index.
December 5, 2012
My Car-free Excursion to Ikea
 My Ikea Haul
<!-- /* Font Definitions */ @font-face {font-family:"MS 明朝"; mso-font-charset:78; mso-generic-font-family:auto; mso-font-pitch:variable; mso-font-signature:1 134676480 16 0 131072 0;} @font-face {font-family:"MS 明朝"; mso-font-charset:78; mso-generic-font-family:auto; mso-font-pitch:variable; mso-font-signature:1 134676480 16 0 131072 0;} @font-face {font-family:Cambria; panose-1:2 4 5 3 5 4 6 3 2 4; mso-font-charset:0; mso-generic-font-family:auto; mso-font-pitch:variable; mso-font-signature:-536870145 1073743103 0 0 415 0;} /* Style Definitions */ p.MsoNormal, li.MsoNormal, div.MsoNormal {mso-style-unhide:no; mso-style-qformat:yes; mso-style-parent:""; margin:0in; margin-bottom:.0001pt; mso-pagination:widow-orphan; font-size:12.0pt; font-family:Cambria; mso-ascii-font-family:Cambria; mso-ascii-theme-font:minor-latin; mso-fareast-font-family:"MS 明朝"; mso-fareast-theme-font:minor-fareast; mso-hansi-font-family:Cambria; mso-hansi-theme-font:minor-latin; mso-bidi-font-family:"Times New Roman"; mso-bidi-theme-font:minor-bidi;} .MsoChpDefault {mso-style-type:export-only; mso-default-props:yes; font-family:Cambria; mso-ascii-font-family:Cambria; mso-ascii-theme-font:minor-latin; mso-fareast-font-family:"MS 明朝"; mso-fareast-theme-font:minor-fareast; mso-hansi-font-family:Cambria; mso-hansi-theme-font:minor-latin; mso-bidi-font-family:"Times New Roman"; mso-bidi-theme-font:minor-bidi;} @page WordSection1 {size:8.5in 11.0in; margin:1.0in 1.25in 1.0in 1.25in; mso-header-margin:.5in; mso-footer-margin:.5in; mso-paper-source:0;} div.WordSection1 {page:WordSection1;} </style>--> <br /><div class="MsoNormal" style="text-align: justify;">As a kind of hobby, I’ve been going to places further from home and more logistically challenging without a car lately, places to which I formerly would've driven. On Monday of this week I tackled the Emeryville Ikea store.</div><div class="MsoNormal"><br /></div><div class="MsoNormal" style="text-align: justify;">After evaluating my route judiciously, I decided to walk to the Mission 24<sup>th</sup> St BART station, take BART to the Oakland MacArthur Station, and then take the Emery-Go-Round bus to the Ikea/Bay Street bus stop. I thought long and hard about taking my bike on BART but I didn’t do so due to my lack of familiarity with the route and my uncertainty about the bicycle infrastructure on the Oakland side of things. In retrospect, I think I made the right choice.</div><div class="MsoNormal"><br /></div><div class="MsoNormal" style="text-align: justify;">I live a bit over a mile from BART, a 20 – 25 minute walk going there and a 30 minute walk (all up hill) going home. I wish I lived closer. In the coming decade, people who live a ten-minute walk or less from BART are going to be very, very happy about this because BART has the greatest reach of any public transit system in the Bay Area. Because Muni from my house to BART requires two buses and a transfer, that option can take any where from 13 minutes (a miracle of bus coordination) to 40 minutes. Plus it costs $2 each way. I am far too cheap to pay $2 to avoid a mile walk.</div><div class="MsoNormal"><br /></div><div class="MsoNormal" style="text-align: justify;">When going to the airport, I have come to appreciate the walk to BART as a feature, not a bug, of the experience because on days of plane travel it is likely the only exercise I will get.<span style="mso-spacerun: yes;"> </span>And on my trip to Ikea, walking there was fine. Walking home with two full bags of stuff was a little more tiring.</div><div class="MsoNormal"><br /></div><table cellpadding="0" cellspacing="0" class="tr-caption-container" style="float: left; margin-right: 1em; text-align: left;"><tbody><tr><td style="text-align: center;"><a href="http://2.bp.blogspot.com/-Au2ehIBsFas..." imageanchor="1" style="clear: left; margin-bottom: 1em; margin-left: auto; margin-right: auto;"><img border="0" height="240" src="http://2.bp.blogspot.com/-Au2ehIBsFas..." width="320" /></a></td></tr><tr><td class="tr-caption" style="text-align: center;">As good as it ever looks</td><td class="tr-caption" style="text-align: center;"><br /></td></tr></tbody></table><div class="MsoNormal" style="text-align: justify;">Now to the BART experience. First off, whoever designed the 24<sup>th</sup> St and 16<sup>th</sup> Street BART entrance plazas must deeply hate human beings. That’s the only explanation I can muster for the sheer hostility of those places both visually and as a site of human congregation. Once you descend into the BART Station, it’s not so bad.<span style="mso-spacerun: yes;"> </span>I eyed the bikes parked inside the station because I had thought a lot about leaving my bike there but had been concerned about the security.<span style="mso-spacerun: yes;"> </span>I noticed the bikes were, in general, not fancy bikes, and were by and large extremely well locked up, usually with more than one kind of lock. This did not allay my fears.</div><div class="MsoNormal"><br /></div><table cellpadding="0" cellspacing="0" class="tr-caption-container" style="float: right; margin-left: 1em; text-align: right;"><tbody><tr><td style="text-align: center;"><a href="http://2.bp.blogspot.com/-XB-OLTdswbc..." imageanchor="1" style="clear: right; margin-bottom: 1em; margin-left: auto; margin-right: auto;"><img border="0" src="http://2.bp.blogspot.com/-XB-OLTdswbc..." /></a></td></tr><tr><td class="tr-caption" style="text-align: center;"><span style="font-family: Cambria;">Pleasant enough inside the station</span></td></tr></tbody></table><div class="MsoNormal" style="text-align: justify;">I had to wait 10 minutes for a train to MacArthur Station. The announced train schedule that flashes up on the board, while usually reliable, wasn’t this time because a train from Fremont curiously decided to go no further than 24<sup>th</sup> Street, offloaded its passengers, and then took on passengers back to Fremont. This held up my my train which was waiting down the tunnel (you could see its headlight.)</div><div class="MsoNormal"><br /></div><div class="MsoNormal" style="text-align: justify;">The train was reasonably full and got more so once we hit the first East Bay stop.<span style="mso-spacerun: yes;"> </span>Still, BART is roomy, and this makes it a particularly pleasant form of transportation. In Oakland I noticed a number of women get on with large wire handcarts, good for shopping.<span style="mso-spacerun: yes;"> </span>(They could probably carry 5 or 6 bags of groceries in terms of volume, though not, perhaps, in terms of weight.) <span style="mso-spacerun: yes;"> </span>I began to regret not bringing my own smaller wire handcart, but as it turns out it would’ve been a horror story to bring it, fully loaded, on the Emery-Go-Round.</div><div class="MsoNormal"><br /></div><table cellpadding="0" cellspacing="0" class="tr-caption-container" style="float: left; margin-right: 1em; text-align: left;"><tbody><tr><td style="text-align: center;"><a href="http://3.bp.blogspot.com/-GVZ9V9cGiNQ..." imageanchor="1" style="clear: left; margin-bottom: 1em; margin-left: auto; margin-right: auto;"><img border="0" src="http://3.bp.blogspot.com/-GVZ9V9cGiNQ..." /></a></td></tr><tr><td class="tr-caption" style="text-align: center;">Pleasant or ride from hell?</td></tr></tbody></table><div class="MsoNormal" style="text-align: justify;">I was a little anxious where to find the Emery-Go-Round when I got off at MacArthur, and indeed, there was no sign indicating where along the long platform it would stop, but luckily there was already one there, engine idling, going in the direction I wanted to go. Hooray! I quickly got on board and then proceeded to wait seven minutes (engine running the whole time) before the driver also boarded and closed the doors.<span style="mso-spacerun: yes;"> </span>The bus seats were 80% full, but it was roomy enough.<span style="mso-spacerun: yes;"> </span>The Emery-Go-Round is free!<span style="mso-spacerun: yes;"> </span>Being cheap, I appreciated this value as my round trip BART trip was costing me $7.20. It took about 8 minutes to go the 2.2 miles to Ikea.<span style="mso-spacerun: yes;"> </span>People got on and off at each stop but many got off at the Ikea/Bay Street stop.<span style="mso-spacerun: yes;"> </span>However, overhearing conversations, many of my fellow passengers appeared not to be shoppers but people who worked at the stores there.</div><div class="MsoNormal"><br /></div><div class="MsoNormal" style="text-align: justify;">I kept an eye on bicycle infrastructure as we went and did see some bike lanes and some sharrows.<span style="mso-spacerun: yes;"> </span>The bus only went over a portion of the route that Google Maps recommended if biking, so I don’t know what the infrastructure was like the entire way.<span style="mso-spacerun: yes;"> </span>I do know the last segment was a narrow bike lane along fast moving traffic.<span style="mso-spacerun: yes;"> </span>I also don’t know how rough and tumble the neighborhood is by the MacArthur BART station.<span style="mso-spacerun: yes;"></span>I saw a number of houses that looked abandoned with all the downstairs windows boarded up. I felt quite safe, however, on the bus. </div><div class="MsoNormal"><br /></div><div class="MsoNormal" style="text-align: justify;">For me, coming from out of town and not being familiar with the area, to use bicycle infrastructure successfully the infrastructure needs to be extremely idiot-proof. For example, there should be signs straight out of the BART station that say “This way to Ikea/Bay Street by bike.” There should be a cycle track completely separated from cars the entire way so that I don’t fear being run off the road on an unknown street by unknown ferocious traffic.<span style="mso-spacerun: yes;"> </span>Perhaps the cycle track even needs to be painted a different color the whole way so I will have certainty at all times I am going the right way.<span style="mso-spacerun: yes;"> And there should be pretty pictures of all this on some website, so when I am making up my mind on whether going by BART plus bicycle is right for me, I can make my choice with happy confidence. </span>This is what I recommend for at least these particular 2.2 miles to connect Ikea/Bay Street to BART by bicycle for out-of-town shoppers.</div><div class="MsoNormal"><br /></div><div class="MsoNormal" style="text-align: justify;">It was easy to know where to get off for the Ikea stop because I could see the store from the window.<span style="mso-spacerun: yes;"> </span>But once off the stop, I walked into the Bay Street pedestrian mall thinking that would be a pleasant way to walk to Ikea. Wrong. The only way to get from the Bay Street area to Ikea is either to walk through a dark parking garage or go back and walk along the busy main road. After spending five minutes figuring this out, I walked back to the main road and made my way to Ikea.<span style="mso-spacerun: yes;"> </span>To Ikea’s credit, once you get to their property there is a nice walking path separated from the cars.</div><div class="MsoNormal"><br /></div><div class="MsoNormal" style="text-align: justify;">Ikea’s layout is sprawling.<span style="mso-spacerun: yes;"></span>It was at least a four minute walk from the bus stop to the store entrance.<span style="mso-spacerun: yes;"> </span>All told, it took me an hour and twenty minutes to get from my house to the Ikea entrance.<span style="mso-spacerun: yes;"> </span>I spent 25 minutes in the store.<span style="mso-spacerun: yes;"> </span>A feature, not a bug, of not bringing a car to Ikea, is that you can only buy what you are willing to physically carry.<span style="mso-spacerun: yes;"> </span>This reduces impulse buying, a very good thing. (I still bought more than I intended and then cursed myself going home.)<span style="mso-spacerun: yes;"> </span>I brought two shopping bags with me with shoulder straps, each with the capacity to hold the equivalent of a stuffed paper grocery bag. They were both full when I left the checkout, one with somewhat fragile glass and metal tealight lanterns that I needed to get home in one piece.</div><div class="MsoNormal"><br /></div><div class="MsoNormal" style="text-align: justify;">Going home, I had the four minute walk to the bus stop.<span style="mso-spacerun: yes;"> </span>I arrived a little after 3pm. There were almost 20 people waiting at the stop!<span style="mso-spacerun: yes;"> </span>Very few shoppers, however, or at least few people who had bags of goods with them. I was very glad I had not chosen a rainy day for the trip as there was no shelter at the stop, no protection from sun, wind or rain. I was, however, able to sit. I waited close to ten minutes. When the bus finally came, it was quite large, perhaps 2/3 the size of a regular Muni bus.<span style="mso-spacerun: yes;"> </span>However, it only had one door.<span style="mso-spacerun: yes;"> </span>This was a big, big problem because the bus was very full, every seat occupied and all the floor space full of people standing.<span style="mso-spacerun: yes;"> </span>So every time the bus stopped, people wanting to get off had to claw their way to the front exit, climb down the steps, and then the people who wanted to get on could board.<span style="mso-spacerun: yes;"> </span>This was a slow, laborious process.<span style="mso-spacerun: yes;"> </span>In addition, with the bus so full, I had to sit with my packages precariously perched on my lap, and every time the bus lurched and threw the standing passengers around I prayed that no one would fall on me and crush my lanterns.<span style="mso-spacerun: yes;"> </span>This may seem like a silly anxiety, but if you are going to encourage people to take a bus shopping, the bus simply cannot be packed to the gills because it leaves no room for people’s purchases. If I (or several people) had with me a wire handcart full of things it would've made the congestion on that bus impassable.<span style="mso-spacerun: yes;"> </span>If part of the point of the Emery-Go-Round is to convey shoppers from BART to the Bay Street/Ikea stores, then they are shooting themselves in the foot to let the buses get so crowded.</div><div class="MsoNormal"><br /></div><div class="MsoNormal" style="text-align: justify;">The bus ride back was slow (15 agonizing minutes) and the lurching made me motion sick.<span style="mso-spacerun: yes;"> </span>This 2.2 mile stretch between BART and Ikea is flat, flat, flat. I could've covered it with ease in 12 minutes on a bike (with no wait time) and felt great the whole time. More than anything, I longed for a bikeshare bike with a big generous front basket (for my well-stuffed bags) and decent bicycle infrastructure on which to ride it. </div><div class="MsoNormal"><br /></div><div class="MsoNormal" style="text-align: justify;">I was lucky at BART to find a train ready to head to San Francisco.<span style="mso-spacerun: yes;"> </span>Clipper Card makes going through BART stations a breeze. I don’t understand why anyone would fool with buying BART cards this day and age. The train back to San Francisco was nearly empty, plenty of room for my packages. I was grateful, a bit tired, and enjoyed being able to relax and not feel crushed or motion sick.</div><div class="MsoNormal"><br /></div><div class="MsoNormal" style="text-align: justify;">Off at 24<sup>th</sup> street station and then the walk home. The load I was carrying slowed me considerably heading up hill, and it took me half an hour.<span style="mso-spacerun: yes;"> </span>I really, really would've loved my bike for this final stage of the trip.</div><div class="MsoNormal"><br /></div><div class="MsoNormal" style="text-align: justify;">All told, the entire adventure took me three hours and ten minutes and $7.20. Almost one hour of this was walking between my house and Bart. If I’d driven to Ikea, I don’t think I could’ve done the trip in under two hours. If I’d driven, I probably would’ve made sure I returned before carpool hours and so the Bay Bridge toll would only have been $4.00. In addition, I would’ve spent $2.50 on gas and another $1.17 on tires and maintenance (based on AAA estimates of these costs per mile.) So that comes to $7.67 total trip cost versus the $7.20 I spent. And I would’ve gotten very little exercise in the process and quite a bit of stress dealing with bridge traffic.</div><div class="MsoNormal"><br /></div><div class="MsoNormal" style="text-align: justify;">But what would have been even better? What method of getting to Ikea would have been quick and enjoyable and could very well exist with just a little tweaking of our present infrastructure? First, I would add a secure bike parking facility above ground at the Mission/24<sup>th</sup> street station.<span style="mso-spacerun: yes;"> </span>Carrying one’s bike up a flight of stairs along with two bags of shopping is just not doable.<span style="mso-spacerun: yes;"> </span>Even managing an elevator with a bike and two bags can be tricky. Plus, BART elevators often don’t work, and when they do, they are known for being icky, smelly and so slow they add ten minutes to your trip.</div><div class="MsoNormal" style="text-align: justify;"><span style="mso-spacerun: yes;"> </span></div><div class="MsoNormal" style="text-align: justify;">If I could’ve biked to and from the 24<sup>th</sup> St station, I would’ve saved 30 minutes of walking time. I would’ve been glad to pay $2 ($1 per hour) for no bike stair-climbing and complete bike peace-of-mind. In addition, a regional Bay Area bike share system with stations at MacArthur station and Bay Street/Ikea along with idiot-proof cycle ways (well marked, completely separated from cars) would have reduced my transit time on the other end from 45 minutes to 25 minutes.<span style="mso-spacerun: yes;"> </span></div><div class="MsoNormal"><br /></div><div class="MsoNormal" style="text-align: justify;">Just these two improvements would’ve reduced my total trip time by 50 minutes, down to 2 hours and 20 minutes, comparable to driving, parking and walking into the store.<span style="mso-spacerun: yes;"> </span>It would cost perhaps $2 more for the bike parking, (and perhaps $100/year for a bikeshare membership fee) but it would actually be a far more pleasant travel experience than either driving or riding crowded buses.<span style="mso-spacerun: yes;"> </span>And it would also be cheaper for society. Bikeshare systems generally operate without government subsidies, while the free Emery-Go-Round bus is completely subsidized by commercial and industrial property owners of Emeryville at $1.52 per passenger trip (2009 data.) (So I got $3.04 worth of free bus ride, even though it made me feel a bit sick. Thank you, Emeryville.) Cars are generally subsidized by society at $.39/mile (externalities such as pollution costs, accidents, road repair and maintenance not covered by gas tax monies, etc., but not including current and future costs of climate change) which means if I’d driven, my cost to taxpayers would've been $9.36.<span style="mso-spacerun: yes;"> </span>(One can argue that the Bay Bridge toll offsets some of this, but not much since bridge maintenance is far more costly than basic road maintenance.)</div><div class="MsoNormal"><br /></div><div class="MsoNormal" style="text-align: justify;">If we want to encourage people to reduce their driving and shop without cars, we need to make their experience pleasant and comparatively inexpensive.<span style="mso-spacerun: yes;"> </span>Bicycle infrastructure--such as easy, secure bike parking at BART stations, bikeshare bikes at BART stations, and entirely idiot-proof, extremely pleasant bikeways between BART stations and shopping districts--is an eminently cost-effective way to increase BART's utility to more people. </div><div class="blogger-post-footer"><img width='1' height='1' src='https://blogger.googleusercontent.com...' alt='' /></div>
November 7, 2012
Beaufort Skedaddle Day
(This post was originally published one year ago today on the 150th anniversary of the Great Beaufort Skedaddle.)
They were at church when the word came. In the pews of Saint Helena’s in Beaufort, South Carolina, master and slave alike heard that an enormous Yankee fleet was massing off Point Royal Sound a mere ten miles away. If Confederate defenses didn’t hold, the town would have to evacuate in a matter of hours. It was time to pack and to pray.
 View of Beaufort, Dec 1861
In 1861, Beaufort was one of the wealthiest, most cultured cities in America. The town boasted not only a library of three thousand volumes but also some of the most erudite, educated men in the South. Having built their elegant Greek Revival mansions with ballrooms, chandeliers and two-story piazzas, planter families gathered here each summer to escape the heat and ague of their Sea Island plantations, as well as socialize and talk politics. Secession politics. For more than a dozen years cries for secession had risen from Beaufort, much of them led by its native son, rabble-rousing, fire-eater Robert Barnwell Rhett, remembered as the “Father of Secession.”
The Confederacy knew full well that Port Royal might be a target for a Northern base, but they couldn’t be sure other sites weren’t also in the running and so were somewhat lackadaisical in establishing defenses for Port Royal Sound. During the summer of 1861, local plantations reluctantly provided slaves to begin construction of two forts to guard the Sound’s entrance: Fort Walker on Hilton Head Island and Fort Beauregard on Phillips Island. But not only were the forts still incomplete by November, the artillery installed fell far short of what was originally proposed and even farther short of what was needed when the Yankees came calling.
 Plans had been underway in the North to take a Southern port since early summer, with Lincoln himself involved in the selection. After all, to implement the “Anaconda Plan”—a tight blockade of the Southern coastline intended to cripple the Confederate economy—U.S. Navy warships needed a place to refuel with the coal that gave them power. Port Royal was one of the choicest deepwater ports on the Southern coast. That a massive Northern fleet was poised to sail was common knowledge to anyone who could read a newspaper once The New York Times published the details in the article, “The Great Naval Expedition,” on October 26th. The only unknown was the destination, a secret that, remarkably, was successfully kept. It wasn’t until they were at sea that the captain of each vessel opened a sealed envelope telling him where his ship was headed.
 The Great Naval Expedition en routeThe fleet that set out on Oct 29thwould prove to be the largest U.S. naval and amphibious expedition in the entire nineteenth century. It included 17 warships, 25 colliers, 33 transports, 12,000 infantry, 600 marines, and 157 big guns. Port Royal, with its two cobbled-together forts supplied with only 2500 men, 4 gunboats, and 39 guns between them, didn’t stand a chance.
 Bombardment of Port RoyalNature came to the South’s aid in the form of a storm that sank some of the Northern fleet along the way, and then rough water delayed the day of the final attack. But when November 7thdawned clear and calm, the water so still it was glassy, enough of the North’s warships were available to commence battle. Union ships concentrated their enfilade on Fort Walker. To the soldiers inside, the sound of artillery was deafening. By noon, only three of Fort Walker’s water battery guns were still operational; by 2:30 p.m., all powder was gone. The time had come to abandon the fort. The command at Fort Beauregard, concerned about being trapped on Phillips Island with no line of retreat, quickly followed suit. Thankfully, casualties on both sides were light. Accounts vary, but the Confederates finished the day with between 11 and 59 killed and an equivalent number wounded or missing, while the Union fleet saw 8 dead and 23 wounded.
Even with the enormous attacking naval force, Sea Island planters had been so confident in the defending forts manned with recruits from their very own Beaufort Volunteer Artillery that many watched the battle from shore on nearby Saint Helena Island. But when Confederate cannons grew silent and cheers reverberated from the Northern ships, they knew something had gone dreadfully wrong. They hurried home to evacuate, no doubt pained to leave bolls of valuable Sea Island cotton still unpicked in the fields.
When news of the battle’s outcome reached Beaufort, a kind of panic ensued. Facing an invading army of Yankees was too dreadful to contemplate; flight was of the essence. But what to take, what to leave behind? The daguerreotypes? The silver? Of course the family bible must be packed. Some loaded up carriages, hoping to stay ahead of the Yankees on the long overland route to safety. But Beaufort was lucky that day—there was a steamer anchored in the river that could take hundreds swiftly to Charleston. However, it had only so much room. Furniture, clothing, horses, and the vast majority of their most valuable property—slaves—would have to be left behind. In the tumult, even food and dinner dishes were abandoned on dining room tables, testament to the haste involved. That evening the steamer departed overflowing with Beaufort’s white citizenry along with every jewel and sentimental item they could squeeze on board. Legend has it that when Yankee forces arrived two days later to occupy the town, they found just one white man remaining in Beaufort, and he was dead drunk.
What must the deserted slaves, who spoke Gullah, their own Sea Island patois, have thought as the laden steamer chugged away from Beaufort’s dock? Did they realize that history had unexpectedly turned a corner right in front of them, and that now, after centuries of captivity as a people, they were suddenly free? Perhaps the political ramifications didn’t sink in that night, but before the first Yankees arrived, clothing and other finery had been looted (liberated?) from the grand homes, and food and liquor thoroughly consumed in an understandable celebration of events.
 Five generations now free (1862)It is estimated 8-10,000 slaves were left behind in the Sea Islands when the white population fled. They were soon joined by thousands of others who escaped to the region once they realized that Northern occupation meant freedom. They all needed food and shelter, and since the Emancipation Proclamation had yet to happen, their legal status, beyond being “contraband,” was unclear. The Army asked for help and received it in the form of the Port Royal Experiment. Financed and organized by Northern abolitionist charities, the Experiment worked as a test case to create self-sufficiency among the former slaves. Its success points to what Reconstruction might have been if less corruption and more competence had been at its helm. Northern missionaries and teachers flocked to the Sea Islands to create schools and aid societies. Former slaves were allowed to farm the confiscated plantations and were paid $1 per 400 lbs of cotton they were able to harvest. The Penn School on St. Helena Island was one of the earliest schools established for freed slaves and can be visited as part of the Penn Center today.
 Yankees at home on a Beaufort piazza (1862)The Union Army found Beaufort a pleasant setting for officer’s quarters, administrative offices and hospitals. Because the Army occupied Beaufort until the end of the war, the fine mansions, while suffering damage, were not burned to the ground like so many other Southern towns and surrounding Sea Island plantations. To this day Beaufort’s centuries-old live oaks and antebellum charm remain. Port Royal turned out to be as advantageous a harbor as the Union had hoped and did much to strengthen the potency of the blockade. After the war, most planter families—their sons dead, their plantations burnt, their Beaufort homes sold in government auctions for back taxes (often without their knowledge)—never returned. The civilization that was antebellum Beaufort vanished into the night with that last steamer.
It is rare that the wheel of fortune spins as violently as it did on November 7, 1861. The town that had advocated so fiercely for secession was the first to feel the brunt of an occupying army. A people remarkable for their wealth lost almost everything in a matter of hours. A region that so defiantly insisted that its way of life—slavery—was non-negotiable ended up being the first to have a colony of former slaves experiment with what it meant to be free. The Great Skedaddle indeed.
Photos above are from (in order): Library of Congress, Library of Congress, Harper's Weekly 11/9/1861, Harper's Weekly 11/30/1861, Library of Congress, Library of Congress.

They were at church when the word came. In the pews of Saint Helena’s in Beaufort, South Carolina, master and slave alike heard that an enormous Yankee fleet was massing off Point Royal Sound a mere ten miles away. If Confederate defenses didn’t hold, the town would have to evacuate in a matter of hours. It was time to pack and to pray.
 View of Beaufort, Dec 1861
In 1861, Beaufort was one of the wealthiest, most cultured cities in America. The town boasted not only a library of three thousand volumes but also some of the most erudite, educated men in the South. Having built their elegant Greek Revival mansions with ballrooms, chandeliers and two-story piazzas, planter families gathered here each summer to escape the heat and ague of their Sea Island plantations, as well as socialize and talk politics. Secession politics. For more than a dozen years cries for secession had risen from Beaufort, much of them led by its native son, rabble-rousing, fire-eater Robert Barnwell Rhett, remembered as the “Father of Secession.”
The Confederacy knew full well that Port Royal might be a target for a Northern base, but they couldn’t be sure other sites weren’t also in the running and so were somewhat lackadaisical in establishing defenses for Port Royal Sound. During the summer of 1861, local plantations reluctantly provided slaves to begin construction of two forts to guard the Sound’s entrance: Fort Walker on Hilton Head Island and Fort Beauregard on Phillips Island. But not only were the forts still incomplete by November, the artillery installed fell far short of what was originally proposed and even farther short of what was needed when the Yankees came calling.
 Plans had been underway in the North to take a Southern port since early summer, with Lincoln himself involved in the selection. After all, to implement the “Anaconda Plan”—a tight blockade of the Southern coastline intended to cripple the Confederate economy—U.S. Navy warships needed a place to refuel with the coal that gave them power. Port Royal was one of the choicest deepwater ports on the Southern coast. That a massive Northern fleet was poised to sail was common knowledge to anyone who could read a newspaper once The New York Times published the details in the article, “The Great Naval Expedition,” on October 26th. The only unknown was the destination, a secret that, remarkably, was successfully kept. It wasn’t until they were at sea that the captain of each vessel opened a sealed envelope telling him where his ship was headed.
  The Great Naval Expedition en routeThe fleet that set out on Oct 29thwould prove to be the largest U.S. naval and amphibious expedition in the entire nineteenth century. It included 17 warships, 25 colliers, 33 transports, 12,000 infantry, 600 marines, and 157 big guns. Port Royal, with its two cobbled-together forts supplied with only 2500 men, 4 gunboats, and 39 guns between them, didn’t stand a chance.
  Bombardment of Port RoyalNature came to the South’s aid in the form of a storm that sank some of the Northern fleet along the way, and then rough water delayed the day of the final attack. But when November 7thdawned clear and calm, the water so still it was glassy, enough of the North’s warships were available to commence battle. Union ships concentrated their enfilade on Fort Walker. To the soldiers inside, the sound of artillery was deafening. By noon, only three of Fort Walker’s water battery guns were still operational; by 2:30 p.m., all powder was gone. The time had come to abandon the fort. The command at Fort Beauregard, concerned about being trapped on Phillips Island with no line of retreat, quickly followed suit. Thankfully, casualties on both sides were light. Accounts vary, but the Confederates finished the day with between 11 and 59 killed and an equivalent number wounded or missing, while the Union fleet saw 8 dead and 23 wounded.
Even with the enormous attacking naval force, Sea Island planters had been so confident in the defending forts manned with recruits from their very own Beaufort Volunteer Artillery that many watched the battle from shore on nearby Saint Helena Island. But when Confederate cannons grew silent and cheers reverberated from the Northern ships, they knew something had gone dreadfully wrong. They hurried home to evacuate, no doubt pained to leave bolls of valuable Sea Island cotton still unpicked in the fields.
When news of the battle’s outcome reached Beaufort, a kind of panic ensued. Facing an invading army of Yankees was too dreadful to contemplate; flight was of the essence. But what to take, what to leave behind? The daguerreotypes? The silver? Of course the family bible must be packed. Some loaded up carriages, hoping to stay ahead of the Yankees on the long overland route to safety. But Beaufort was lucky that day—there was a steamer anchored in the river that could take hundreds swiftly to Charleston. However, it had only so much room. Furniture, clothing, horses, and the vast majority of their most valuable property—slaves—would have to be left behind. In the tumult, even food and dinner dishes were abandoned on dining room tables, testament to the haste involved. That evening the steamer departed overflowing with Beaufort’s white citizenry along with every jewel and sentimental item they could squeeze on board. Legend has it that when Yankee forces arrived two days later to occupy the town, they found just one white man remaining in Beaufort, and he was dead drunk.
What must the deserted slaves, who spoke Gullah, their own Sea Island patois, have thought as the laden steamer chugged away from Beaufort’s dock? Did they realize that history had unexpectedly turned a corner right in front of them, and that now, after centuries of captivity as a people, they were suddenly free? Perhaps the political ramifications didn’t sink in that night, but before the first Yankees arrived, clothing and other finery had been looted (liberated?) from the grand homes, and food and liquor thoroughly consumed in an understandable celebration of events.
 Five generations now free (1862)It is estimated 8-10,000 slaves were left behind in the Sea Islands when the white population fled. They were soon joined by thousands of others who escaped to the region once they realized that Northern occupation meant freedom. They all needed food and shelter, and since the Emancipation Proclamation had yet to happen, their legal status, beyond being “contraband,” was unclear. The Army asked for help and received it in the form of the Port Royal Experiment. Financed and organized by Northern abolitionist charities, the Experiment worked as a test case to create self-sufficiency among the former slaves. Its success points to what Reconstruction might have been if less corruption and more competence had been at its helm. Northern missionaries and teachers flocked to the Sea Islands to create schools and aid societies. Former slaves were allowed to farm the confiscated plantations and were paid $1 per 400 lbs of cotton they were able to harvest. The Penn School on St. Helena Island was one of the earliest schools established for freed slaves and can be visited as part of the Penn Center today.
 Yankees at home on a Beaufort piazza (1862)The Union Army found Beaufort a pleasant setting for officer’s quarters, administrative offices and hospitals. Because the Army occupied Beaufort until the end of the war, the fine mansions, while suffering damage, were not burned to the ground like so many other Southern towns and surrounding Sea Island plantations. To this day Beaufort’s centuries-old live oaks and antebellum charm remain. Port Royal turned out to be as advantageous a harbor as the Union had hoped and did much to strengthen the potency of the blockade. After the war, most planter families—their sons dead, their plantations burnt, their Beaufort homes sold in government auctions for back taxes (often without their knowledge)—never returned. The civilization that was antebellum Beaufort vanished into the night with that last steamer.
It is rare that the wheel of fortune spins as violently as it did on November 7, 1861. The town that had advocated so fiercely for secession was the first to feel the brunt of an occupying army. A people remarkable for their wealth lost almost everything in a matter of hours. A region that so defiantly insisted that its way of life—slavery—was non-negotiable ended up being the first to have a colony of former slaves experiment with what it meant to be free. The Great Skedaddle indeed.
Photos above are from (in order): Library of Congress, Library of Congress, Harper's Weekly 11/9/1861, Harper's Weekly 11/30/1861, Library of Congress, Library of Congress.
November 5, 2012
Sparkling, Technicolor Prague
 Note: This is the third of a five-part series. Part one is Charming, Livable Amsterdam. Part two is Fascinating, Evolving Berlin.
My husband and I first visited Prague in September of 1989, two months before Czechoslovakia’s Velvet Revolution that brought about the collapse of its Communist government. Though we didn’t know it at the time, we witnessed the sputtering dregs of the Communist era. Change must have been in the air, but what we saw was a depressed, lifeless city.Everything was grey, there was little to buy in the shops, few people on the street. There were only a sprinkling of cafes and restaurants, and small numbers of hushed tourists. The Czechs themselves hurried on their business with little reason to pause or linger. Though the tremendous Gothic, Renaissance and Baroque heritage of the city could not be disguised, it was muted, dulled and blurred.
 Color, color everywhereFast forward twenty-three years, and wow. Prague is nearly unrecognizable. Color and flowers everywhere! Buildings and statues cleaned! Cafes, restaurants and museums tripping over themselves to appeal to tourists. More schlock to buy than you can shake a stick at (half of it made in China.) And the entrepreneurial spirit of the Czech people imaginatively unleashed to make as much money off tourists as possible. Sometimes the kitsch goes a little over-the-top to realms we would recognize in the hallowed halls of Disneyland, but since Prague has so many centuries of being a lively, sparkling place, I would guess the present incarnation is much closer to the city’s true personality than its dread, Soviet-dominated years.
 The Czech BudThe Czech language is pretty much impossible. Though I’ve never studied Dutch or German, just looking at both languages I could often make them out if I squinted and furrowed my brow hard enough. But Czech? No way, no how. Accents and other strange punctuation marks fly around this language like birds in migration; an ungodly assortment of consonants cluster together with no vowels whatsoever. Evidently it is similar to Slovak, Polish and Sorbian, in case you are considering the benefits of studying Czech. Ironically, after living six years in Iowa where there are a surprising number of people of Czech descent, some of whom were my friends, I probably have more exposure to the Czech language than 99% of Americans. But still in Prague Czech engendered no comprehension in my brain whatsoever. Except—big except!--for one word I saw in a restaurant window almost the second we got into town: Budweiser.I recognized it instantly.
 The AmericanI can’t tell you how much this distressed me. Why, I thought, why, why, why, would the Czechs import bad American beer? Why had they brought over oceans stuff that probably no one should even cross a room with, and then proclaim proudly that they were serving it in their restaurant windows? The answer, I soon learned, beer ignoramus that I am, is that Czech Budweiser is the real thing, and darn good to boot—something indeed to be proud of. The American version is only a shameful pale cousin of the brewing tradition of Ceske Budejovice (a town also known as “Budweis”) that has making beer since the sixteenth century. They call their product Budweiser Budvar. Not only is name almost the same, their logo, as you can see, is pretty similar to the American. Any wonder I was confused?
Evidently old Eberhard Anheuser had heard (or tasted) the product of Budweis, and he named his beer to pay homage to the old country brew. He no doubt thought since he was on a completely different continent, no one would really care if he appropriated the word. Of course the result has been a hundred years of lawsuits flying back and forth across continents ever since. As it stands, the Czechs can currently claim to sell Budweiser Budvar and Bud in the European Union countries but not in the US. If you want to try a Czech Bud in the US, look for a beer called “Czechvar” and you will experience “The Beer of Kings” (as opposed to “The King of Beers.”)
 So back to Prague, land of the double-tailed lion! (I love it when a city has a spiffy, mythical mascot.) Quite simply Prague is a baroque bonbon of a city. It out-baroques every place I have ever been. The movie Amadeuswas shot largely in Prague because Prague looks more like eighteenth-century Vienna than Vienna has any hope of looking now. For statuary alone, Prague gets the best-in-the-world prize. It’s not just the Charles Bridge that pushes Prague towards sculpture nirvana. Although the 75 statues on this bridge are indeed very fine, they are just a few figurine drops in the proverbial statue bucket. There must’ve been entire decades in Prague where simply everyone who owned or built a building said to themselves, “Hey, I need three more statues on top of this thing!” and went out, flagged down some stone carver, and got them made. There have got to be more statues per square kilometer in Prague than any city in the world. In fact, I bet there are double the number of statues per square kilometer here compared to whichever city is number two on the statuary front. (I am willing to bet a Bud, Czech or American, on this important matter, if indeed someone has tabulated the vital statues per square kilometer metric.)
 Adding to the statuary metricThe Czech people are a highly resilient lot. They blossomed in the fourteenth century and then spent most of the last six centuries being oppressed by various occupying forces. Being occupied and controlled by foreign powers is, in my observation, not a fun thing. Evidently the Czechs (used to be called Bohemians) didn’t think so either. In fact, they pretty much invented the term, “defenestration,” (which means throwing someone or something out a window) when, over a usual Protestant-Catholic dispute, the Bohemian Protestants threw two of their Catholic Hapsburg overlords out a window. The pair fell three stories and were either saved by angels or by falling into a dung heap, depending on your point of view. Eventually the Protestant rebellion was snuffed out, its leaders executed, and the Protestant religion outlawed in Bohemia entirely. (Defenestration, while undoubtedly satisfying, does not always work. Let that be a lesson to us all.)
 Feeling oppressed?The Czechs have over a thousand years of very complex history. It largely begins with the realm of King Wenceslas of Christmas carol fame, blossoms during the Middle ages with centuries of self-rule. Then they are conquered by the Hapsburgs and ruled by them for four centuries (the Hapsburgs turn into the Austrian-Hungarian Empire along the way.) They get a brief two decades of autonomy between WWI and WWII, then occupation and rule by the Nazis swiftly followed by occupation and rule by the Soviets. And then, miraculously, independence in 1989 and self-rule ever since.
So you can see what it must mean for the Czech people to finally be in control of their county and their destiny. Unlike the Germans, the Czechs neither mumble about the nastiness of World War II, nor are they the least bit nostalgic about the Communist era. In fact, they are still pretty much pissed about both the Nazis and the Prague Spring of 1968, their attempt to shake off Soviet shackles that was violently put to rest by a not-so-friendly invasion by their large domineering big brother.
 Historic means moolahIn the years since achieving their autonomy, the Czechs have struggled to catch up to their wealthier western neighbors. They’ve thrown out the pretty much unworkable Soviet model of industrialism and struggled to put together an economy that works. Part of what works is tourism, offering up their spectacular cities and countryside to foreign guests. It seems like everyone is hustling in Prague to get in on the tourist money train, offering tours, services, artwork, and handicrafts. There are all sorts of museums, from the privately wacky to the grandly austere, tempting the visitor with treasures of grandma’s lace collection or 15th century art. There are dance performances, theater shows, and concerts galore. My youngest daughter and I saw an impressive though sparsely attended modern dance performance in an 18th century courtyard under the stars (until we got rained on.) Our family hired a private guide to take us on a walking tour. The cost to hire a well-educated (university grad), knowledgeable, English-speaking guide for our family of five was slightly less than the cost of a much more impersonal group tour we might have taken in any other city we traveled in.(Plus we were able to ask endless questions of what life in the Czech Republic was like for the average citizen. Much fun!)
 Tourism, though undeniably lucrative, is a tricky business. In my observation, people on holiday (almost regardless of nationality) can be unpleasant, inconsiderate, destructive and swinish. I’m not quite sure why this is, maybe partly due to genuine ignorance of local customs, partly due to a sense of entitlement as paying customers, partly due to just too many people crammed into too little space for considerate human interaction. Copious alcohol can also play a role. The result is that tourists can be like a swarm of insects, consuming and blighting everything in their path. Even worse, these tourists can be your former oppressors, and if you want their money you have to smile and be accommodating.
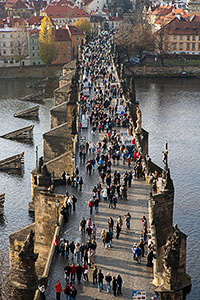 Imagine 6 times the peopleIn 2011, roughly 5 million tourists came to Prague, a city with a population of 1.2 million. The top visiting nations were Germany (655,000), Russia (386,000), and the UK (284,000). (The US came in at number five.) We were told that the week we were there tourism was actually quite light for June.Evidently on a normal June day you can barely shuffle shoulder-to-shoulder across the Charles Bridge, it is so packed with humanity. (We were only obliged to dodge, dart and pause numerous times.)The reason for the light traffic, it turns out, was due to a theme recurring throughout our trip: all the Germans were home because Germany was still in the running in the Euro Cup. Even though Hyundai, as in Berlin, had kindly set up an absolutely massive Euro Cup viewing screen in the most iconic spot in the city, in this case Old Town Square, Germans preferred to watch and celebrate this important event at home. Once the Euro Cup was over (or Germany lost a game and failed to progress), then real tourism season would hit. We could only be thankful the German team had played as well as they had!
 Nibble those toesBecause the Czech Republic is part of the European Union but not part of the European Monetary Union, it still has its own currency, the koruna. This means the Czechs can devalue their currency at will against the euro, rendering their country extremely good value for western Europeans to visit. So the Germans and Italians, the French and the Dutch, come in droves, often to drink excellent Czech beer for very low prices. (Not to mention all sorts of hard alcohol which was also inexpensive and free flowing.) They may also enjoy getting their feet nibbled by fish at Thai massage parlors.(I am not kidding.) It struck me as a bit like Americans going on vacation in Mexico, except more statues and castles.
 It also struck me how polite the Czechs were, how patient with their drunken customers, how tolerant they were of completely handing over the beautiful heart of their city for months at a time. In San Francisco, we’ve ceded Fisherman’s Wharf but have largely managed to keep the nicest parts of the city for our own use. (Sometimes we are quite quiet about what the nicest parts of our city are.) So what San Franciscans have to sacrifice on the altar of tourism is minimal compared to the Czechs. After so many centuries of domination and oppression the Czechs are struggling economically. The Czech Republic’s GDP/capita is below the EU’s average.It’s below Greece’s, right around that of Trinidad and Tobago. It’s above Russia’s, so you might wonder why so many Russian tourists? The Czech Republic is a very egalitarian country with a low Gini index of 25.8, very close to that of Norway, Sweden, Denmark and Japan. Whatever their fortunes, good or bad, they are all pretty much in the same boat. Russia has a high Gini index of 40.1, which puts them more in the realm of third world countries and the US. So rich Russians can visit, and plenty of them do.
Of course, I write this having been part of the ravenous swarm myself. We tried to be considerate, tried not to do too much damage, or be too offensive, but no doubt we made our share of blunders even so. One district of Prague where the tourism did not seem overly crushing was in the old Jewish quarter, perhaps because people were spread out between multiple synagogues, perhaps because most Prague tourists come to shop and drink rather than pay witness to what is left of a ghetto, home to Prague’s Jewish population for almost a thousand years. Constructed in medieval and renaissance times and no doubt cramped, unsanitary and squalid, most of the ghetto was destroyed at the turn of the 20th century as a “modernization” effort. While originally confined entirely to the ghetto, Jews had been allowed to live in other parts of the city since 1851, so the numbers needing to relocate were few. At the outbreak of WWII, 92,000 Jews lived in Prague, almost 20% of the city’s population. At least two-thirds perished in the Holocaust.
 The layers of historyI thought the synagogues startlingly beautiful and the information presented in them worthwhile, but they were infinitely sad. Some are still in use for services, some have become just silent memorials to what was. The old Jewish cemetery with its layers upon layers of graves especially attested to centuries of striving and surviving, often in the face of great unfairness, cruelty and violence. Though most synagogues in former Czechoslovakia were destroyed during WWII, the ones in Prague were bizarrely spared because the Nazis planned to turn them into an “exotic museum of an extinct race.” In fact, the Nazis collected (i.e. looted) Jewish artifacts from all over Europe to put on display at this future museum. But these handful of buildings and cemetery survived to tell a story quite different from the one the Nazis intended.
I am sorry to report that Prague is not a great city for bicycling, and this goes beyond the amount of cobblestones and the rather enormous hill up to Prague Castle. I didn’t see a lot of bikes, bike rentals, or bike lanes, though there evidently are bike tours available in Prague (and I now wish we’d taken one.) It is even possible to bike from Prague to Vienna along a system of bike greenways. (Future trip!) But the touristy areas of Prague are so crowded, walking is by far the best option. Our walking tour guide said he rides bikes with his kids where he lives, but this is in parks away from the old part of town.
 Skoda, Skoda, SkodaIn addition, the Czechs love their cars. Or I should say, car. The Skoda. (Of course there is more than one model.) Perhaps it comes from so many years of a controlled economy where few could own cars, perhaps it comes from still limited transit infrastructure (though their underground system is more extensive than San Francisco’s) but there is a great deal of national pride around these babies, and in any part of the city that is not pedestrian-only, the car noise and traffic can feel intense. Car manufacturing is also a great driver of the Czech economy. The Czechs export over 80% of the cars they make to places like China (their leading customer), eastern and central Europe.
 Awesome candidate for pedestrian zone?Prague does have quite a bit of pedestrian-only areas in its historic center, and the amount is slowly expanding. Businesses and restaurants are realizing that the pedestrian zones are where tourists feel welcome, comfortable and want to hang out, so stores and restaurants in these zones flourish. Of course the Charles Bridge is pedestrian-only; in fact, it’s almost incomprehensible that cars ever crossed this fifteen-century masterpiece but they did until the mid-1960’s. The twelfth-century Old Town Square with its fabulous Astrological Clock is car-free, and there's also the ritzy shopping street of Na Prikope that is entirely and pleasantly pedestrian (as well as way over my budget.) In addition the lower part of Wenceslas Square went pedestrian-only just this last spring. Long term the vision is to make the entire (huge) Wenceslas Square a continuous pedestrian paradise. Wouldn't it be great for the lovely and immensely old Mala Strana district to also be free from the roar of fast-moving cars? (hint, hint.)
 Statuary ode to a wandering KafkaSo summer in Prague is full of flowers and crowds and art and drunkeness. I’m heartily glad color and gaiety have returned to the city. However, someday I want to visit again when things are quieter, perhaps late October. When there might still be a chance that Mozart has just turned the corner of the 18th-century arcade stretching ahead. When Kafka might still wander through the tight streets near Prague Castle. When Golem might peak from behind an old Jewish cemetery headstone. When 12th-century ghosts in armor might drift like mist across the Charles Bridge after dusk. Not a depressed and morose Prague, but a moody, artistic, intense Prague, the Prague that I think is still there, under the artifice and revelry designed to part the tourist from his euro, ruble, or dollar.
(Next in this series will be Enlightened, Elegant Vienna.)

October 3, 2012
Per Capita Oil Consumption Is Dropping Like a Rock (in Some Countries)
 It is one of my hobbies to follow per capita consumption of oil. A strange pastime, I realize, and one for which few share my enthusiasm. But you may be interested in the results!
Since up-to-date per capita oil statistics are difficult to find, I’ve had to derive them myself. I have a nice spreadsheet laden with data from the IEA (International Energy Agency), the EIA (the US Energy Information Agency) and country population stats from Wikipedia, my focus from 2007 until the first half of 2012. Some of what I’ve come up with makes my jaw drop.
 Oil available for export is not risingIn general countries that export oil—Venezuela, Kuwait, Saudi Arabia, UAE, Norway, Libya, Iraq, Iran, Mexico, Russia--have a hard time keeping internal consumption down. Oil sold at subsidized prices placates their populations. Riots tend to occur whenever the cheap oil spigot is shut off. Consumption in these countries is either increasing, or, if times are very difficult, remains flat. For oil-importing countries (like the US) it matters not so much how much oil is being produced but how much is available on the world market.Rising consumption in oil-producing countries eats away at what is available on that market. Right now there are generally 41.5 million barrels of oil per day available for purchase on the world market. This is down 5% from seven years ago, even though the price of a barrel of oil on the world market has more than doubled.
Countries that have been very poor in the past but are now slowly gaining some ground—India, China, Brazil, Turkey, Vietnam—have had teeny increases in per capita consumption over the last five years. But because these countries are so populous, even teeny increases gobble a sizable share of the world’s available oil. In contrast, the PIIGS (Portugal, Ireland, Italy, Greece and Spain) are in oil consumption free-fall, reflecting their economic troubles. (They will drop further.) Even Austria, Denmark and the UK, countries not in severe economic hardship at the moment, have dropped their consumption significantly. The US has had some tidy drops in oil consumption as well over the last five years. We, too, will drop further. Read on.
The world average per capita oil consumption is .012 barrels per day per person (BPDPP—a terrible acronym, I know. Just keep in mind this is the statistic we are examining with utter fascination.) Remember this world .012 number. It has not changed for the last five years. All individual country numbers will drive towards this one. If they are higher, they will tend to drop; if lower, they will tend to rise. As peak oil hits and world oil production gradually declines, the world .012 per capita number will slowly drift down, unless world population decides to sink in corresponding proportion.
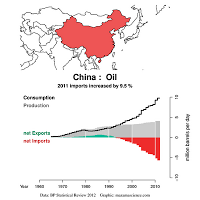 Lots of red means lots of importsNow let’s look at our growing-and-determined-to-rise-further countries. They are: India (.003), China (.007), Brazil (.013), Turkey (.010), Vietnam (.004). Together these five countries make up 40% of the world’s population! All but one presently consume below the world average. All have a strong desire to improve their standard of living by claiming a greater share of this dense, liquid energy source. I predict by 2015 China’s consumption will rise to .009. India, Brazil and Vietnam will rise by .001 to .004, .014, and .005 respectively. Unlike Vietnam and Brazil, which produce most of the oil they consume, Turkey imports every drop. I doubt this is sustainable and predict Turkey’s consumption will fall to .008 by 2015.
Even this modest rise by these countries will gobble up an additional 4 million barrels of oil a day, 10% of all oil available on the world market. This is oil that has to be subtracted from other countries’ consumption or produced at high marginal cost via tar sands and the like. As the cheap oil found long ago around the world gets pumped out, all that is left is the more costly oil, oil more difficult both to extract and to refine. The result is higher prices that tend to break nations’ economies. This is the reason that oil exports (first graph on this post) are flattening out rather than rising.
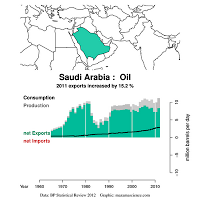 The black line is eating into the greenNow we’ll move on to the big kahuna of oil consumption--Saudi Arabia! Saudi Arabia has increased its per capita consumption from .079 barrels per person to .104 over the last five years. This is close to 9 times the world average! Compared to the countries we’ve just looked at, they are inhaling oil. But Saudi Arabia is between a rock and a hard place these days, forced to burn oil to desalinate water, to generate electricity, to air condition a restive population in a hot climate. Most long time oil observers believe Saudi is now producing flat out with no spare capacity. As their well production starts to drop off, they’ll rev up planned nuclear and solar installations for electricity, but I predict by 2015 they won’t be able to drop their internal consumption much under .900 per person and their population is still expanding. This means their consumption will significantly decrease the oil have available for export.
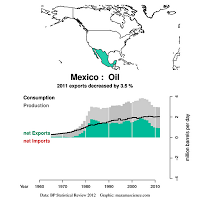 How long before the green's all gone?Looking at other major oil producers, consumption in Venezuela (.026), UAE (.069), Kuwait (.095), Libya (.049), Russia (.022), Norway (.051) and Iraq (.022) has all been on the rise the last five years. Mexico (.019) and Iran (.023) have kept their use pretty much flat, reflecting their governments’ rather intense need for oil income. (I’m sure it’s been difficult.) For political reasons, all these countries will struggle mightily to keep a lid on consumption increases by 2015, much less drop consumption. However, once a country switches from net oil exporter to net oil importer, things can change fast. (Such a switch is possible for Mexico by 2015, as evidenced by the declining amount of green representing oil export in the chart above. Venezuela has at least five years and the others have at least 7 – 10 years before their exports finish dwindling to zero.)
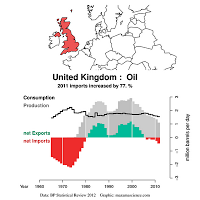 It was good while it lastedIt’s interesting to consider Egypt (.010), Vietnam (.004) and the UK (.025), all countries that were oil exporters and became net oil importers during the last five years. The UK dropped from .028 down to .025 over the last five years, a pretty aggressive attempt to stanch their energy deficit bloodletting. (I predict they’ll drop further to .020 by 2015.) Egypt and Vietnam, in contrast, being very poor and low usage already, had less fat to burn off and so were doing well just to let consumption rise a teeny, weeny .001 amount. (I predict they won’t rise further between now and 2015.) But when you have to import that teeny, weeny additional .001 times 80 million people--and pay hard currency for it—that teeny weeny hurts.
And so we move on to the PIIGS, the countries giving the Europe Union and the euro so much trouble. This is where we really see some action. First off, with the exception of Italy, most of the PIIGS were oil hogs, at least relative to the countries north of them. (Perhaps this was part of the reason their economic troubles hit first?) In 2007, Portugal was at .029, quite high given their per capita GDP, Spain was at .035, and Greece and Ireland were at .042! (In comparison, Germany and France were at .030 and had much more GDP to show for their oil use.)
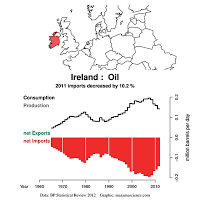 Disappearing redWell, now, five years later (using the latest 2012 figures) we see some startling changes. Spain has dropped from .035 to .029. Given their 25% unemployment rate, I predict by 2015 they’ll be down to .020. Ireland and Greece have plummeted in five years from .042 to .029 and .030 respectively. I predict by 2015 they’ll be at .020 and .018. Portugal has dropped from .029 to .023. I predict in 2015 they’ll be at .018. And Italy, a country that wasn’t all that oinky to begin with, has dropped from .029 to .023. I predict by 2015 they’ll be down to .020. Countries that have invested in a decent rail system (Italy, Spain) will have a much easier time with their oil consumption drops ahead.
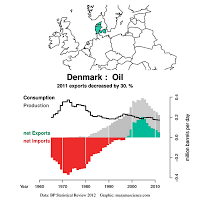 Fighting hard to keep their greenBut other European countries are dropping their oil consumption as well, in advance, it appears, of severe economic motivation. Austria, no slouch in the wealth department, has dropped form .035 to .031. France has lowered from .030 to .027. Denmark (just barely still an oil exporter) has declined from .034 to .029. As we already saw above, the UK is at a very svelte .025 this year. Sweden has dropped from .037 to .032. Finland has dropped from .042 to .036. If a country’s drop in oil consumption is achieved smartly through more efficient transportation methods, leaving economic productivity intact, using less oil per unit of GDP is healthy and will increase the wealth of any country that imports oil. However, if a country’s drop in consumption is due not to increased efficiency but rather due to people being out of work and too poor to use their car anymore, the drop is just another symptom of deep economic pain. I predict Austria will drop further to .027, France and Finland will hit .025, and Denmark and Sweden will decline to .028.
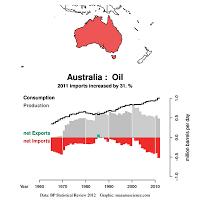 A recipe for disasterAnd then there are oil-importing countries with rising consumption that are in for trouble: Australia, Japan, and Argentina. Australia’s consumption has increased from .043 to .046 in the past five years. Maybe all their coal exports to China have made them feel flush, but as China’s economy slows the rubber will meet the road for Australia. I predict they’ll be down to .030 by 2015. (Will this be a breathtakingly steep dive? Yes, it will.) I don’t know what Argentina thinks it’s doing, letting its consumption rise from .015 to .017. Once they switched from oil exporter to net oil importer, they should’ve put the oil consumption brakes on in a big way. Maybe the impact hasn’t really hit home yet. My prediction is that they’ll struggle mightily to keep consumption flat at .017 until 2015. And poor Japan. They were nicely reducing their consumption from .039 to .034 when, bam, tsunami hit, nuclear power plants went down, and they had to burn oil to make electricity. Their oil consumption is back up to .037 and their economy is weak. My prediction is they’ll be down to .030 by 2015.
 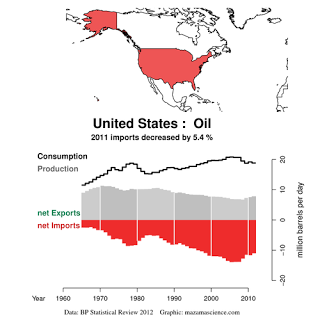 We will do betterSo, you might wonder, how is the US doing? Well, we are pretty much an oil oinker in a big way, especially given we import over half the oil we use. The vehicles we drive are half as efficient as European and Asian cars. We subsidize both oil and ethanol to keep our gasoline prices artificially low through massive tax breaks to the oil industry and corn farmers. (We also use more energy to produce ethanol than the ethanol actually gives our cars.) We run enormous trade deficits to buy the oil we import. But the good news is over the last five years, our per capita oil consumption has dropped from .066 to .059! It’s an impressive accomplishment given how sprawled our population is, how heavy our vehicles are, and how little we have in the way of trains, light rail and bike paths. But we still have much farther to fall. (We’re still more than double per capita oil consumption of Germany and France.) I predict by 2015 we’ll be down to .040. That’s way above where Europe was even five years ago, but a challenge for us nonetheless. Such a rate won’t make us energy independent, but it will reduce our trade imbalance from a hemorrhage to a slow bleed.
 How will we drop our oil consumption by 1/3 in three years you might ask? I see four options. Either 1) people will voluntarily start biking, walking, taking mass transit, driving tiny cars, and moving closer to work and shopping (sound likely?), or 2) gasoline prices will rise, forcing people to start biking, walking, taking mass transit, driving tiny cars, and moving closer to work and shopping, or 3) our economy will crash to the point even $3 per gallon gasoline isn’t affordable, or 4) someone will start a war with gasoline rationing in the US as the result.
If European oil consumption hadn’t dropped so dramatically the last few years, our oil prices would already be higher and our consumption lower. They were far less wasteful with their oil but more leveraged financially (one wonders how that’s possible, given the staggering amount of US financial leverage, but it’s the case), so they were the first to get hit. In addition, up until now, all oil has traded in US dollars the world over, giving us a price advantage. Recently, the Chinese have negotiated not to use dollars with their oil trade partners. A lot of change lies ahead, I think. We’ll see how accurate my predictions turn out to be.
Note: all graphs except the first are from the Energy Export Databrowser, a great, great website. Check it out! The first is from Of Two Minds, another very informative site.


