
Karen Lynn Allen's Blog, page 3
January 9, 2017
Squeezing Oil Out of Your Travel (Make Your Life Less Oily in 2017, Part 2)
Make Your Life Less Oily in 2017 Part 1: Taking Stock Part 2: Squeezing Oil Out of Your Travel Part 3: Wringing Oil from Your Food, Stuff, Heat, and Everything Else
Part 2: Squeezing Oil Out of Your Travel“You cannot get through a single day without having an impact on the world around you. What you do makes a difference, and you have to decide what kind of difference you want to make.” ― Jane Goodall
"Actions speak louder than words, but not nearly as often." -- Mark Twain
In Part I: Taking Stock , we covered how every dollar we spend on oil products supports fracking, tar sands, multinational corporate profits, and the beheadings, stonings, and terrorism financed or perpetrated by Saudi Arabia. We also covered how American life is so saturated with oil, it’s nearly impossible to wring it entirely out of one’s daily existence. To make our oil-use more conscious, Part I had a nifty on-line calculator to estimate personal oil consumption. If you haven’t done it yet, or don’t recall your results, go back and do it now. I’ll wait.
 What our money buysYou’re back? Good. Now that you have an understanding of your oil consumption, let’s say we don’t want to support the rather nasty activities that oil production necessitates or that oil profits make possible. What to do? Well, we can certainly send emails, sign petitions, and call our congress critters to request changes in US policy towards oil companies and Saudi Arabia. We can also donate to non-profits working on the issue. We could even organize/march in protests. Still, there’s no escaping that the personal is political. As long as you and I consume oil, we make oil nastiness possible in the most basic way. Our money, and how we spend it, is an extension of our values, our intent, our convictions. If we don’t consume the oil, then, yes, someone else might. But when we participate in the ugly world of oil by consuming its products, we not only make it profitable, we give the whole craziness our implicit consent. Our efforts to change this are not useless drops in the bucket. Paradigm shifts most often happen first within small subgroups that eventually form enough critical mass to cause large-scale cultural change.
  Kicking the Oil HabitBut our lives are so oily! It’s nearly impossible to live in the United States at the moment without at least some of the black ooze seeping into our lives. Never fear. Even if we can’t go 100% oil-free, we can reduce our consumption substantially. And this matters. Remember, as a commenter on Part I said, the price of oil is set at the margin, and since the dirtiest forms of oil—oil produced by tar sands and fracking—are the most expensive to produce, they are the first to be dropped when demand drops. Not to mention that low oil prices hurt oil companies and oil-nations far more than any divestment campaign can ever hope to. (Not to say that divestment is a bad idea.) As we’ll see, a side benefit of dropping our oil use is that we’ll be healthier, probably happier, and our communities more prosperous. But we’ll get to that.
 Your money countsWe can divide personal oil consumption into five basic categories: oil for private vehicle travel, oil for all other travel, oil for heat, oil in your food and beverages, and oil in your stuff. Check what the calculator told you. Your car may be your biggest oil slurper, but depending on your lifestyle, it could also be the stuff you buy each year, or your air travel. Our solutions in this part and the next will range from heat pumps to PEBLs to sating the hungry ghost. Let’s begin! Remember, we’re looking through the lens of reducing oil consumption, not greenhouse gases or resource depletion, although both are also important, and I may mention them from time to time. (Note: I receive no monetary or other reward for any products or websites that I point out. I just share what I like and have found useful.)
Oil in Your Private Vehicle Travel
 Travel is responsible for two-thirds of US oil use. American vehicle miles traveled (VMT) are insane. In 2009, our 211 million vehicles belonging to 113 million households traveled 2.2 trillion miles, close to 20,000 miles per household. Do you know how many vehicle miles your household accrues in a year? If not, start tracking it.
This may surprise you, but the first order of business is not to electrify junk miles, but to shed them from your travel diet. After all, whether it causes you to consume oil or not, time spent in a car is not quality time. For most people it makes them stressed, unhappy, and fat. By shedding VMT, you will not only give less money to corporate CEOs and Saudi princes, you’ll make your family healthier, happier and likely wealthier in the process. So let's look at how to do this.
 Walking the Hills --Edward Potthast1.) Embrace walking as a feature, not a bug, of human existence. Getting thirty minutes of moderate exercise like walking each day is essential to your health. (See
The Brilliance of Walking
.) You can be a bit overweight and be healthy, but you cannot be sedentary and healthy. Walking prevents all sorts of disease, from heart disease to diabetes to Alzheimer’s to many forms of cancer, not to mention it boosts your immune system and alleviates depression better than any drug you can take. Walking is so amazing for your health, in fact, that if the benefits could be put into a drug, some pharmaceutical company would be making billions in profits from it. Instead, it’s free! It brings you health and joy! It helps you get to know your neighbors, it reduces crime by putting eyes on the street, and every trip made on foot instead of by car reduces the pollution, grime, noise, and vibrations that your neighborhood experiences, improving housing values as well as the sociability and happiness of your community. And it saves you $2500 a year in out-of-pocket health care costs! The easiest, most sure-fire way to get this exercise is to embed walking in your daily life. The most sure-fire way to embed walking in your daily life is to have lots of destinations that you routinely go to within walking distance. Which leads to . . .
Walking the Hills --Edward Potthast1.) Embrace walking as a feature, not a bug, of human existence. Getting thirty minutes of moderate exercise like walking each day is essential to your health. (See
The Brilliance of Walking
.) You can be a bit overweight and be healthy, but you cannot be sedentary and healthy. Walking prevents all sorts of disease, from heart disease to diabetes to Alzheimer’s to many forms of cancer, not to mention it boosts your immune system and alleviates depression better than any drug you can take. Walking is so amazing for your health, in fact, that if the benefits could be put into a drug, some pharmaceutical company would be making billions in profits from it. Instead, it’s free! It brings you health and joy! It helps you get to know your neighbors, it reduces crime by putting eyes on the street, and every trip made on foot instead of by car reduces the pollution, grime, noise, and vibrations that your neighborhood experiences, improving housing values as well as the sociability and happiness of your community. And it saves you $2500 a year in out-of-pocket health care costs! The easiest, most sure-fire way to get this exercise is to embed walking in your daily life. The most sure-fire way to embed walking in your daily life is to have lots of destinations that you routinely go to within walking distance. Which leads to . . . People over cars (granolashotgun.com)2.) Live in a ten-minute neighborhood. What the heck is a ten-minute neighborhood, you ask? A neighborhood where essential goods, services and transit can be reached within a ten-minute walk. This doesn’t have to be in a quaint village or hip coastal city that are expensive as all get out. There are many small towns and rust-belt cities with good urban bones that offer excellent value. Now moving may seem a radical option, but 25% of renters and 5% of homeowners in the US move each year. If you’re going to move anyway, don’t just consider housing costs in your calculations of what is affordable. Add up housing+transportation+energy+healthcare costs, and recognize that long commutes are one of the leading causes of unhappiness in the US. A large house in a far-flung suburb might appear to be the best bang for your buck, but once you’ve factored in extra costs for transportation, energy, and healthcare, a smaller house with a smaller yard in a walkable neighborhood might turn out not only to make you happier and healthier but also wealthier.
Why is living in a walkable neighborhood so important? Since only a quarter of all trips are commute trips (and only 28% of all VMT is for commutes), being close enough to walk to a grocery store, pharmacy, coffee shop, elementary school, restaurants, dentist, post office, bakery, library, and your family doctor is going to reduce your VMT significantly. If you can’t live within a ten-minute walk (half a mile), living within a ten-minute bike ride (1.8 miles) isn’t bad. As long as you’re not riding near crazed, reckless drivers, bicycling is a great way to add exhilaration and even joy to your life. (Yes, once you become moderately fit, cycling can feel that good.) Check out this site, and it will show you what you can reach in ten minutes by walking or by bicycle.
 My SUV of bikesThe site doesn’t take into account hills, but that’s where electric bicycles come in. On an electric bike you can cover five miles of hilly terrain in half an hour while toting two kids and five bags of groceries without breaking a sweat. It’s true! I live in a ten-minute neighborhood, and over the last ten years--with a change in attitude, better bicycle infrastructure in my city, and the acquisition of an electric bike--my trip mode share has become 40% walking, 40% biking (half regular, half electric), 10% transit and 10% driving. What is your mode share? Make a guess and then keep a travel diary for the next two weeks and see how real life compares.
Note: don’t move to a ten-minute neighborhood and then continue to drive everywhere. You’ll just make your new neighbors miserable with the congestion and danger you create. Let someone who wants a car-lite lifestyle take that spot.
 Excellent bonesWhat if you like where you live and don’t want to move? Well, first check and see if your neighborhood is more walkable and bikeable than you know. People tend to overestimate how far away things are, and more destinations may be in reach under your own power than you realize. Next, does your neighborhood have sidewalks, bike lanes? If it doesn’t, this is something that can be changed with some organizing and lobbying. (Here's an example of a town that used a roundabout and a road diet to create walkability.) Lastly, could your neighborhood become a ten-minute neighborhood by beefing up a traditional Main Street that could once again offer an array of goods and services if only there was enough density to support it? The easiest way to add density painlessly is to replace parking lots along this street with infill development, adding stories of mixed use residential over ground floor retail. Several blocks of two to four story buildings with no parking lots pushing destinations apart will make a world of difference. Though physically this is not hard to accomplish, your town probably has a ridiculous number of legal and cultural obstacles in the way of such development. However, these are not immutable laws of physics but rather human constructs that can be altered by any town interested in achieving prosperity through modest incremental investment. I suggest checking out Strong Towns for all sorts of ideas on how towns can stop going broke by focusing on their cores rather than the illusory get-rich-schemes of ponzi-sprawl.
If the answer is you live in the sticks and your location is never going to become walkable or bikeable, then continue on. There are still things you can do.
 Feel the ice at -8 degrees F. No excuses!3.) Live in a location where you and/or your spouse/partner can commute to work by non-car means. Even if you can’t live in a ten-minute neighborhood, you will still achieve big oil reductions if one of you can get to work without a car—by walking, biking, transit, electric scooter, or even electric skateboard. I have a good friend my age (55) in Minneapolis who walks forty minutes each way to work, even in winter. Even when it’s 8 degrees below zero. It’s all about attitude and the right clothes. (She does have the advantage of sidewalks the entire route.) If you’re younger than 55, no excuses! If your town has better weather than Minneapolis, no excuses! For longer distances, consider an electric bike, and/or for winter commutes, consider a velomobile, or a four-season pedal electric vehicle such as the ELF or the PEBL. They may seem expensive, but they’re way, way cheaper than owning a car. “But it will add half an hour a day to my commute!” you say. “I just don’t have the energy or the time.” First off, an active commute is going to make you feel great, so you’ll have more energy and vitality at work and home. Secondly, we’re going to free up more than thirty minutes a day for you when we get to sating the hungry ghost in part 3. So still no excuses!
 Kid shuttling solved.4.) Arrange carpools for kids’ activities; opt out of the kid activity rat race. If your child likes to dance or play soccer, find studios/leagues that don’t require lots of travel time, especially if your child is under twelve. You’re not a bad parent if you don’t spend every weekend traveling for soccer. You’re not a bad parent if you don’t drive hours for music or chess or tae kwon do lessons. Children don’t need seven activities apiece, even if it seems as if all their friends have that many. In fact, they’re likely better off if they just have one or two activities and are allowed to drop the ones they don’t like and pick up new ones that suit them. They’re children. Let them explore and experiment. What they should not be doing is spending an hour a day strapped immobile in a car.
5.) Choose the “pretty good” service/activity closer to home. If the best dentist or pediatrician in the region is twenty miles away, but a pretty good dentist or pediatrician is just down the block, choose the pretty good one nearby. (Go to a specialist the few times you have specialized problems.) Instead of the best church with the most brilliant minister/best music, attend a local church and visit the brilliant one only occasionally. You’ll build connections with your neighbors better that way anyway. And so on. You get the idea.
6.) Take the train for 30 to 300 mile trips. Trains have very good passenger miles per gallon (pmpg). The northeast corridor trains between Washington DC and Boston, being electric, use no oil at all. I realize trains aren’t options everywhere, but where they exist, make use of them!
 Your bus could be electric7.) Take electrified local transit. Only San Francisco and Seattle have an extensive system of electric trolley buses, but a number of cities are now offering oil-free electric buses or shuttles (including Louisville, Nashville, Chattanooga. Stockton, and Reno). And most heavy rail rapid transit systems (Such as MARTA, BART, MBTA, New York City Subway, LA Metro Rail, and Washington Metro) are electric, as are most light rail systems. All VMT you can convert to public electric miles are miles that don’t count towards oil use at all. For those of you that take corporate buses, all those buses can and should be electric. (Check out the range on the new Proterra buses.) Start bugging your employer to convert.
8.) Drop education VMT. Where you send your children to school has a major impact on your VMT. The best is a school walkable from your home. Second best is a bikeable school. Third best is a school on public transit. This is true for lower grades as well as high school, but especially high school. The way your teen is most likely to die is in a car with friends. Let that sink in. If your child’s high school has a huge parking lot with lots of cars, the odds of your child getting in one are high.
 Bike-friendly UC Davis Also consider oil use in college choice. There are many factors that go into picking a college, so why not let oil use be one of them? After all, supplying your child with a car over his/her four years of college is roughly equal to four years of in-state public university tuition or one year of private university tuition. A car-free college career can equal $40K of college debt your child doesn’t have to take on. Could your child get to the college he/she is considering by non-oil or low-oil means? (Is the college accessible by train?) Could your child survive four years happily there without a car? Does the college campus offer shuttles to nearby cities or shopping? Does it offer Zipcars or some other carshare for students? Lots of bikes on campus is usually a good sign that student culture is oriented towards low oil use. A policy mandating that freshman (and sometimes even sophomores) can’t have cars on campus is another good one.
 Early programming9.) Eliminate car brainwashing. Mr. Money Mustache covers this really well, so I’ll let him do the heavy lifting on this one. (Click on the link. If you don’t know about Mr. Money Mustache, you can thank me later for introducing him to you.) Let me just point out that $20 billion in advertising dollars are spent every year to make you, the American consumer, believe that your car equals your value, your status, your virility (if male), your competence (if female), not to mention your parenting ability. No! Your car is a tool, no more, no less. Keep clear that a car’s value is its usefulness, not the other emotionally laden gobbledygook that nearly infinite advertising so desperately wants us to gulp down whole. Your car is not a penis-extender, nor is it a metal womb to keep your family safe. The power it’s capable of can be useful, but it doesn’t increase your personal merit, status, or attractiveness except in the eyes of people who are deeply car brainwashed. In fact, too much time in a car will render you flabby, sick and wholly unattractive. Let me confirm that in-the-know-people (such as the ones who read this blog) will have more respect for your high mileage, beat up, old, dented, paid-off car than a shiny new one that’s just going to get dented/scratched/lose its value precipitously. Your car is not a reflection of your worth as a human being! More about the perniciousness of advertising will be covered in part 3.
 10.) Drop down one car. US households on average have more vehicles than drivers. This is ridiculous. After you’ve reduced your VMT and car brainwashing, consider saving boatloads of money by having your household drop down one car. This is especially possible if one of the adults has a non-car commute. Owning fewer cars will further encourage you to replace VMT with other transportation options. As a corollary, the more transportation options you have, the easier it is to drop down one car.
 Replace that car! (OliviaCleansGreen.com)Look at it this way: the average car spends 160 hours per week not moving. The 8 hours per week it does move cost you $6000 - $15,000 a year, depending how old/new/fancy your car is. The average vehicle takes three one-way trips a day for a total of 29 miles. Can you make those trips by other means? When our family jettisoned our minivan to become a one-car household, we were already living in a ten-minute neighborhood, my husband was already biking to work, and I was already a queen of kids’ carpools. Still, the idea of just one car was daunting. To make our transition easier, I got a wire handcart and an electrified cargo bike, and we joined a carshare non-profit. Even though we rarely utilized the carshare, it gave us a sense of security at the time to have it as a back up. Don’t pooh-pooh secondary and/or back up measures; they may be the tipping point to give you the confidence you need to shed a vehicle.
Car replacements (consider in combinations):A.) Bike with panniers or trailer for carrying stuffB.) Handcart to walk groceries/stuff homeC.) Sturdy stroller to push young children aroundD.) Walk/bike with your children to school instead of drive themE.) Electric bikes (Check out The Pluses and Minuses of Electric Bikes )F.) Electric adult trikes (many elderly who have trouble walking find electric trikes extremely liberating as well as safer than driving a car)G.) Electric cargo bikes (mine carries 5 bags of groceries)H.) Velomobile or pedal electric vehicle (ELF, PEBL)I.) Electric skateboard or foot scooterJ.) Join a carshare company for when you need a car/second car, van, or truck for a day or even just an hour.K.) Electric scootershareL.) Rideshare/taxis on occasion (bad weather/last mile issues.)M.) Let your teens use rideshare on occasion. (Way cheaper and safer than giving them a car.)N.) Make a deal with a friend/neighbor/family member to use their car in a pinch. Repay with food, favors, etc.O.) Have large items delivered, or rent a van/truck by the hour.P.) Create family calendar to keep track of car-necessary activities.Q.) Convert far away activities into local ones.R.) Teach your children how to ride public transit.S.) Persuade your boss to let you work from home one or two days a week.T.) Combine/plan errands. Meal plan. Grow vegetables/fruit at home if possible so you can eat from the garden in the summer. U.) Other ideas? Leave them in the comments below.
 Scootershare--coming to a city near you?When dropping down a car, my advice is to jettison the vehicle with the worst gas mileage and highest maintenance costs. But perhaps your other car has the most expensive payments and highest insurance, so that’s the one you’d like to get rid of. You know your situation best, but do consider the option seriously. Shedding a car can free up valuable funds to pay for groovy electric bikes, but the money can also be used towards higher rent/mortgage payments in a ten-minute neighborhood, with the attendant health and happiness benefits.
11. Make your own biodiesel. As a commenter in Part I said, this is a good choice for some people. Instructions here. Corn-based ethanol, however, is a scam politicians inflicted on us to buy votes from Midwest farmers. Don’t pretend adding it to your gasoline is any kind of solution.
 Scythe revolution! (permaculture.co.uk)12. Electrify or make manual your yard and garden care. This doesn’t amount to a lot of oil (and is not officially for travel) but let’s tackle gas-powered lawnmowers, leaf blowers and snow blowers anyway since they’re noisy and polluting. Sweeping and raking are moderate forms of exercise (like walking) that are extremely good for you and don’t take much longer than oil-powered leaf blowers. Instead of a gas-powered lawnmower, get an electric mower, a push mower, or, if you want to really freak out your neighbors, a European scythe. Now I have never scythed, but it looks so amazing that I’m on the verge of getting one, and I don’t even have a lawn. As for snow, don’t use salt or chemicals; they’re terrible for the environment. Sweep or shovel small areas; use electric snow blowers for larger ones. For really large areas, get an electric tractor with a snow shovel attachment or convert a gas garden tractor to electric. If you happen to be redoing your driveway or sidewalk anyway, put in a hydronic snow melt system and you’ll never worry about snow again.
13. Get an electric car. Yes, this is last. There is a lot of embedded oil in an electric car, as we’ll talk about under stuff. And merely electrifying your VMT won’t improve your health, it won’t increase your joy, it won’t improve your neighborhood, it won’t save you oodles of money. An electric car will still cause traffic and congestion, and it’ll still prevent others from enjoying a car-lite lifestyle because it hogs public space, it’s fundamentally a death machine to bicyclists and pedestrians, and its need for parking pushes destinations further apart. But it’s better than buying oil, and for all but the most coal-intensive states (West Virginia, Kentucky, Wyoming) it’ll produce fewer greenhouse gases than driving a vehicle with a grossly inefficient internal combustion engine. (All internal combustion engines are grossly wasteful and inefficient, every single one.)
Oil in Your Other TravelLong distance travel is my downfall. My husband and I have squeezed our other categories down pretty well, but my kids now live across the country, and I love to travel. What to do? Here are some options.
1.) Learn to love long distance trains. Yes, they’re more expensive than flying. Yes, they take more time. Yes, Amtrak has its problems. The good news is long distance trains can give you lots of undistracted time to work (great for writing), the scenery is often spectacular, and you’ll gain an appreciation of America that is hard to describe and hard to get any other way. View long distance trains as an adventure, embrace their quirks, and if you’re going overnight, do yourself a favor and get a sleeper. 2.) Take medium distance trains instead of short hop flights, especially the Northeast Regional electric trains between Boston and Washington DC. Seriously, this is easy. Just do it. Other good regional lines, often with evocative names, mostly financed by the states they pass through: The Capitol Corridor (San Jose, Oakland, Sacramento), the Pacific Surfliner (San Diego, LA, San Luis Obispo), the Amtrak Cascades (Vancouver BC, Seattle, Portland, Eugene), the San Joaquin (Oakland, Sacramento, Bakersfield), the Missouri River Runner (Kansas City, St. Louis), the Heartland Flyer (Oklahoma City, Fort Worth), the Keystone (New York, Philadelphia, Harrisburg), the Empire Service (Buffalo, Albany, NYC), the Ethan Allen Express (Rutland, Albany, NYC), the Vermonter (Essex Junction/Burlington, Springfield, NYC), the Downeaster (Boston, Portland, Brunswick) and the lines connecting Chicago with Milwaukee, St. Louis, Carbondale, Quincy, Grand Rapids, Port Huron, Indianapolis, and Detroit. 3.)Fly on airlines that use biofuel. Granted, this is a short list at the moment, encompassing just United Airlines between SF and LA, and only 30% biofuel at that. There are rumors that Southwest Airlines will start using biofuel as well. These biofuels aren’t the scam ethanol is and will likely be more expensive than oil-based jet fuel. Let airlines know you will actively seek out flights powered by biofuel.
 Walk it! (drawntheroadagain.com)4.)Consider oil use in vacation destinations. Is there a way to go somewhere fun via train or a long-distance bike ride? Can you have as much fun closer to home? Have you seen all the great things in your own state or those states nearby? How about a staycation in a fancy hotel in your nearest city? I met a man this fall who was walking the 21 missions in California, roughly following the old Spanish El Camino Real. He’d started in San Diego and had three left to go when I met him with his backpack and walking stick as I sat on the bench in front of my house. All sorts of non-oily adventures are possible! 5.)Combine destinations. If you can link two trips to nearby destinations, that will reduce some air miles. 6.) Drive instead of fly, but with a full car. The more passengers in your car, the less oil attributed to you personally. If your car has empty seats, consider long distance rideshare such as Ridester or Rideboard. 7.) Long distance buses. Not my favorite, but they’re often good value. I don’t know if SleepBus is going to catch on, but maybe. 8.) Electric ferries. Not too many in the US, but Norway has them. 9.) Hybrid ferries. Take them to Alcatraz and maybe other places soon.
Now I know you’re not going to shed your junk miles, move to a ten-minute neighborhood or replace all your flights with trains tomorrow. It may, in fact, take you years to squeeze the oil out of your travel. I suggest for 2017 that you adopt the task as a kind of hobby, (after all, we don’t mind spending time and money on our hobbies) and get creative, flexible and even adventurous about the options available. You may be surprised by the life benefits that cheap oil has been hiding from you.
Stay tuned for Part 3, Wringing Oil from Your Food, Stuff, Heat and Everything Else !
Note: if you’re under 70 and can’t comfortably walk at least a mile without getting tired, you have a health emergency that you should treat with the same urgency as you would an asthma attack or a foot with gangrene. Assuming your doctor hasn't forbidden you all physical activity, here’s your sixty-day program to walk with ease. Walk for five minutes today and five minutes tomorrow, no matter how slowly. Get outside if at all possible. Steps to and from your car or around the house don’t count! Increase to ten minutes for days three through seven. Walk fifteen minutes days eight through fourteen, and then twenty minutes every day for the following two weeks. Month two, move on to thirty minutes a day without fail. By the end of that month, your health will be so much better, you’ll be amazed. Start today. I’m serious.


December 14, 2016
Make Your Life Less Oily in 2017: Part I, Taking Stock

The United States is the oiliest country on the planet. We Americans consume more oil by far than any other country. Next is China, but even with 1.4 billion people they’re a distant second. Americans, in fact, consume 20% of the world’s oil each year, over 19 million barrels a day. Last year US oil consumption worked out to 923 gallons per man, woman and child. Oil is a worldwide commodity. Because its consumption is so enormous, US demand drives both the price of oil and the profits it produces. And for all the talk of the US being energy independent, the US also imports the most oil of any country in the world. (China, again, is a distant second.) Americans are literally and figuratively in the driver’s seat of world oil consumption. (Canadians actually use more oil per person, but because their population is so much smaller, they have much less of an impact.)
Now if funneling profits and power to multinational oil corporations and Saudi Arabia doesn’t bother you, read no further. If you’re fine with indirectly funding terrorism, or if having a future Secretary of State who is the head of ExxonMobil doesn’t freak you out a bit, this article is not for you.
But if you stand with Standing Rock, read on. If the stonings and beheadings in Saudi Arabia trouble you, if you’re not fond of crude oil spills every other day in the US, if you’re not a fan of tar sands and fracking, or if you understand that the only way to prevent climate catastrophe is to leave much of what’s left of fossil fuels in the ground for at least the next couple centuries, then you might find this two-part article useful.
 Pinguid livingLet's face it, America, our lives are saturated in oil, and reducing that pinguidity (there’s a word for you!) is not an easy task. We’ve got oily transport, oily heating, oily beverages, oily food, we drive on oily roads, and our homes are full of oily stuff. How do we get some or all of that oil out of our lives?
Most of our consumption of oil is so deeply embedded in our way of life that we're unconscious of it or believe there's no alternative. The antidote is to first make that consumption conscious and then get creative with alternatives, tailoring them to our specific situations. Here’s the good news: most of the steps you can take to purge oil from your life will make you healthier, happier, and your household more resilient! If you have kids, many of the steps will make them healthier, happier and perform better in school! Many of the steps will also make your community healthier, more prosperous, and more resilient. And if your prosperity is linked to your community’s prosperity, it will make you more prosperous as well.So let's bring the unconscious to the light of day. Just how oily is your life?
How we move ourselves around this planet matters. A lot. And our driving is the big kahuna. Two-thirds of American oil consumption is from transportation; close to two-thirds of that we do in cars. We can freak out about freight and air travel, but it's the daily moving about in private cars powered by internal combustion engines that is the single biggest oil slurper in our lives. To examine your oil consumption, including how oily your travel is, I've created this nifty calculator to help put a number to it. You fill in the orange boxes (replacing values if applicable), and the green boxes will calculate your oil gallons consumed. In some of the orange boxes I've put average American values. You can decide how appropriate they are for you. Be sure to scroll to the bottom of the frame to see your total. Remember, we're not looking at all energy consumed, nor are we looking at our carbon footprint. Our laser-like focus here is concentrated solely on oil and its products.
A few words about oily home heat. Only 8% of US households use heating oil. If yours is one of them, you probably have records of how much you use, but, for example, the average Massachusetts heating oil home uses 987 gallons per year. Only 5% of homes use propane, and only 31% of all propane comes from oil refineries. (The rest is from natural gas.) Put in total propane you use and the calculator will take 31% of it. An average Massachusetts propane-heat house uses 886 gallons a year.
 Why? Why? Why?For oily beverages, how many PET plastic bottles of water or soda do you consume a week, on average? Your fellow citizens consume 4.5, using up 9.1 gallons of oil a year.
Plastic bags. The average American throws away 10 a week. That's another 2.2 gallons of oil per year. If you throw away more or less, adjust accordingly.
 Non-oily 1 week of food in Bhutan (photo: Peter Menzel, Hungry Planet)How about food oiliness? The average American consumes one ton of food a year. No, I'm not kidding. Each pound travels an average of 1500 miles to get to you. No, I'm not kidding. The oil it takes to truck this ton of food to a store near you comes out to 44 gallons a year. You eat local, you say? If you got 100% of your food from an average distance of 150 miles, that would come to 4.4 gallons of oil a year. Remember, this in no way includes all the fossil fuels embedded in your food since natural gas is the number one energy source used by fertilizer and grain drying, and food processing and refrigeration largely use electricity.
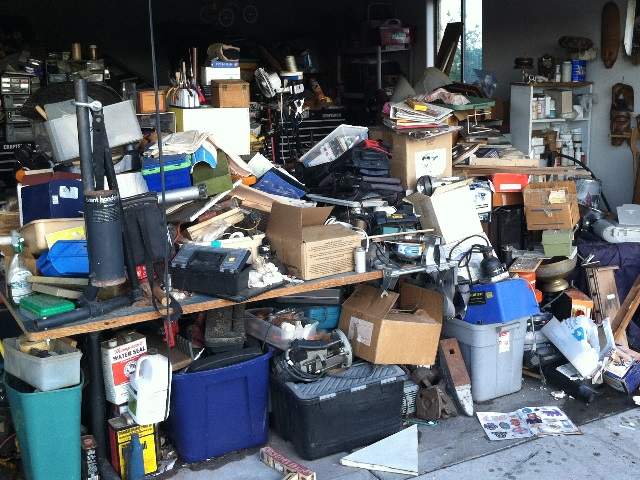 Stuff and more stuffHow about all the rest of the bejeebus amount of stuff we buy in a year? It weighs roughly another ton per person. No way, you say! Remember, this ton includes 125 lbs for your half of one car (3500 lbs divided by 14 years of car life), and your share of household appliances divided by their useful life. What's worse is that to make this 2000 lbs of stuff for you, industry in the US and other parts of the world moves, mines, extracts, shovels, burns, waste, pumps and disposes of one million pounds of material. All this material manipulation and far-flung worldwide supply chain of raw materials, feedstocks, and components uses a lot of oil. (Also a lot of natural gas and a fair amount of electricity. But let's just consider oil.) A low estimate is 1/2 gallon per ton. That makes 250 gallons of oil embedded in your yearly non-food stuff consumption. This number includes all the rest of the plastic and any polyester or nylon you consume in a year and the ridiculous amount of packaging that your stuff comes in, but it doesn't include shipping the final product to you. Let's figure half the stuff is made in the US and comes by truck; the other half is made in Asia and comes by ship, then rail, and then truck. (You can change these percentages.) If you think you consume more or less stuff than the average American, adjust accordingly.
I'm getting tired, and no doubt you are too, of slogging through all this oil, but we'll go just a bit further. Your on-line shopping deliveries. Now the United States Postal Service comes to your house and puts junkmail in your box whether you get anything else or not, so your share of USPS oil (average 500 stops a day, 18 miles, 9 mpg) is a flat 1.25 gallons per year if you live in suburbia regardless of how many packages you get. If you live ex-urban, double that. If you live urban, cut it in half.
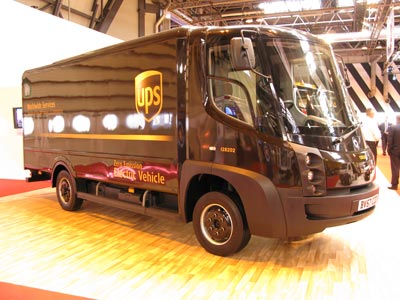 Future Electric Delivery?For Fed-Ex and UPS deliveries, enter the average number of times each one visits you a week, not packages per week. Count all package deliveries you order, including ones you send as gifts, but not ones you receive as gifts. If a large percentage of deliveries are for your household in general, only attribute to yourself your share.
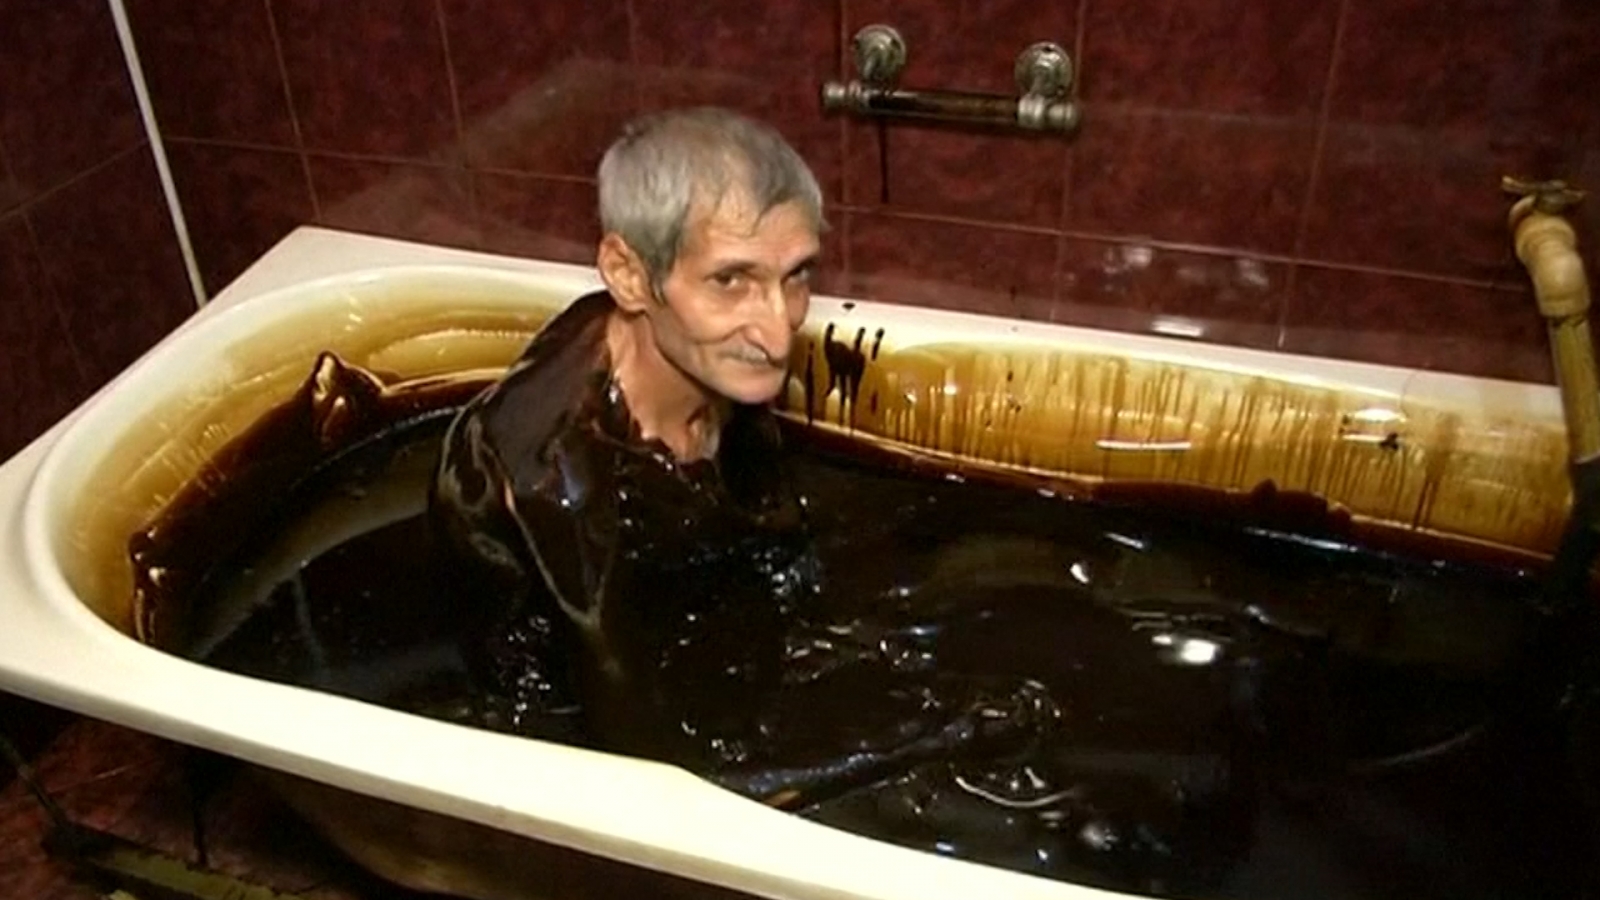 Spa treatmentAnd now you have a final total. Admittedly, this calculator isn't perfect, but I think you'll find it's not bad. It doesn't include asphalt for roads or oil consumed on your behalf by various government entities (roughly another 30 gallons covers both, depending on how many wars we are actively involved in) and numerous other small items like asphalt roofs, detergents, antifreeze and antihistamines, but it does include most of what you're likely to personally impact. Your yearly oil consumption may not fill a swimming pool, but it would probably overflow ten to twelve bathtubs or even a good-sized jacuzzi. So would the oil consumption of everyone else in your household, every one of your neighbors, every one of your friends. For comparison, your average Brit consumes 372 gallons of oil per year, your average Chinese 134 gallons, and your average Bangladeshi 10 gallons.
As you can see, oil seeps through the fabric of our existence even if we never actually see it, its viscous liquor oozing through our daily lives whether we like it or not. So what do we do with all this oil? How do we squeeze the oiliness out of our lives?
Stay tuned for part two!
Note: Gallons. I know, I know, when discussing anything to do with energy, joules or even BTU's would be better, but most people have little intrinsic understanding of either, while nearly everyone knows what a gallon is. Plus the lion's share of transportation data uses gallons. So I went with it.
October 31, 2016
The Population Problem: Not as Bad as You Might Think
 The EssentialsFirst the good news: great progress has already been made! It turns out women around the world are on board with zero population growth! It turns out zero population growth is not all that difficult or expensive to achieve! The bad news: the people with wealth and power in the world are largely uninterested in funding it.
 Ok, let’s back up. The rapid expansion of human population past the finite limits of what our planet can support is a messy business if there ever was one, full of politics, religion, and basic human needs and desires. People worried about the fate of the planet like to despair about population growth to the point of paralysis. Why lift a finger to avert the climate and energy-depletion disaster ahead of us when overpopulation will do us in however much we insulate our homes, change out our light bulbs, ride our bikes, etc.
But the situation is not nearly so hopeless. Of the 224 countries in the world, the population growth rate is negative in 34 of them, including Cuba, Germany, Greece, Hungary, Japan, Latvia, Lithuania, Poland, Romania, Russia, and the Ukraine. These countries are not small potatoes. Russia and Japan are the ninth and tenth biggest countries in the world. (Note: population figures and most other data in this blogpost are from the CIA World Factbook, much of it recently updated for 2016.)
Let’s examine the essential drivers of world population growth: births per woman, mother’s mean age at first birth, and mean life expectancy.
Births per woman. Here’s the good news. This number has been dropping worldwide, falling from 5 in 1960 to 2.42 in 2016. In developed countries, the replacement fertility rate is generally considered to be 2.1 births per woman. (This accounts for those children who, through disease or accidents, do not reach reproductive age.) In very poor countries, the replacement fertility rate can be much higher. More good news: in a study of 40 countries, fertility rates between 1.5 and 2.0 are shown to generally bring economic benefits that lead to a higher standard of living.
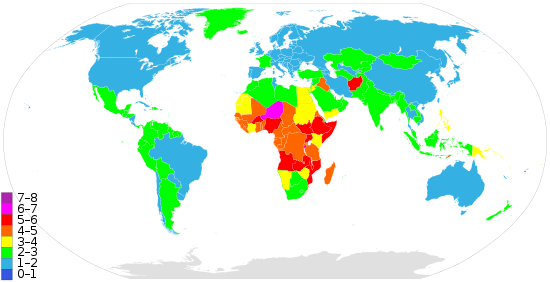 Births per woman by country (green good; blue better!)Births per woman in the US is now at 1.87, well below the replacement rate. But this number is actually high for a developed country. Out of the 224 countries in the world, 82 have lower fertility rates than the US, including developing countries such as Vietnam, Iran, Chile, Uruguay, Brazil, China, Thailand, and Cuba. Across the entire world, 136 countries are below 2.1 replacement rate fertility. That leaves just 88 countries to worry about.
I find the 80/20 rule useful in dividing big problems into smaller ones. In this case, 80% of the world’s population resides in the 34 most populous countries. Of these 34, eighteen countries already have fertility rates below the replacement rate of 2.1 (Brazil, China, Columbia, France, Germany, Iran, Italy, Japan, Poland, South Korea, Russia, Spain, Thailand, Turkey, Ukraine, United Kingdom, United States and Vietnam.) No need to worry about these countries.
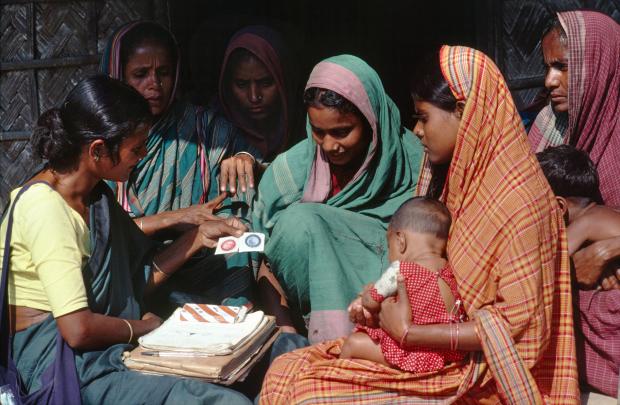 Bangladeshi feat (photo: Mark Edwards)Of the sixteen that remain, six countries have made great strides and are very close to the replacement fertility rate (and may already be below their own replacement fertility rate): Argentina (2.28), Bangladesh (2.19) Indonesia (2.13), Mexico (2.25), Myanmar (2.15), and South Africa (2.31). Birth control use is widespread in these countries, from 46% (Myanmar) to 72% (Mexico). These countries are likely to trend below 2.1 by 2020 or sooner. A special shout out to Bangladesh where a large percentage of the country lives on less than $2 a day. Their achievement in reducing their fertility rate has been so remarkable that they should probably be the ones now training everyone else how to do it.
That leaves ten countries to worry about. Of these, six have cut their fertility rate by at least half over the past 50 years: Algeria (2.74), Kenya (3.14) India (2.45), Pakistan (2.68), Egypt (3.53) and the Philippines (3.06). These countries could still use encouragement and financial support but they are not where the biggest part of the problem lies.
That leaves just four countries that need heavy-duty work on the fertility rate front: Tanzania (4.83 births per woman), Nigeria (5.13), Ethiopia (5.07), Congo DR (4.53). It’s not that these countries have made no improvements; they used to range from 6 to 7 births per woman. It’s just that they still have a long way to go. But worrying about four countries is much, much easier than worrying about 224. These four nations comprise 422 million people. Even within these countries there are bright spots. For example, in Addis Ababa, the capitol of Ethiopia, the fertility rate is already below population replacement levels.
 Early Birth Control ClinicThe task of reining in the fertility rate in these four countries seems daunting. Indeed, for decades many have insisted there was nothing to be done about over population because women would always have as many babies as they could. It turns out, however, that when given education and access to voluntary contraception, women all over the world--of all races, of all religions, on all continents--choose to have small families. Indeed, some women choose to have no children at all. This is how birthrates have fallen all over the world, even in Islamic countries like Turkey, Iran, and Bangladesh, even in Catholic countries like Poland, Mexico and Brazil. Perhaps this shouldn’t be a surprise since pregnancy and childbirth are no cakewalk; in fact, in some parts of the world both are quite dangerous. And women have long known that it’s easier to successfully raise children to adulthood the fewer one has to tend. In any event, the fact that, when given a choice, women prefer small families is great, great, stupendous news. If women didn’t have a natural predilection for small families, if we had to fight against women’s innate desires to avoid calamity, the world would indeed be in trouble. The true problem we face is that in developing countries 225 million women want to delay or stop childbearing but are uninformed about effective contraception or lack access to it.
Again, so we’re clear:
Education + Contraception + Women’s Innate Preference for Small Families = Low Fertility Rate.
What about men, you might ask? Don’t they matter to population growth rates? If men stopped having sex with women altogether, they might, but this appears to be against the innate preference of most of them. When men use birth control or are sterilized they matter to population control, but male sterilization is a hard sell worldwide, and male condoms, while cheap and better than nothing, have a high failure rate. Where men really count is insofar as they prevent women from getting educated or keep them from access to reliable forms birth control. This is not to say boys and men shouldn’t be educated. This is not to say it wouldn’t be helpful if men wanted small families, too. This is not to say it wouldn’t be great if we could come up with some kind of long-acting reversible form of birth control for men. But right now, it’s women and girls who impact fertility rates and population growth in a big way.
Now you might think this can’t be, that low fertility rates are an outcome of wealth not education. Women in poor countries have lots of children; women in rich countries don’t. But this ain’t necessarily so, as we can see when we plot the data from our 34 most populous countries:
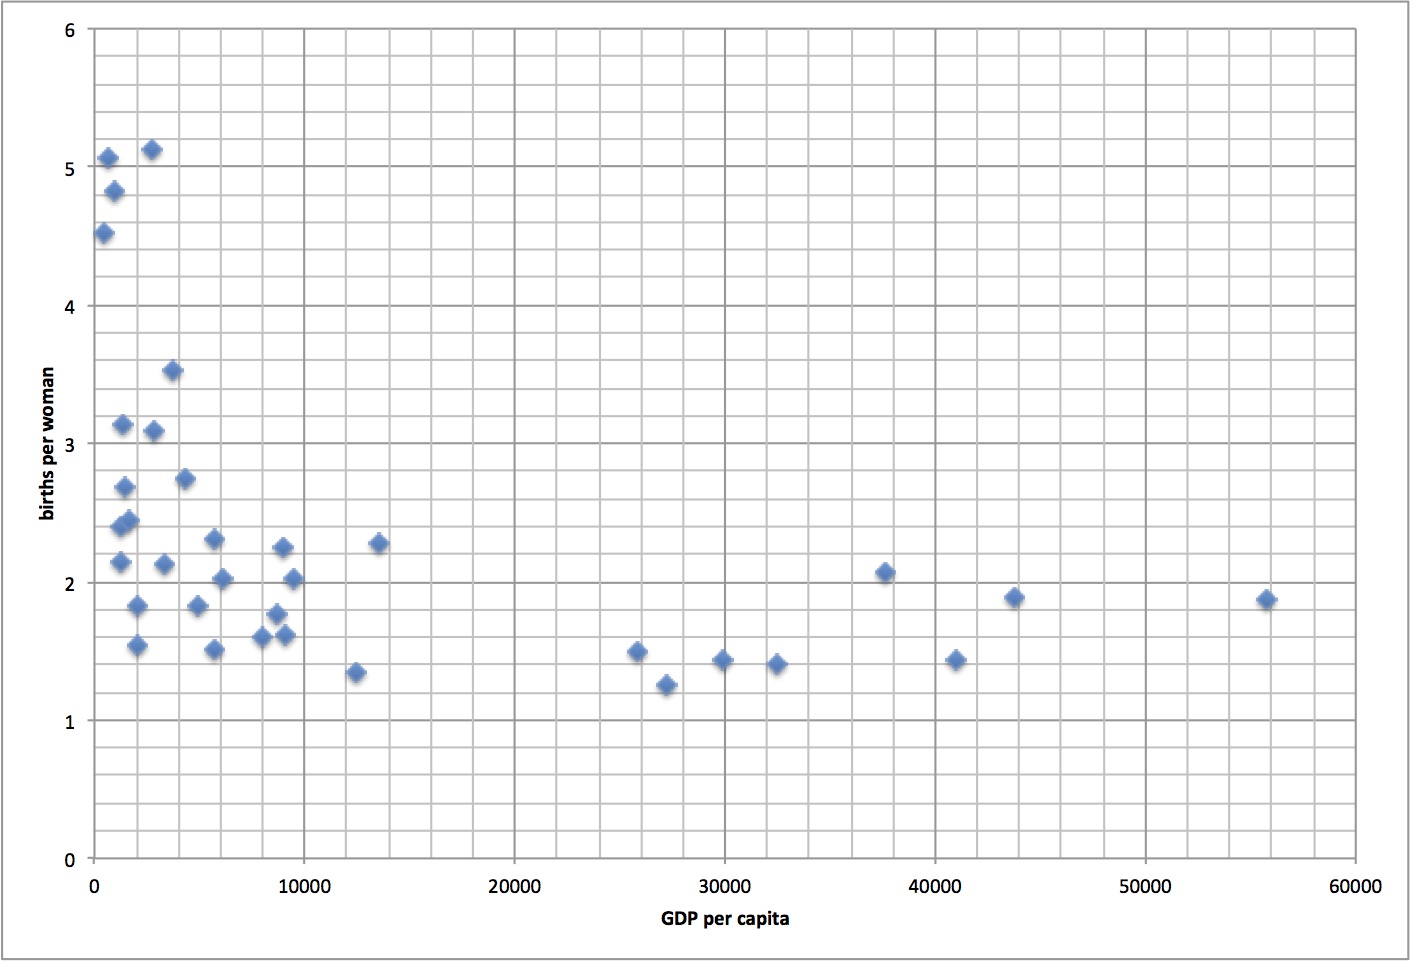 Births/Woman vs GDP/Capita
High GDP/capita countries have low fertility rates, but so do lots of low GDP/capita countries. What is predictive of fertility is women’s education, especially literacy.
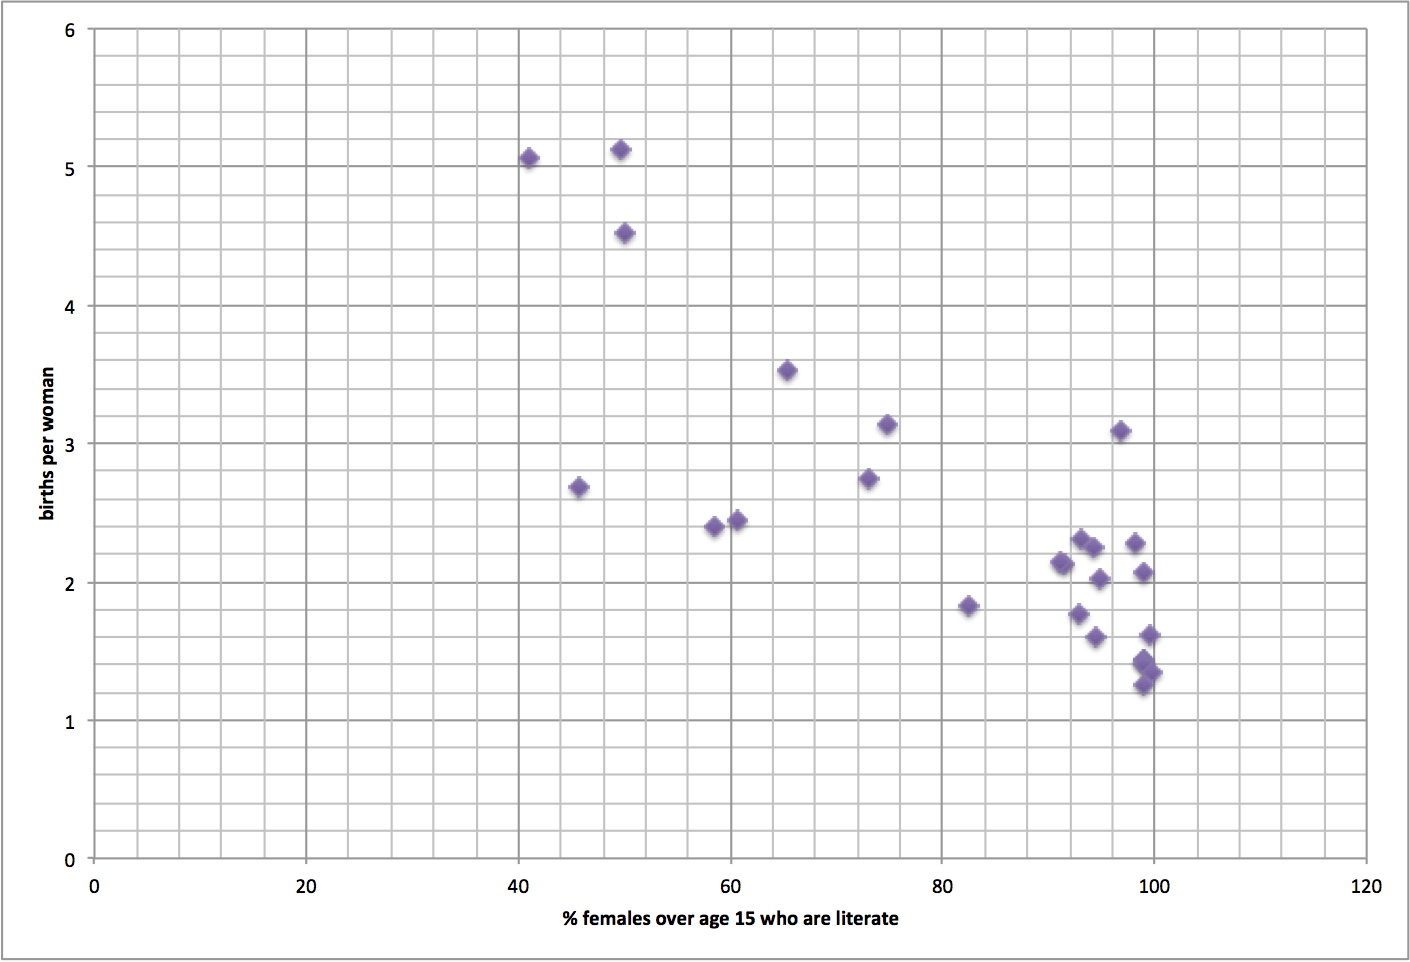 Births/Woman vs. Female Literacy Rate
Educate girls and young women, births per woman go down.
 Notice a pattern? (UN data 2000)
Mean Age at First Birth. Why is this important? Imagine a cohort of ten women. If each them has a daughter at age 20 and a son at age 22, and if all their daughters do exactly the same, at the end of 102 years, 120 new human beings would result, with the last set of sons born in year 102. Now let’s imagine this same cohort, but change the women’s age at their children’s births to 25 and 27. At the end of 102 years, 100 new human beings would result, with the last set of sons born in year 102. A twenty percent difference! So you can see, spacing out the generations results in a substantial reduction in population growth.
For our 34 highest population countries, the mean age at first birth ranges from 18 to 30.3. What promotes a higher mean age at first birth? Well the number of years girls spend in school seems to correlate.
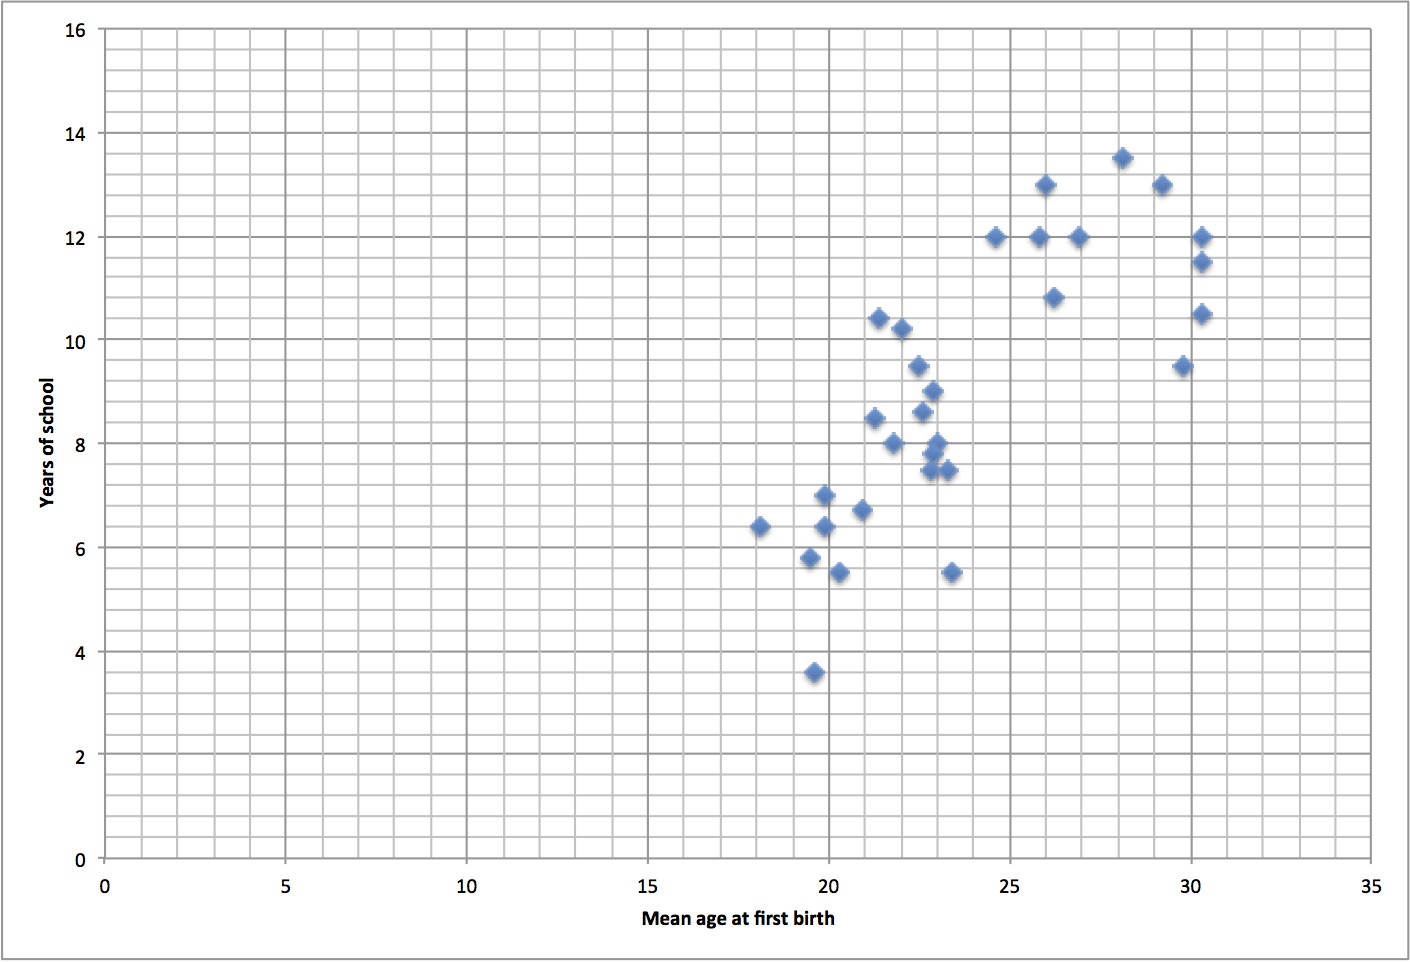 Years at School vs. Mean Age at First Birth
If we want to raise mean age at first birth, it’s also a good idea to reduce the teen birth rate. This usually involves a combination of keeping girls in school and giving teens access to contraception. In developing countries, the average cost to educate a child for a year of lower secondary school with reasonable class size is $339. The average cost to educate a child for a year of upper secondary school with reasonable class size is $738. (It turns out children all over the world learn little when there are fifty kids per teacher.) Thirteen years of education for a child is roughly $5420, which comes out to $417/year. The cost to provide a woman with contraception in a developing country runs roughly $18/year. So let’s say 13 years of education and 15 years of contraception. Total lifetime cost: $5690.
 Technology that mattersOut of the 422 million people in these four nations most in need, roughly half are women, or 211 million. All these countries skew young with a median age of 18 – 19. This puts the number of girls in these five countries between the ages of 5 and 18 around 76 million. Right now roughly half of these girls don’t go to school at all. The cost to educate all 76 million of these girls for one year would be $31 billion. The cost to provide one year of contraception for 80% of the 90 million women between the ages of 15 and 30 in these five countries is $1.3 billion. So $32.3 billion a year for the next ten years is what is needed to get the world’s population growth problem under control.
 $32.3 billion a year. This may seem like a lot, but it’s really not. It’s just .04% of the world’s annual GDP. No, the decimal point is not wrong. The cost to make significant headway on over population is just 4/100ths of a percent of the world’s annual income. Heck, it’s less than 2/10ths of a percent of US GDP. The US plans to spend $26.2 billion in foreign humanitarian and military aid in 2017, but 29% will go to just five countries: Israel ($3.1 B), Egypt ($1.46 B), Afghanistan ($1.25 B), Jordan ($1 B), and Pakistan ($.74 B). The African four that need the most help will receive only $2 billion in total, less than Israel will receive alone.
 Excellent investmentIn 2015, the US spent $598.5 billion on its military. If we took roughly 6% of that and applied it to girls’ education and women’s contraception in these four desperately poor African countries annually, we would turn around the gnarliest part of the world’s population problem in short order.
Let’s look at it another way. If the 967 million citizens of twenty very rich countries (New Zealand, Norway, Australia, Switzerland, US, Ireland, Netherlands, Sweden, Austria, Germany, Denmark, Canada, Belgium, France, UK, Finland, Japan, South Korea, Italy and Spain) kicked in just $34 per citizen a year, cataclysmic disaster for all of humanity could be averted. That’s nine lattes at Starbucks.
Education + contraception. It’s not brain surgery; it’s not pie-in-the-sky geo-engineering. It’s cheap, it’s low tech, it works.
Now let’s examine mean life expectancy. This is the factor that has been masking both the drop in fertility rates and the rise in mean age at first birth in countries all over the world. As people live longer they increase the population. For example, imagine an island where one person is magically born each year. If each person lives seventy years, at year 70 this population would reach steady state, where one person would be born for every person that dies. If each lives for 75 years, then the steady state population would be reached at year 75 with 75 people. So as the median lifespan inches up, it causes population growth. But the growth is not geometric like fertility rate growth is, and it won’t continue forever. As countries progress, lifespans increase rapidly, but then they reach a plateau, after which increases happen slowly, if at all. In addition, countries that reach longer lifespans tend to do so concurrently with the education of women and higher mean age at first birth. This means, remarkably, that the countries on the planet with the longest of lifespans also have well below replacement fertility birthrates. Eventually the deaths in that country will exceed births, and population will decline. Which is what we see happening in Japan and Germany today.
 What is the carrying capacity of Earth? I’ve seen lots of numbers, but let’s imagine a relatively pleasant planet with adequate room for other species to exist (beyond zoos), where every single person alive enjoys the advanced standard of living of, say, the average Swiss citizen today. The ecological footprint of the average Swiss is 5.8 hectares. The biocapacity of the planet to support human life is equal to roughly 12 billion hectares. (This includes all biologically productive land and water that supports significant photosynthetic activity.) Figure at least a third of that should be set aside for other species. But also figure humanity will put its collective mind to the task and outdo even Swiss efficiency and ingenuity to get that footprint down to 3 hectares per person with still a Swiss standard of living. That would imply that the planet can support about 2.7 billion human beings sustainably in a fairly nice fashion. Everyone eats well, everyone gets lovely health care and education, everyone born can expect to live to the grand old age of 83. And we all live lightly enough on the planet that it can repair and replenish itself and provide for humanity indefinitely. Sound good? But how do we drop down to 2.7 billion people without mass suffering and pain?
You guessed it. Through worldwide education of girls and providing contraception to women. Increasing the mean age of first birth worldwide to age 25 will balance out the rise in lifespans. At the same time, the reduction in fertility rate worldwide, to just under the replacement rate, will give us a 1% per year population decrease. Imagine that for every hundred people who die, ninety-nine come into the world. The incremental difference would be small, but it would add up.
So say we stop being shortsighted and stupidly cheap. Say we manage to stabilize world population at 8 billion. And then, through voluntary birth control and education of girls, we start decreasing population by a mere 1% a year. Nothing traumatic, nothing humanity couldn’t take in its stride. (Yes, we’d need a new non-growth based economic system, but we’re going to need that anyway.) In just twenty years, we’d be down to 6.5 billion. In fifty years we’d be down to 4.8 billion. And in 108 years, we’d achieve 2.7 billion on a healthy planet, with plenty of food, clean water and a high standard of living for all. How we get there is by educating girls and providing contraception to women, something that we already know how to do and that doesn’t cost much.
What can I do, you might say, besides encourage my government to immediately start spending money on education and contraception in Ethiopia, Nigeria, Tanzania, and the Democratic Republic of Congo?
Lots of things.
1) Put some space between generations. Don’t have children before the age of 25. Don’t be in a hurry for grandchildren. Encourage your daughters to stay in school and make sure they have access to the very convenient forms of long-acting reversible birth control available these days. Spread the word that age 25 is plenty early to become a parent. 2) Support sex education and contraception for teens. Yes, no one likes teens having sex except the teens themselves, but preventing teen pregnancy is paramount. Long-acting, reversible contraceptives are also the best way to prevent abortions. 3) Donate money to girls’ education efforts in Africa via organizations such as Camfed, Share in Africa, or Enhance Worldwide. 4) If you don’t want children, don’t have them! Don’t let anybody guilt-trip you into them. If you want just one kid, that’s fine! Only children do very well in life, often better than children with siblings. If you do decide to become a parent, be a very good one. 5) Never shame or guilt-trip anyone into having children. Never imply it’s selfish not to have children; never imply that it’s sad or tragic. Not everyone is called to be a parent, and that’s a good thing. And some people who have children would be far better off if they hadn’t. 6) Don’t boo hoo or forecast doom when a nation has negative population growth. Celebrate! They are doing the world a favor. 7) Don’t focus on immigration. We are all on this planet together. The point is to reduce the number of births wherever they happen. We shouldn’t be building walls, we should be educating girls and providing women with contraception. (If you’re an American worried about Mexico, consider contributing to an organization such as Mariposas Mexico that supports the education and development of young women in rural Mexico.) 8) Ensure your country offers enough support to the elderly so that children aren’t essential to old-age survival. 9) Support dog parks in your town/city. This may seem crazy, but it isn’t. Many people have pets instead of children. This choice should be honored and supported. 10)Advocate for making long-acting, reversible contraception and voluntary sterilization free or nearly free in your country. Support organizations that offer free or nearly free long-acting, reversible contraception and voluntary sterilization. 11)Treat the children in your community like the wonderful, precious beings they are. Help them grow up to be joyous, secure, principled adults who will create and then prosper in the harmonious, equitable future they will inhabit.
September 5, 2016
The Renewable Energy Future Is Here--It's Just Unevenly Distributed
 Renewable MonstersElectricity production data is out from the US Energy Information Agency for the first half of 2016. Nation-wide, renewables (including distributed solar but not hydro) accounted for 10.2% of electricity sales, up from 8.4% the first half of 2015. The increase in renewables nationally is making headlines, but it’s even more instructive to drill down to the state level where we find some states are making phenomenal headway, and others are making none at all.
I like to look at renewables as a percent of electricity consumed rather than generated, because if a state generates little of its own power, it may still be responsible for ginormous carbon emissions that it’s simply shoved on to someone else. On the flip side, some states are already meeting a high percentage of their electricity needs via renewables, a fact masked by the large amounts of electricity they generate for export to other states. In addition, locally-produced power means lower transmissions losses, reducing the amount of electricity needed to be generated in the first place.
So, let’s dive in. First we’ll evaluate non-hydro renewable electricity production, including distributed solar, as a percent of total consumption for the first half of 2016. The top states are Iowa (46%), North Dakota (43%) and Maine (40%). Iowa and North Dakota both burnt coal in order to export electricity, although the amount dropped by 32% in Iowa and 13% in North Dakota. The next two states that have really stepped up renewable production as a percent of electric consumption the first half of this year are Kansas (39%) and Oklahoma (34%). Both of these states also burnt coal in order to export electricity, but much less than in 2015—21% percent less for Kansas and 44% percent less for Oklahoma. Overall the US burnt 20% less coal to produce electricity the first half of 2016 over the first half of 2015.
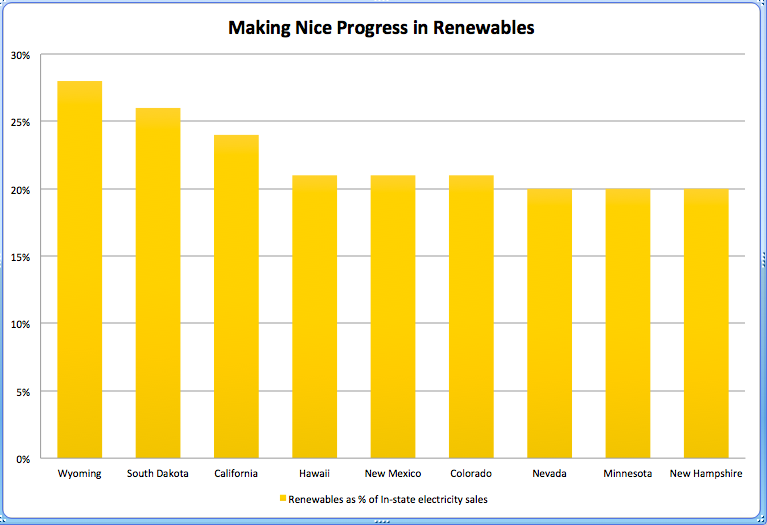 Looking good!The second tier of states in renewable production as a percent of electricity consumption are: Wyoming (28%), South Dakota (26%), California (24%), Hawaii (21%), New Mexico (21%), Colorado (21%), Minnesota (20%), New Mexico (20%) and New Hampshire (20%.) Where is Texas, you might ask? Even though Texas has increased its renewables production by the largest absolute amount (i.e. phenomenally), because it’s such a populated state, it’s still only meeting 17% of its electricity consumption via renewables, putting it in the third tier of states, as outlined in the table below.
Oregon 19% Vermont 18% Texas 17% Idaho 16% Montana 16% Nebraska 13% Washington 12% Illinois 10%
For the US as a whole, renewables (including distributed solar) made up 10.2% of electricity sales the first half of 2016 compared to 8.4% the first half of 2015.
Though many states have made considerable progress with renewables, some have not. States that have made a particularly poor showing (2% or less of their electricity from renewables) are Ohio, Missouri, Delaware, Kentucky, Tennessee, New Jersey, Massachusetts, Rhode Island and Florida. I will point out that Missouri, Delaware, Kentucky, Tennessee and Florida have solar insolation levels equivalent to one of the sunniest countries on earth, Spain. Ohio and Missouri have decent wind in the western halves of their states, while New Jersey, Massachusetts and Rhode Island have access to substantial wind offshore.
Due to better rainfall, 2016 has been a good year for hydro. While hydro has its own environmental problems, it provides a nice adjustable baseload that can offset the intermittency of renewables, as well as potential for large-scale energy storage via pumped hydro, although this comes with a 20% efficiency loss. If we add hydro to renewables, we get a bit different picture. Our stellar states then become:
 Lots of juice
Yes, both Washington and Oregon created more electricity via hydro plus renewables than they consumed the first half of 2016. Unfortunately both states also burnt small amounts of coal so that they could export additional electricity. Montana and North Dakota burnt a substantial amount of coal so that they could export electricity. Any state that wants to reduce its carbon emissions should not import electricity from states that burn coal. I’m looking at you, California, the greatest electricity-importing state in the country. Although, to be fair, each year California is producing more of its own electricity and importing less. The first half of 2016, California imported 9% less electricity than the first half of 2015.
Other states that produced more than a third of their domestic electricity consumption via renewables + hydro the first half of 2016 were:
Iowa 48% Vermont 44% Kansas 39% Oklahoma 39% California 36% New Hampshire 35% Wyoming 34%
Nationally, the US produced 19% of the electricity it consumed via renewables + hydro.
In order avoid catastrophic climate change, our civilization needs to become vastly more energy efficient (see: Efficiency Is Not the Enemy of Resiliency) and replace fossil fuel use with renewable electricity (see: Obey the Law of Exergy (Time to Go All Electric.)) How much renewable + hydro electricity per capita/day will each state need in order to meet all its energy needs, including heating, cooling, industry and transportation? Currently, if we take all primary energy consumption in the US and convert it to kilowatt-hours, it comes to 230 kwh/capita/day. During the first half of 2016, the US as a whole produced 6 kwh/capita/day through renewables + hydro. Even our very best state, Washington, produced only 37 kwh/capita/day via renewables + hydro. Three other states came close: North Dakota (35), Montana (34), Oregon (34). The next four highest were: Wyoming (26), Idaho (23), South Dakota (22) and Iowa (20.) Sadly, twelve states produced 2 or fewer kwh/capita/day via renewables + hydro: Connecticut, Massachusetts, Rhode Island, New Jersey, Pennsylvania, Ohio, Missouri, Delaware, Florida, Maryland, Virginia, and Mississippi. If you live in any of these states, you have serious cause for concern.
Yikes! We’ve got a long ways to go. But it’s not as bad it seems. If we look to Europe, we see that through efficiency many countries enjoy a quality of life arguably better than the US while consuming the energy equivalent of 90 - 120 kwh/capita/day. (see: An Energy Diet for a Healthy Planet .) And some US states are energy intensive largely due to extracting/processing/refining fossil fuels. Without coal mining, oil production, and oil refining, per capita energy use will drop dramatically in energy-gobbling Louisiana, Wyoming, North Dakota and Alaska. Even Texas should see a nice drop.
 Pump it upIn order to integrate a high level of intermittent renewables into the electric grid, every state is going to need substantial energy storage, whether it takes the form of electrochemical batteries, ice, molten salt, hydrogen, flywheels, compressed air, pumped hydro, or seasonal thermal energy storage. Most likely, as the price of wind and solar continue to drop, states will create excess capacity of both forms of electricity production. On windy days, when all grid demand is met, excess electricity can be directed to create hydrogen through electrolysis, which can be used as fuel for ferries or cargo ships, or in the production of inorganic fertilizer. Excess solar capacity, much easier to predict, can be directed during the peak of the day to charge batteries, pump water uphill, heat water in buildings for the evening heating load (winter), or create ice or chilled water in buildings for the evening cooling load (summer.) Early leaders in energy storage are California, New York, Hawaii and Arizona.
The amount of electricity a state will ultimately need in order to efficiently and comfortably meet its energy demand will no doubt depend on its climate, population density, and amount of heavy industry. States like California and Hawaii with low heating and cooling loads might get by with 80 kwh/capita/day, as might states with high population densities that are already frugal energy users, like New York, Rhode Island, Massachusetts and Connecticut. Rural states with intense winters like North and South Dakota may need 120 kwh/capita per day. Still, most Midwest and Rocky Mountain states, home to prodigious wind resources, could easily produce all the electricity they need from wind and hydro, plus have ample for export. Out of thirteen states windy states (MT, WY, CO, NM, ND, SD, KS, NE, IA, TX, OK, MN, MO), eleven of them have already made substantial progress in taking advantage of their renewable resources. Two haven’t. (I’m looking at you Nebraska and Missouri.)
The Pacific Northwest—Oregon, Washington and Idaho--with its hydro and nice pockets of wind should be able to reach 100 kwh/capita/day without much trouble. California and Texas have put the most effort into renewables and produce the greatest absolute amount of electricity from renewables by far. But because their large populations, reaching even 80 kwh/capita/day is going to be an effort. At the moment, both only produce 6 kwh/capita/day by renewables + hydro.
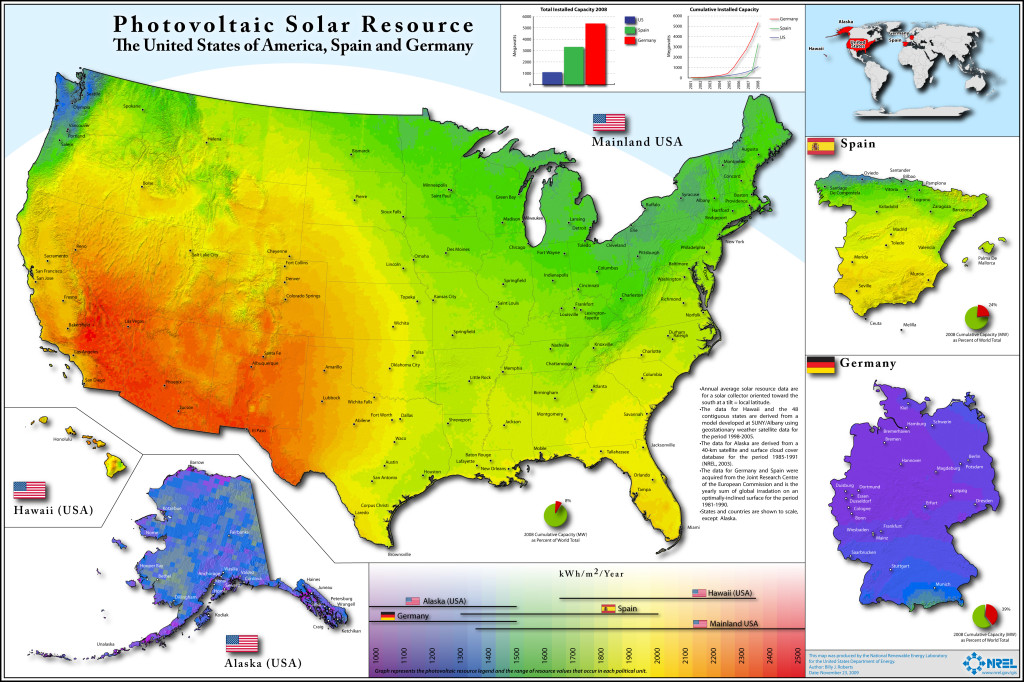 Alaska beats GermanyHawaii has great solar and great wind and pays ridiculous sums for its imported fossil fuels. However much its utilities fight it, I expect Hawaii will be energy self-sufficient within a decade. Remarkably, Alaska has better solar insolation than Germany, but since it also has fabulous wind resources, the odds are high that’s the direction it’ll take.
It’s the South, along with Pennsylvania, New Jersey, Ohio, and Missouri that appear to have the most challenges ahead, mostly because they have poor on-shore wind resources (with the exceptions of western Missouri, western Ohio and pockets of the Appalachians) and, with the exception of North Carolina and New Jersey, haven’t made much of an effort to make use of the really very good solar resources they do have. This inertia will impact their economies hugely over the next decade. Over sixty major corporations have committed to power themselves with 100% renewable energy, including Google, Hewlett-Packard, Adobe, Johnson and Johnson, Mars, Microsoft, Nike, P&G, Salesforce, Steelcase, Unilever and Walmart. None of them expect to lose money from this commitment. As a result, some are already choosing to locate data centers and manufacturing sites in states where such energy is available. Although I favor small and medium-sized businesses over large corporations, it’s foolish for states to believe that continuing to burn fossil fuels for electricity will give them any kind of competitive advantage. Seventeen US cities have already committed to 100% renewable electricity by 2030. However, keeping with the trend, none of them are in the mid-Atlantic or the South, except for Ithaca and East Hampton in New York. States without renewable energy can expect to bleed industries, jobs and even population continuously over the next decade.
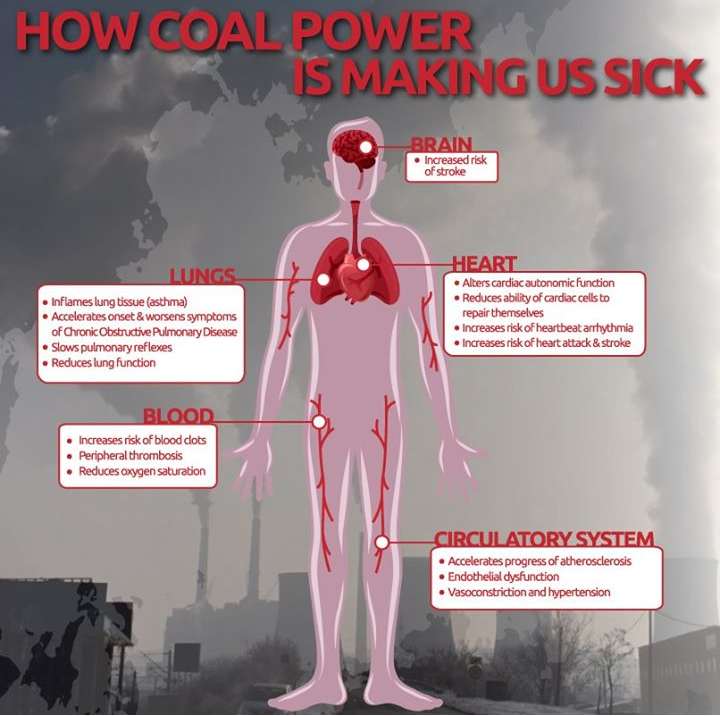 Coal-burning states have long suffered the indirect economic triple-whammy of higher health care costs, higher public health burden, and the environmental degradation that comes with coal power. A study in Michigan found that just nine coal-burning power plants in that state cost Michiganders $1.5 billion in extra health care costs each year. A 2013 study found that each kwh in the US produced by burning coal incurs $.32 of cost in terms of illness, premature mortality, lost workdays, and direct costs to the healthcare system associated with emissions of particulates, NOx, and SO2. (Each kwh from oil incurs $.13 and each kwh from natural gas incurs $.02, although this estimate might be low given the recent natural gas debacle in Aliso Canyon.)
 As to environmental impact, I’ll mention just a few of the many factors. Thermal power plants consume an enormous amount of water and substantially contribute the water-supply stress of states experiencing drought. When these power plants return warmed water to nearby rivers, lakes and oceans, they harm ecosystems and wildlife through thermal pollution. Coal power plants also produce wicked toxic waste in the forms of coal slurry and coal ash that must be meticulously contained in order to prevent toxic heavy metals from leaching into drinking water, metals that cause cancer, birth defects, reproductive disorders, neurological damage, learning disabilities and kidney disease. Unfortunately, not all coal toxic waste is meticulously contained. Indeed, at least 42 percent of coal waste nationally is kept in unlined ponds or landfills, making leaching likely to occur. And then there’s the long-term impact of dumping CO2 into our atmosphere, and the fact that, due to widespread leaks in natural gas infrastructure, natural gas is almost as bad as coal in terms of greenhouse gas emissions. One would think at least coastal southern states would be worried enough about nuisance flooding to try to prevent sea-level rise, but so far no dice.
Energy companies that produce fossil fuels and utilities that burn the stuff make profits at everyone else’s expense. This is a lucrative business model--of course they don’t want to change! Of course they will spend vast sums on denial, misinformation, and campaign contributions to protect their income streams. Legally, corporations must maximize the best interest of their shareholders, not society at large. They must follow the law, but if laws (often written by those they help elect) allow them to wreak health and environmental havoc, is it any surprise that they do so?
 Low hanging fruit aplentyThe price of solar, wind and energy storage is dropping quickly. The levelized cost of both onshore wind and utility-scale solar are already cheaper than all forms of fossil fuel new electric generation, including diesel and natural gas reciprocating engines, gas peaker plants, integrated gasification combined cycle (IGCC), standard coal, and gas combined cycle. They are also both quite a bit cheaper than new nuclear. At the moment we subsidize renewables to even the playing field with fossil fuels only because we subsidize fossil fuels heavily by letting them off the hook on externalities. All these energy subsidies are ridiculously expensive, and, worse, they discourage sensible energy efficiency measures by keeping up the pretense that energy is far cheaper than it actually is. All energy subsidies should go, every single one, but that includes the subsidy of shirking the cost of externalities. If the price of fossil fuels included even half the cost of the negative health and environmental impacts that they impose on society, the US would find itself doubling its energy efficiency with remarkable speed (so much low-hanging fruit!) and transitioning to a largely renewable electric supply within a decade. As it stands, Americans thoughtlessly squander energy right and left, health care costs in the US consume nearly a fifth of our nation’s wealth, Americans have the poorest health in the developed world (largely due to pollution, poor diet, and relying on fossil fuels rather than our bodies to move us even short distances), and environmental costs are left to future generations to pay.
As might be expected, there is wide variation in renewable adoption not only between states but between countries. According to BP’s 2016 Statistical Review of World Energy, the US got 6% of its total energy (not just electricity) supply from renewables + hydro. This puts the US behind 24 of the 67 countries for which BP provides detailed information, including China (11%), Vietnam (22%), New Zealand (38%), Sweden (44%), the UK (10%), Italy (16%), Germany (14%), France (8%), Denmark (25%), Norway (67%), Austria (31%), Switzerland (33%), Turkey (14%), Canada (29%), and Brazil (33%). It puts the US behind 23 countries in terms of renewables as a percent of total energy. Indeed, nine countries in the world obtained 10% or more of their total energy from renewables alone in 2016, and this number is increasing each year. In the US, only 3% of the total energy supply came from renewables alone in 2015.
As you can see, some states (and nations) are leaping into a renewable future like mountain goats bounding across alpine meadows. Other states are moving with the speed of a recalcitrant three-toed sloth. The states out in front on this inevitable transition will have more vibrant, diversified, robust economies. They will also have greater energy security in the face of fossil fuel volatility. (Is there anyone who really expects Saudi Arabia to last as a stable country another ten years?) Just as reminder, it takes a couple gallons of diesel to strip mine a ton of Powder River Basin coal (40% of all coal production in the US.) This might not seem like much, but Powder River Basin coal currently only sells for $8.70 a ton. Last week, a gallon of diesel in the Rocky Mountain states cost $2.48. So 57% of the price of coal is eaten up by just by the diesel used to produce it. Any oil price volatility will have an enormous impact on coal prices and/or coal profitability.
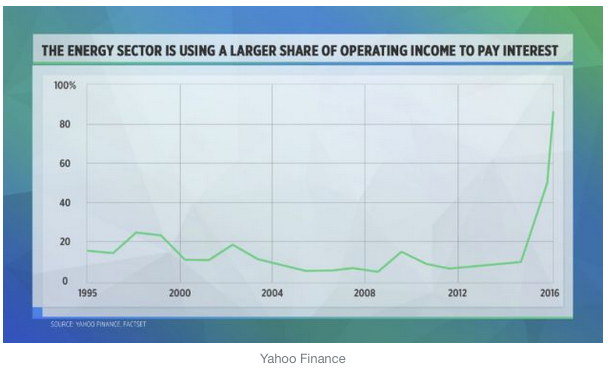 Keep those plates spinningThe Federal Reserve has kept fossil fuel plates spinning the last eight years through endless cheap debt available for sub-prime car loans, corporate stock buy-backs, junk bonds, speculation and even corporate dividend payments. This all works as long as no one is ever expected to pay off debt, just roll it over into ever-increasing amounts new debt. How long a hollowed-out, debt-infested economy can keep going on fumes is anyone’s guess, but when the music stops, states dependent on industries addicted to cheap debt infusions are unlikely to be the ones to thrive.
Food, water, energy and health are essential to a functioning society. (Please note, I’ve specified health, not health care.) The states dawdling on renewables, especially those dependent on burning coal, will suffer heart attacks, pollution, asthma, bronchitis, acid rain and job losses in the near term, and blackouts, brownouts and population loss in the long term. Though renewables are no guarantee of economic vitality, lack of them assures economic decline. Those states with economies heavily dependent on coal mining—Kentucky, Wyoming, Pennsylvania, Montana, and West Virginia--need to read the writing on the wall and embrace the future rather than be dragged into it kicking and screaming.
As Martin Luther King Jr. said, we are all tied together in a single garment of destiny. Everyone alive on this planet a hundred years from now is likely to reap the consequences of climate change and sea-level rise regardless of how much his/her ancestors contributed to the problem. But medium-term, say fifteen years from now, there will variability in outcomes. Just how tattered your state’s part of the garment of destiny will be depends on actions taken now.
August 9, 2016
Reclaiming Public Space--A Peak Experience
 Above it all If you’ve ever been to San Francisco, you’ve no doubt seen the two dramatic hills that punctuate the city’s center known as Twin Peaks. Tourists flock to the vista offered by Christmas Tree Point on the northeast edge, but those in the know climb Eureka or Noe Peaks to get a 360 degree view of the Bay Area, the Golden Gate, and the Pacific Ocean.
Who should go to Twin Peaks? How should they get there? What activities should be available to them once they arrive?
 Primeval PastUntil recently, the answers to these questions were: tourists, bus/car, stare at the view from a concrete and stone terrace, or, if too windy, from behind a car windshield. Perhaps this isn’t surprising because when the road was first built up to Twin Peaks in the 1920’s, the area was remote enough from the rest of the city that driving seemed the only way to get there. Gradually, though, the city encroached on Twin Peaks until now there are just 64 acres of open space left up there full of coastal scrub and grassland, home to brush-nesting birds, rabbits, coyotes and the endangered Mission Blue Butterfly. In fact, Twin Peaks is likely the only part of San Francisco that looks the way it did five hundred and even a thousand years ago. Primeval San Francisco, if you will.
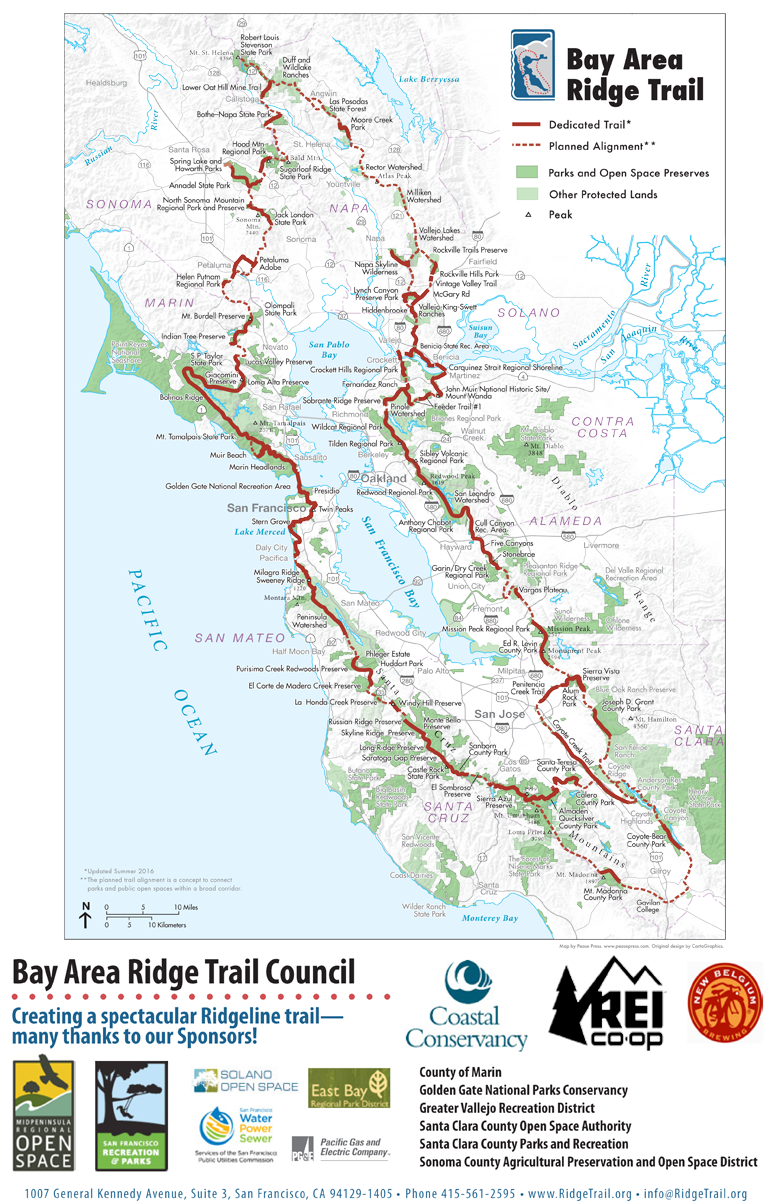 Hike the loopIt turns out that locals like to go to Twin Peaks, too. It turns out that for some locals (like me) it is the largest substantial swath of green space within walking distance. It turns out Twin Peaks is part of the Bay Area Ridge Trail, a proposed 550 mile continuous loop circling the San Francisco Bay, 367 miles of which are currently open to hikers.
Twin Peaks is a mile from my house, all up hill. It’s a lovely walk, as I describe here: Conquer Twin Peaks and Stand on the Rooftop of San Francisco . If you’re visiting San Francisco, I recommend taking Muni to the Castro Station and starting your walk from there. (Another option is to take the 37 bus to Crestline Drive, a few minutes walk from the top.)
 Karl visitsSometimes the top of Twin Peaks is enshrouded in fog (locally known as Karl); sometimes it’s ridiculously windy. Sometimes the sun shines and the air is crystal clear and the views stun even the jaded long-time resident into speechless gratitude at the magnificent splendor, both manmade and natural, before her.
 The walk from my house is lovely because it’s largely car-free, except at the top, where, until recently, a hardy pedestrian had to scramble over concrete barriers, breathe tour bus diesel exhaust, and dodge two lanes of car traffic in order to access the area. Until recently, it was only amidst the rumble of internal combustion engines that you could admire wildflowers and hear birdsong.
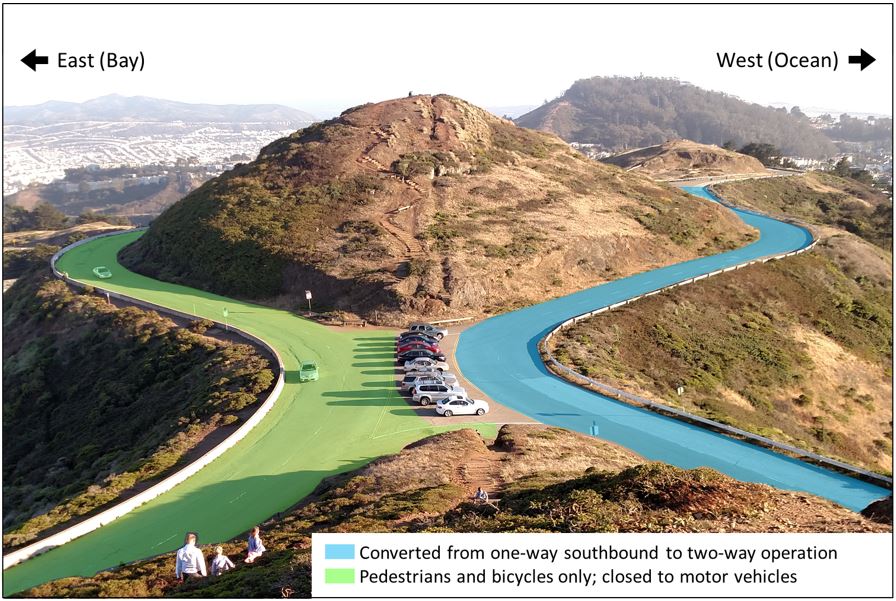 Caution: change aheadA few weeks back the city closed the eastern half of the figure eight on Twin Peaks to cars on a two-year trial basis. As usual when any change in San Francisco is proposed, the end of civilization was at hand, even though cars and tour buses can access the vista at Christmas Tree Point as easily as they could before. Drivers howled, tour bus operators wailed. Some diehards even protested the closure by declaring they enjoyedwalking next to cars.
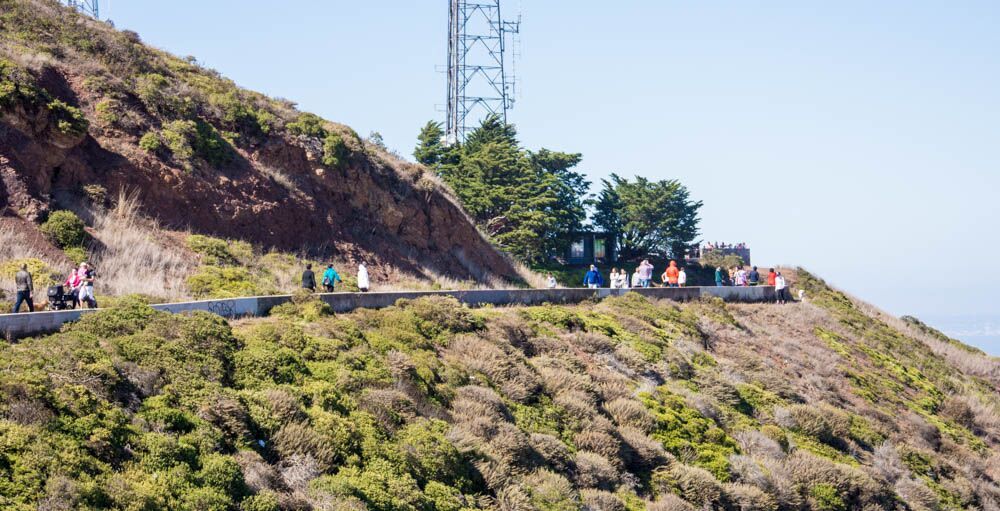 PromenadingMy husband and I checked out the new .35 mile car-free promenade (as it’s now being called) on a sunny, windy Sunday afternoon. We saw that the city had added maybe thirty parking spots where there’d been little or no parking before. We saw people leave their cars and hike up the peaks or stroll along the promenade. We saw the two-way traffic on the western half moving at slower speeds than previously, although still not congested except near the added new parking. We saw scores of people hiking up to the promenade from the neighborhood below, just as we had. We saw bicyclists who’d made the long climb via the roadway; we saw skateboarders; we saw people walking dogs. In fact, we saw a heck of a lot humans milling about, moving. The eastern half of the figure eight now has far more asphalt than necessary. Hopefully once the trial period is over, much of it can be returned to a more natural state.
 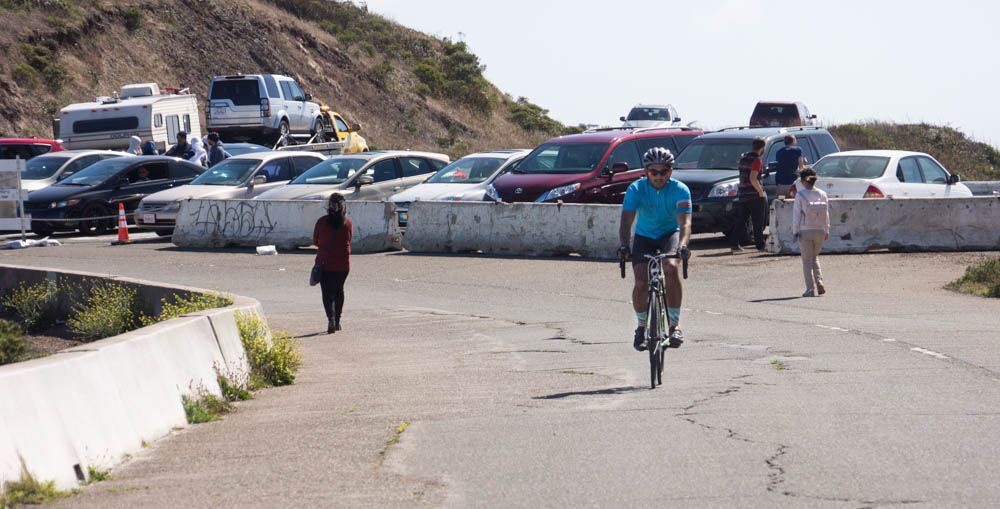 Biking the roofWe didn’t go all the way to Christmas Tree Point (because, seriously, it’s mostly a big parking lot), but I imagine it was packed as usual with people standing and sitting. Not moving much. Because there isn’t much place to go, unless on your way there you happen to notice a peak with a bunch of people on it and think, “Hey, I want to do that. How do I get there?” If you’re determined, you’ll backtrack and figure it out, but for the majority, the experience at Christmas Tree Point is static.
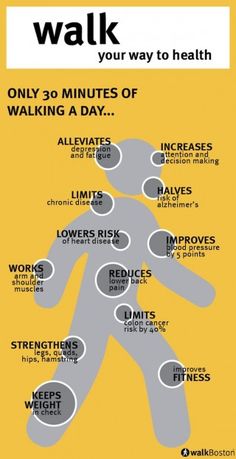 Walking thirty minutes a day is better for you than any drug you can take. (See
The Brilliance of Walking
.) It is the single best thing we can do for our health. In fact, if Americans walked thirty minutes a day, they could probably get by with three-fourths fewer medications, as evidenced by the fact that Americans are 5% of the world’s population, consume 75% of all prescription drugs in the world (80% of all opiods), far outspend all other nations per capita on health care, and collectively still have the worst health in the Western world. Study after study shows that thirty minutes a day of moderate exercise like walking (also bike riding) will substantially reduce the risk of four different types of cancer (breast, uterine, colon and prostate), heart disease, stroke, Alzheimer's, diabetes, osteoporosis, and depression, not to mention it boosts the immune system so you'll catch colds and the flu less often. Really the only problem with walking is that Americans have designed their entire way of life to avoid it.
Walking thirty minutes a day is better for you than any drug you can take. (See
The Brilliance of Walking
.) It is the single best thing we can do for our health. In fact, if Americans walked thirty minutes a day, they could probably get by with three-fourths fewer medications, as evidenced by the fact that Americans are 5% of the world’s population, consume 75% of all prescription drugs in the world (80% of all opiods), far outspend all other nations per capita on health care, and collectively still have the worst health in the Western world. Study after study shows that thirty minutes a day of moderate exercise like walking (also bike riding) will substantially reduce the risk of four different types of cancer (breast, uterine, colon and prostate), heart disease, stroke, Alzheimer's, diabetes, osteoporosis, and depression, not to mention it boosts the immune system so you'll catch colds and the flu less often. Really the only problem with walking is that Americans have designed their entire way of life to avoid it.Which is more important--recreation or health? What if you could offer both at the same time? Which is a higher public good, someone saving two minutes of travel time, or someone joyously climbing a peak? Is it better for tour buses to have an extra twenty seconds of view, or for a neighborhood to have a serene connection with nature? Might giving people, even tourists, interesting, enjoyable places to walk encourage them to do so? In a dense city like San Francisco, with the exception of handicapped access, is space dedicated to cars public space or a sacrifice of public space?
 Maybe there's a link?You can be a little overweight and be healthy, but you can’t be sedentary and be healthy. In fact, being sedentary is second only to smokingfor the harm it does to the human body. Every single community in America could do more to integrate walking into daily life. Every single community could do more to take walking seriously as a form of transportation. The entire country would benefit from a citizenry fit enough to hoof it a mile or two without puffing or breaking a sweat.
 Even if you think cheap oil will last another fifty years, even if you think you’ll be dead before climate change affects you, even if you think human beings are so clever someone will surely solve the myriad problems humanity faces so, hey, chill out, this much is clear: the American sedentary, car-based way of life is a disaster for public health. This would be true even if all cars magically became electric tomorrow.
 Heck of a hikeFor those of you who, like me, are less sanguine about future prospects down the road, let me tell you a story. Long ago I met an American woman who’d been married to an Iranian and lived in Iran during the last days of the Shah. As protests arose and borders closed, she began to go for walks each morning because she knew that if things got bad she would have to walk out over the mountains to leave. Each day she walked miles and then more miles, building her strength, her stamina. Once the revolution began in earnest, she indeed left Iran on foot over the mountains.
 It’s unwise to wait until there are empty store shelves to put in a vegetable garden. It’s useless to wait until the middle of a heat wave to plant a shade tree south of your house. Being fit enough to walk a few miles without effort is as important to resilience as solar panels, a sealed and insulated attic, or a bicycle in working order. Which city or town is more likely to thrive in any circumstance—one where most people routinely walk and few take medications, or one where few people walk and most take multiple medications? Which kind of town, which kind of neighbors do you want to have?
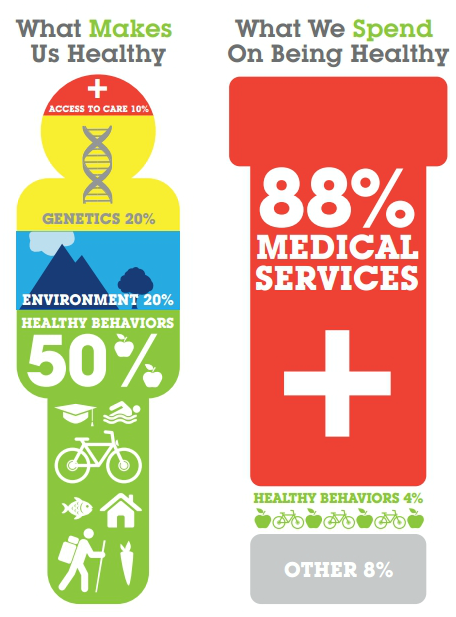 Corporations profit from bad health; communities profit from the opposite. (Corporations especially profit from chronic conditions “managed” by expensive medications and other interventions.) A town or city with lots of parking and public space devoted to cars has bad health designed into its very fabric. We need to transform parking lots and repurpose street space to serve people on foot and bicycles, even if it means drivers are inconvenienced. We need to pedestrianize shopping streets like cities have done all over Europe. We need protected bike routes safe and pleasant enough that even children and seniors can use them. (Seniors, check out electric trikes!)
 My husband and I have a car and use it occasionally. (My mode share is 40/40/10/10, walking/biking/transit/car.) When I’m behind the wheel, I’m just as impatient as my fellow drivers, wanting to get where I’m going ASAP and then park ten feet from my destination. Go, go, go, my trip is important, get out of my way, the driver in me cries. But the saner part of my brain knows that just as we’ve reduced smokers’ convenience in order to protect non-smokers from second-hand smoke, so should we reduce drivers’ convenience to protect non-drivers from the many, many negative externalities of cars, including death from speeding, careless, or reckless drivers. As frustrating (and even threatening) as it might be to those whose lives are designed around car use, for the public good we need to reclaim and repurpose space currently devoted to motorized vehicles.
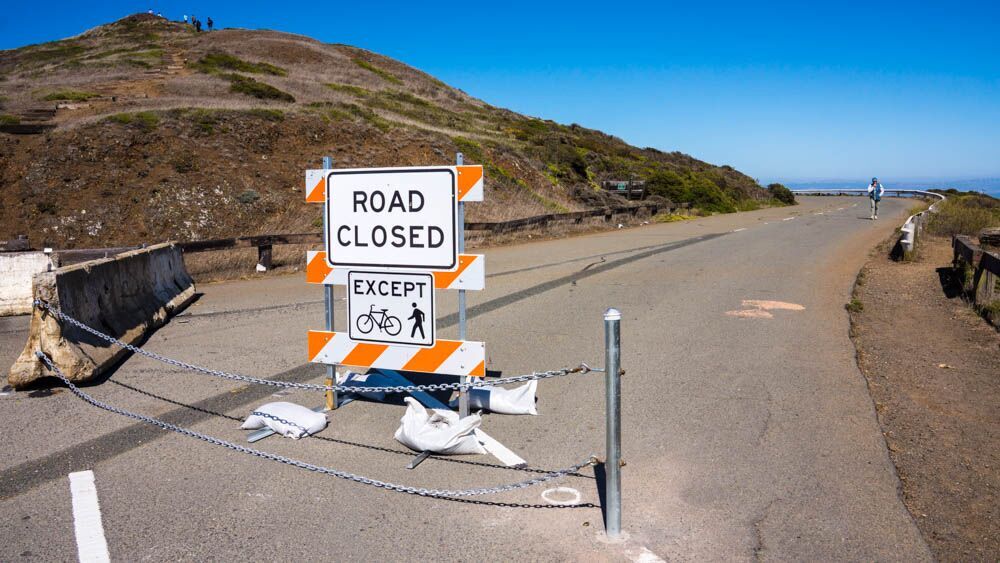 Not exactly elegant, but it'll doThe next time you’re in San Francisco, forgo the car. Take BART in from the airport (or the suburbs) and tackle the city on foot, bike or transit. You’ll see and experience so much more. If you’re up for it, conquer Twin Peaks under your own power. It’s so worth it.
June 8, 2016
Building Community, One Bench at a Time
 Cora FloraMy grandfather was a barber. He grew up in West Texas, his family tenant farmers that got kicked off the land after his father died during an emergency gall bladder operation. His eight older siblings, who had skedaddled as fast as they could out of West Texas, couldn’t (or wouldn’t) offer much support to him, his mother, and his little brother. My grandfather had an athletic scholarship to college, but it was not to be. Instead he went to a Civilian Conservation Corps camp (part of Roosevelt’s New Deal) to earn money to send home to provide for his mother and brother. Later in life he would always say that without that money, he didn’t know what would’ve become of them. No safety net back then except family.
 Jack Allen, bench believerFrom 1964 on my grandparents lived in Lodi, California, a Central Valley farm town once known for its watermelons, now known for its zinfandels, in a house not far from the train tracks. My grandmother was an Okie farm girl. She loved animals and always had a strange assortment of pets—a large white dog named Red, an ornery pet blue jay that lived in the house (seriously), and a turtle who lived nearly forever named Slow Motion. For a while beautifully plumed feral chickens hung out around her house because she wouldn't let animal control come in the yard to get them. (Oh, how they wanted to nab that handsome rooster and his harem.)
Yes, this is going somewhere. After my grandfather retired from barbering (he had trouble with his hands shaking), he spent a lot of time in his yard. At some point, he put in a bench close to the sidewalk. On it this veteran of the hell known during WWII as Okinawa put a note in tremulous handwriting: “Set a spell and rest.”
 Okinawans not killed by GIsMy grandfather, a severely taciturn man, got more talkative in his later years. He told me the first dead people he ever saw were a mother and baby in an Okinawan ditch, killed by nervous American soldiers shooting into the dark. (The native Okinawans, frightened, tried to move around at night.) He told me during his time on Okinawa over one stretch he didn’t take off his boots for 28 days straight. During the Lodi bench era, I was a young mother living in San Francisco. I thought the bench and his note were both sweet and pretty much crazy. To this day, I have no idea if anyone took him up on his offer to set a spell. My grandfather died in 2002.
 Up, up, upMy husband and I have raised three children in San Francisco. We live at the top of a big hill, one that goes half a mile straight up at a ten percent grade. Big even by San Francisco standards, it’s a hill I walk or ride/push my bike up a dozen times a week, so I know its impact intimately. San Francisco is a fabulous city for walking. Since the act of walking provides huge benefits (see The Brilliance of Walking) not only to the walker but also to society at large, pedestrians ought to be encouraged and rewarded at every turn is my motto. Our street is often used to connect from one neighborhood to another, and I’ve sometimes seen elderly walkers sitting on our neighbor’s stairs for a rest. So I started thinking about community. I started thinking about my grandfather’s “set a spell.” I started thinking it might be nice to have a bench for those hardy souls cresting our hill to catch their breath. But when I researched the cost of a bench sturdy enough to stand up to street life, I couldn’t quite justify to my husband springing $300 out of sheer friendliness.
 Chris, with all-pink Cora FloraThen I stumbled across a blog that told me about the Public Bench Project, a labor of love by Chris Duderstadt, bench builder extraordinaire. Chris was looking for stewards of public benches in San Francisco neighborhoods. If you had a place for a bench and could commit to caring for it in the public realm, he would build you one for the cost of materials ($50). He would paint it any color desired, and we could customize it further with artistic enhancements of our choice. He'd already installed 65 benches in San Francisco.
I was thrilled. I’d asked the Universe for a bench, and it had delivered. Perhaps my grandfather had whispered in its ear.
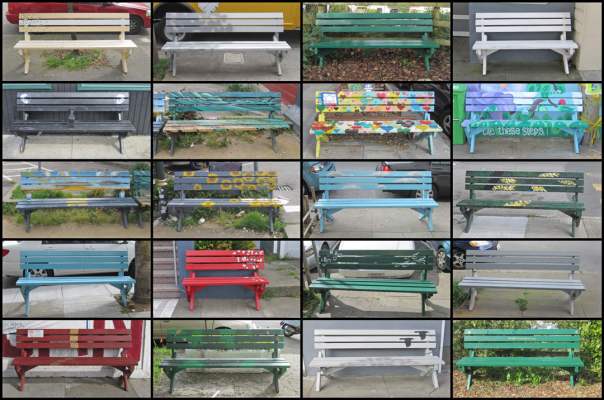 Some of Cora Flora's siblingsThe first step, Chris told me, was a trial bench, to see if the proposed spot was a bench-happy place. Most places were, he assured me, but it was best to try it out, see if the neighbors were chill, see if it created problems. Since this was San Francisco, sometimes neighbors, he said, were concerned a bench might attract homeless sitters, homeless sleepers, or just general anti-social badness. Putting the bench out as a trial let everyone observe just what the impacts might be.
 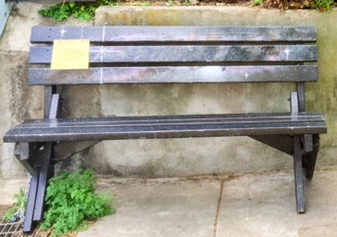 Milky Way with noteOur bench spot is sunny in the morning and shaded in the afternoon, not a bad combination. It has a nice view of a row of picturesque Victorians across the street. But it’s a little narrower than the standard space, so we would get a five-foot bench rather than a six-foot one. The trial bench he delivered was The Milky Way, a bench that had already seen service in a number of locations across San Francisco. Built solidly out of wood, it was sturdy and comfortable. Since we were on a slight slant, Chris bolstered one leg to make it even and then chained the bench to a grate so that it wouldn’t be randomly moved by mischievous teens. I attached a note to it, letting our neighbors know that this was a trial and to tell us what they thought about a bench in this spot.
Over the next few weeks, the Milky Way sat placidly in front of our house with people indeed sitting on it from time to time. All responses from neighbors were positive. Chris’s design, refined over many iterations, included a slight curve to the back. The bench was low enough to be comfortable, but not too low to be difficult to stand up from.
After six weeks passed and the bench induced no major calamities, Chris and I agreed to the creation of a permanent bench. I enlisted the aid of my artistically inclined middle daughter as to color and design. I said I’d like something with vines and flowers. She said to paint it coral. Flowers and greenery would pop nicely on that background.
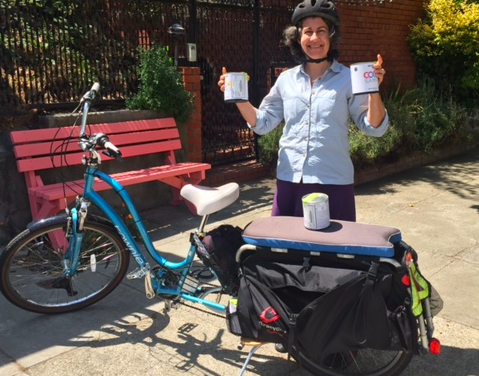 Electric motor = easy cargo transportIt turns out coral looks pretty much like pink. Chris warned me by email the bench was very pink, and indeed, when he delivered it, it looked very pink. My neighbors were surprised. Pink? My daughter said don’t worry, it’ll be great. After conferring with her on other colors she would need (six!), I went to the paint store on my trusty electric bike to pick them up. The paint and the urethane coating to protect it cost double the bench, but so it goes. (There are lots of leftovers, so if anyone in San Francisco wants water-based semi-gloss enamel house paints to decorate their own bench, if you come to pick them up, they’re yours.)
  Sidewalk workshopAfter my daughter and a friend spent a pleasant afternoon painting grasses and flowers on the bench in greens, yellow, blue, purple and red, it indeed looked less pink. I’ve named the bench Cora Flora, in honor of her coral genesis.
The bench is not in full view of our front window, so I can’t really see all who sit on it, though every once in a while I notice someone stop and set for a spell. Once as I came home, I talked with a young couple from Germany who were happily seated while eating their frozen yogurt, bought at least half a mile away. There’s someone who sits on it while smoking Marlboros, because I’ve found three cigarette butts. (Hey Mr./Ms. Marlboro Man, try carrying a pocket ashtray rather than littering. Though I have to say, my grandfather was a chain smoker until emphysema forced him to go on oxygen.) One morning there was a pizza box and beer cans near the bench. Evidently someone had a party. Does anyone sleep on it? My husband, an early riser who often goes for walks at 6 am, has never seen anyone on the bench at that hour.
While my daughter and her friend were painting the bench, many passers-by were interested and asked questions about where they’d gotten the bench and why they were doing it. While we know most of our neighbors, one neighbor I’ve never spoken to crossed the street and told me how much he likes the bench. In the past, my husband and I have hosted a pop up happy hour in front of our house with lawn chairs, and we’ll try it again with the bench.
 We like the city the way it was in 1972.San Franciscans are like cats: they hate change. Any alteration of the city, no matter how small, arouses the same disdain and suspicion that a new chair incites in your domestic feline. (Your cat, however, will get a lot of pleasure out of the empty cardboard shipping box in a way your average San Franciscan will not.) As a result, some San Franciscans make a near career out of speaking out in public meetings against any and all forms of change, including any new form of seating. Real San Franciscans prefer the city to remain exactly like it was the year they moved here, whenever that was, but certainly before the tech hipsters and their barista friends showed up. Sitting is political, sitting is controversial, sitting is up to no good. Not only are there the homeless and teenagers to worry about (restless groups with no place to call their own who might call your space their own), there are those naked guys and their bare bottoms. (San Francisco actually had to pass an ordinance requiring naked guys to place cloths under their butts if they sit anywhere.) Standing is okay. Passing through is okay. Setting a spell--to watch the play of light and color, observe one’s fellow citizens, or eat some frozen yogurt--is not.
 This is not to say offering a place to sit has no negative consequences. I’ve got pizza boxes and cigarette butts to deal with now. But should fear of dysfunction by a few preclude making a hospitable environment for all? We need our streets walkable and pedestrian-friendly. We need genuine community and social cohesion in our neighborhoods. We need to be able to set a spell. Sterile streets devoid of humaneness solve some problems but they cause others: isolation, hostility, apathy. Alienation. Lack of connection. People driving half a mile for errands they could easily walk. A world without public sitting is simpler, less messy, less scary, but offers a much poorer form of existence. This my grandfather knew.
 Cora Flora raises some questions. Where can teenagers go to eat pizza and drink beer? (Answer: nowhere.) Can providing frequent resting places make it easier for all sorts of people, including seniors, to walk their errands? (Answer: yes.) Are free, welcoming places to sit a fundamental element of a healthy democracy? (Answer: Jane Jacobs would say yes.) Can putting a bench on the sidewalk create community? Can it change the world?
Answer: I suggest try it and see.
May 15, 2016
Monster Day for Renewables in California
Yesterday, May 14th, was a windy, sunny, fairly cool day in California. As a result, records were set for the proportion of California electricity produced by renewables. For the day: 34%! From 3 - 4 pm: 54%! And the grid didn't explode, black out, or do any number of other terrible things. Congratulations to the California ISO, the entity that manages and balances California's electric grid, for coping with its highest proportion of renewable electricity so far. Here are the graphics from the ISO for yesterday.
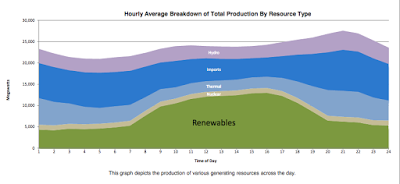
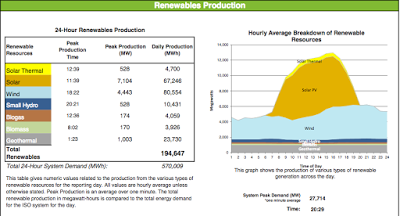
This is great news, and you will no doubt hear more about it in the media. Of course, remember, journalists often conflate electricity with energy. Until we go all electric, electricity is a small subset of energy used. For example, Californians consume the energy equivalent of 161 kwhs per person per day, but only 18 kwhs of that comes from electricity. However, roughly 30 kwhs per person each day is wasted creating that electricity (waste heat from burning fossil fuels), so as California increases its renewables, its total per person energy consumption will decrease. Next up--hot water and space heating via heat pumps and solar!


This is great news, and you will no doubt hear more about it in the media. Of course, remember, journalists often conflate electricity with energy. Until we go all electric, electricity is a small subset of energy used. For example, Californians consume the energy equivalent of 161 kwhs per person per day, but only 18 kwhs of that comes from electricity. However, roughly 30 kwhs per person each day is wasted creating that electricity (waste heat from burning fossil fuels), so as California increases its renewables, its total per person energy consumption will decrease. Next up--hot water and space heating via heat pumps and solar!
April 3, 2016
An Energy Diet for a Healthy Planet--Part II
How do we get to 100 kwh/person/day, and where are we now?
 Global energy losses in electricity generation (twh, yr 2000)I’ve written before about how efficiency is not the enemy of resiliency and the benefits of going all-electric. In Part I, I mentioned a few ways to cut our energy diet from 230 kwh /person/day to 100 kwh/person/day. I also pointed out that 56 kwh/person/day of our energy consumption is lost as waste heat in thermal generation of electricity. (One of the reasons Denmark is so energy-efficient is that they use cogeneration and district energy systems to turn this waste heat into heat for homes and commercial buildings.)
 This means just converting our electrical generation to solar, wind and hydro, which have no heat losses, will give us a big jump in reducing our energy consumption. Solar and wind are also not 100% efficient in turning potential energy into electricity, but the sun would have shone and the wind would have blown anyway. Whereas the coal, natural gas, oil and uranium that turn into unused heat are gone forever, not to mention all the polluting by-products.
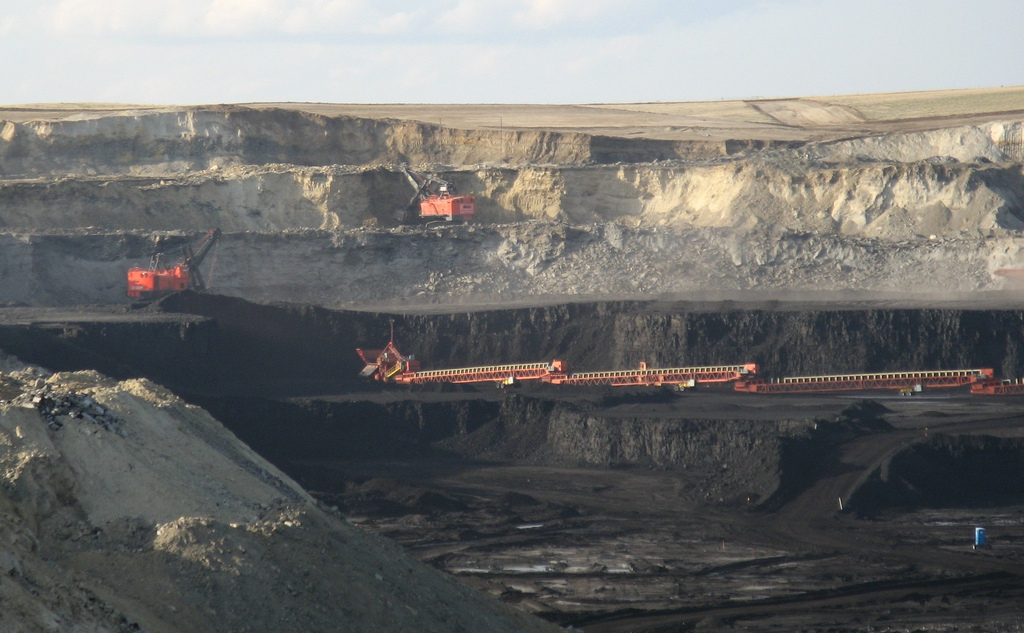 More attractive than a wind turbine?These thermal energy losses in electricity generation are part of the reason Wyoming and Montana are such energy guzzlers. Both states burn coal to create electricity, far more than their state consumes. They then export this electricity to other states. However, the heat losses (2/3rds!) involved in this electricity generation are still part of their state's consumption. This is also a factor in why energy consumption in California, Massachusetts, and Rhode Island is as low as it is. These states import a lot of electricity but aren't apportioned the associated waste heat losses because the fuel wasn't burned in their state. (Note: there's no point saying you're importing "green" energy if the state you're importing it from is burning coal or natural gas to provide for their own electricity needs.)
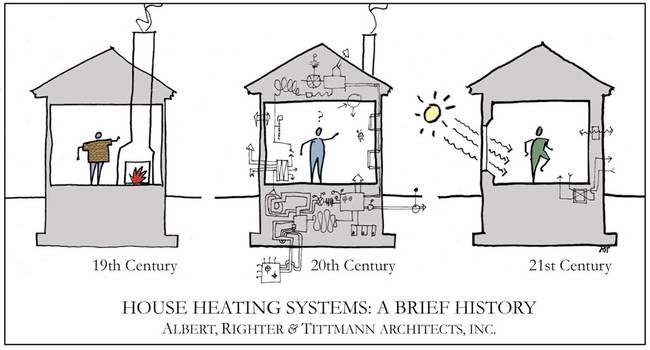 Now one might think with all these heat losses that going all-electric isn't a good idea until all our electricity is produced by hydro and renewables. One would be wrong. Amazingly, even with the huge losses our current electricity generation entails, it is still more efficient to use heat pumps than natural gas for space heating. (Yes, sunlight beats both.) The same is true for an electric car compared to a 22 mpg gasoline-powered car. Of course, as your state's energy mix takes on more wind, solar and hydro, the total system efficiency of both heat pumps and electric transportation zooms up.
Back to a 100 kwh/person/day energy budget. "Come on," I hear you say. "Sealing and insulating homes is all well and good, and maybe heat pumps are snazzy, but how could the United States possibly cut its energy use by more than half and still have a decent way of life?" It does seem daunting. Let’s look at it by sector. Industrial is longest because it's the toughest nut to crack due to high process heat needs. Just scroll through it if you're not interested.
 Residential
—massive insulating and sealing of existing housing stock; super-insulated walls and ceilings; tight building envelopes; insulated crawl spaces, foundation walls, and slab foundations; higher percentage of multifamily housing; LED lighting; air source and ground source heat pumps for space and hot water heating; insulated hot water tanks; desuperheaters; district energy systems; radiant hydronic heating; high-efficiency fireplace inserts; high-efficiency woodstoves; masonry heaters; solar hot water; passive solar gain; low-flow showerheads; clothes lines; electric induction/convection cooking; electric chainsaws and lawn mowers; lawns converted to vegetable gardens; ceiling fans; whole house fans; heat/energy exchange ventilators; waste water heat recovery; front load washers; awnings; shade trees; street trees to reduce urban heat island effect; green roofs; white roofs; double and triple glazed fiberglass windows; thermal mass; timed thermostats; ultra-efficient appliances; replace or eliminate old refrigerators; no second refrigerators in garages; all new residential buildings net-zero-energy capable; deep energy retrofits for multifamily housing; timely energy use feedback to residents; rebates for low energy use in multi-family buildings; structured insulated panels; build without thermal bridging; duct sealing; fewer housing square feet per person; eliminate vampire electric draw from gadgets/cable boxes; sharply tiered electric rates for high energy slurpers; housing stock 100% all electric.
Residential
—massive insulating and sealing of existing housing stock; super-insulated walls and ceilings; tight building envelopes; insulated crawl spaces, foundation walls, and slab foundations; higher percentage of multifamily housing; LED lighting; air source and ground source heat pumps for space and hot water heating; insulated hot water tanks; desuperheaters; district energy systems; radiant hydronic heating; high-efficiency fireplace inserts; high-efficiency woodstoves; masonry heaters; solar hot water; passive solar gain; low-flow showerheads; clothes lines; electric induction/convection cooking; electric chainsaws and lawn mowers; lawns converted to vegetable gardens; ceiling fans; whole house fans; heat/energy exchange ventilators; waste water heat recovery; front load washers; awnings; shade trees; street trees to reduce urban heat island effect; green roofs; white roofs; double and triple glazed fiberglass windows; thermal mass; timed thermostats; ultra-efficient appliances; replace or eliminate old refrigerators; no second refrigerators in garages; all new residential buildings net-zero-energy capable; deep energy retrofits for multifamily housing; timely energy use feedback to residents; rebates for low energy use in multi-family buildings; structured insulated panels; build without thermal bridging; duct sealing; fewer housing square feet per person; eliminate vampire electric draw from gadgets/cable boxes; sharply tiered electric rates for high energy slurpers; housing stock 100% all electric.
 Bring the daylight in
Commercial
—massive insulating and sealing of buildings; whole building envelope upgrades; radiant hydronic heat; LED lighting; LED streetlights; air source and ground source heat pumps; solar hot water; heat pump hot water; wastewater heat recovery; seal ducts; retrofit windows; district energy systems; make use of industrial waste heat via district energy systems; replace steam heat in district energy systems with hot water; ceiling fans; heat/energy exchange ventilators; chilled beams/chilled sails for cooling; revolving doors; vestibules; operable windows; natural ventilation; night flush; low-E high-efficiency high-thermal-performance glazing; automated sunshades; dynamic glazing; green roofs; white roofs; living walls; thermal mass; zone heating; proper equipment maintenance; don’t overcool; don’t chill the outdoors; don’t heat the outdoors; plug load management; no under-the-desk space heaters or refrigerators; waste heat recovery (especially from computer server rooms); daylighting; solar tubes; skylights; light shelves; building automation systems with zones, daylight harvesting, occupancy sensors and optimum warm up and cool down cycles; grocery store refrigerators and freezers again behind glass; all new buildings under 4 stories zero-net-energy capable; buildings that encourage stair use; recycled building materials; multistory mixed-use infill developments in towns and cities that replace parking lots, garages, auto dealerships, auto repair shops, gas stations, and other auto infrastructure; end minimum parking requirements; less floorspace per office worker; sharing economy allow efficient use of resources; reduced medical kwhs through better food and exercise; sharply tiered electric rates for energy slurpers; commercial buildings 100% all electric.
Bring the daylight in
Commercial
—massive insulating and sealing of buildings; whole building envelope upgrades; radiant hydronic heat; LED lighting; LED streetlights; air source and ground source heat pumps; solar hot water; heat pump hot water; wastewater heat recovery; seal ducts; retrofit windows; district energy systems; make use of industrial waste heat via district energy systems; replace steam heat in district energy systems with hot water; ceiling fans; heat/energy exchange ventilators; chilled beams/chilled sails for cooling; revolving doors; vestibules; operable windows; natural ventilation; night flush; low-E high-efficiency high-thermal-performance glazing; automated sunshades; dynamic glazing; green roofs; white roofs; living walls; thermal mass; zone heating; proper equipment maintenance; don’t overcool; don’t chill the outdoors; don’t heat the outdoors; plug load management; no under-the-desk space heaters or refrigerators; waste heat recovery (especially from computer server rooms); daylighting; solar tubes; skylights; light shelves; building automation systems with zones, daylight harvesting, occupancy sensors and optimum warm up and cool down cycles; grocery store refrigerators and freezers again behind glass; all new buildings under 4 stories zero-net-energy capable; buildings that encourage stair use; recycled building materials; multistory mixed-use infill developments in towns and cities that replace parking lots, garages, auto dealerships, auto repair shops, gas stations, and other auto infrastructure; end minimum parking requirements; less floorspace per office worker; sharing economy allow efficient use of resources; reduced medical kwhs through better food and exercise; sharply tiered electric rates for energy slurpers; commercial buildings 100% all electric.
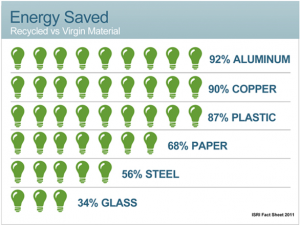 Industrial, including farming
—ubiquitous waste heat recovery; daylighting; solar tubes; solar hot water preheat for industrial processes; solar boilers; boiler insulation; boiler blowdown heat exchangers; boiler condensate return systems; minimize energy draw during idle process conditions; some use of combined industrial heat and power; energy management systems; benchmark energy efficiency; advanced controls and operations for optimized energy draw; reduce gas flaring; renewable raw materials; improved reverse osmosis water purification technology; improve yields of raw materials to desired products; manufacturing engineers prioritize energy and water-efficienct processes; recycle manufacturing and process waste streams; optimize supply chain energy consumption; product life cycle management; community recycling to reduce energy to produce aluminum, copper, steel, glass and paper; improved fiber recycling; next generation mill processes; eliminate junk mail; cloth napkins; reusable water bottles, bags, sandwich containers, growlers; buy in bulk and refill own containers to reduce packaging; home and community composting; slash use of energy-intensive nitrogen fertilizer via compost and crop rotation to fix nitrogen; slash use of energy-intensive chlorine through reduced use of bleached paper, PVC, vinyl flooring, pharmaceuticals, insecticides, chlorine-based cleaning products; reduce use of energy-intensive ethylene through slashed use of plastic bags, plastic wrap, bubble warp, plastic toys, plastic milk jugs, polystyrene packaging; stop buying endless amounts of plastic junk that just gets thrown away; high-yield, bio-intensive, compost-intensive home and community vegetable gardens; eliminate most petroleum refining; phase out coal mining; eliminate ethanol mandate and ethanol production; eliminate high fructose corn syrup from American diet; eat fewer highly-processed foods; reduce food waste; reduce/eliminate chemical fertilizer and pesticide use; end most crop subsidies (corn most importantly); grow cotton, rice and alfalfa in places with ample water; end most water subsidies; solar drying of crops; green manures; towns and cities develop 100 mile foodsheds; reduce food imports; reduce consumption of all forms of sugar; small biointensive, high-yield, compost-intensive, no-till family farms growing fruits and vegetables on outskirts of cities; hedgerows and other beneficial crop insect habitat; no-till organic grain farms with crimping and careful crop rotation; energy-efficient indoor cannabis growing; grow cannabis outdoors; fruit walls; unheated greenhouses with thermal mass; most food packaging compostable; hoop houses for year-round growing; row covers; eat less meat and more vegetables; eat fewer processed grains and more vegetables; eat less food that's been frozen or dehydrated; eat only meat/dairy from local range-fed animals; mobile abattoirs; farmers' and crafters' markets; buy fewer industrially-produced items; buy products built to last; buy products possible to repair; reduce consumption and reuse stuff; buy used; prevent need for desalination in dry places by eliminating lawns and water waste and adding water collection and storage; electrified industrial-scale compost systems for towns and cities for nutrient cycling; asphalt solar collectors; interseasonal heat transfer and borehole thermal energy storage for snowmelt and district heating systems; electricity prices for industry 2/3rds of residential price instead of half; energy use (beyond solar thermal) in US industry 95% all electric.
Industrial, including farming
—ubiquitous waste heat recovery; daylighting; solar tubes; solar hot water preheat for industrial processes; solar boilers; boiler insulation; boiler blowdown heat exchangers; boiler condensate return systems; minimize energy draw during idle process conditions; some use of combined industrial heat and power; energy management systems; benchmark energy efficiency; advanced controls and operations for optimized energy draw; reduce gas flaring; renewable raw materials; improved reverse osmosis water purification technology; improve yields of raw materials to desired products; manufacturing engineers prioritize energy and water-efficienct processes; recycle manufacturing and process waste streams; optimize supply chain energy consumption; product life cycle management; community recycling to reduce energy to produce aluminum, copper, steel, glass and paper; improved fiber recycling; next generation mill processes; eliminate junk mail; cloth napkins; reusable water bottles, bags, sandwich containers, growlers; buy in bulk and refill own containers to reduce packaging; home and community composting; slash use of energy-intensive nitrogen fertilizer via compost and crop rotation to fix nitrogen; slash use of energy-intensive chlorine through reduced use of bleached paper, PVC, vinyl flooring, pharmaceuticals, insecticides, chlorine-based cleaning products; reduce use of energy-intensive ethylene through slashed use of plastic bags, plastic wrap, bubble warp, plastic toys, plastic milk jugs, polystyrene packaging; stop buying endless amounts of plastic junk that just gets thrown away; high-yield, bio-intensive, compost-intensive home and community vegetable gardens; eliminate most petroleum refining; phase out coal mining; eliminate ethanol mandate and ethanol production; eliminate high fructose corn syrup from American diet; eat fewer highly-processed foods; reduce food waste; reduce/eliminate chemical fertilizer and pesticide use; end most crop subsidies (corn most importantly); grow cotton, rice and alfalfa in places with ample water; end most water subsidies; solar drying of crops; green manures; towns and cities develop 100 mile foodsheds; reduce food imports; reduce consumption of all forms of sugar; small biointensive, high-yield, compost-intensive, no-till family farms growing fruits and vegetables on outskirts of cities; hedgerows and other beneficial crop insect habitat; no-till organic grain farms with crimping and careful crop rotation; energy-efficient indoor cannabis growing; grow cannabis outdoors; fruit walls; unheated greenhouses with thermal mass; most food packaging compostable; hoop houses for year-round growing; row covers; eat less meat and more vegetables; eat fewer processed grains and more vegetables; eat less food that's been frozen or dehydrated; eat only meat/dairy from local range-fed animals; mobile abattoirs; farmers' and crafters' markets; buy fewer industrially-produced items; buy products built to last; buy products possible to repair; reduce consumption and reuse stuff; buy used; prevent need for desalination in dry places by eliminating lawns and water waste and adding water collection and storage; electrified industrial-scale compost systems for towns and cities for nutrient cycling; asphalt solar collectors; interseasonal heat transfer and borehole thermal energy storage for snowmelt and district heating systems; electricity prices for industry 2/3rds of residential price instead of half; energy use (beyond solar thermal) in US industry 95% all electric.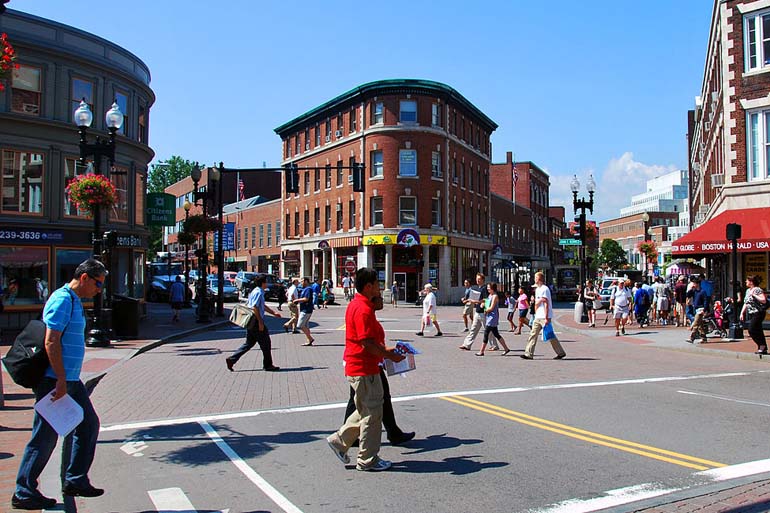 Energy efficient
Transportation
— electrified passenger rail for distances under 400 miles; regional passenger rail hubs (Atlanta, Washington DC, Chicago, New York); improved rail tracks; passenger rail 100% double-tracked; eliminate passenger rail at-grade crossings; straighten/eliminate rail track curves; 125 mph average passenger rail speed; electrified doublestack rail freight; 50 mph freight rail speed; advanced train scheduling, trip optimization and control systems; electric shared-use autonomous vehicles; electric shared autonomous shuttles; regenerative breaking on trains; Electric Multiple Unit trains; electric buses; electric trams; electric garbage and fire trucks; economic incentives to live car-free; majority of population lives within 15 miles of job; work at home; good local schools; electric bicycles; regular bicycles; bikeshare systems; lower speed limits in populated areas; walk or bike most trips under a mile; under-used roads return to gravel; pedestrian-only boulevards, commercial streets, promenades, main streets and market streets; network of protected bicycle infrastructure within cities/towns and between them; Vehicle Mile Travel charge based on road repair costs and vehicle weight; dramatically reduce private car vehicle miles traveled; local streets safe enough for children to walk and bike to school and activities; walkable neighborhoods; walkable shopping districts; multifamily residential over ground floor retail; live within a ten minute bike ride of a grocery store/pharmacy/medical clinic/library/park/playing field/elementary school; buy local; buy used from local sources; drink filtered tap water instead of bottled water/soda pop/fruit juice; drink local beer, wine and spirits; eat local fruits and vegetables in season; electric dry box trucks for farmers to take produce to cities; electric trucks for delivery last one to ten miles of goods from rail freight terminals; fewer goods deliveries to homes; package locker pick ups in towns and cities; biofuels for aviation; hydrogen fuel cells for ships; transportation in the US 95% all electric.
Energy efficient
Transportation
— electrified passenger rail for distances under 400 miles; regional passenger rail hubs (Atlanta, Washington DC, Chicago, New York); improved rail tracks; passenger rail 100% double-tracked; eliminate passenger rail at-grade crossings; straighten/eliminate rail track curves; 125 mph average passenger rail speed; electrified doublestack rail freight; 50 mph freight rail speed; advanced train scheduling, trip optimization and control systems; electric shared-use autonomous vehicles; electric shared autonomous shuttles; regenerative breaking on trains; Electric Multiple Unit trains; electric buses; electric trams; electric garbage and fire trucks; economic incentives to live car-free; majority of population lives within 15 miles of job; work at home; good local schools; electric bicycles; regular bicycles; bikeshare systems; lower speed limits in populated areas; walk or bike most trips under a mile; under-used roads return to gravel; pedestrian-only boulevards, commercial streets, promenades, main streets and market streets; network of protected bicycle infrastructure within cities/towns and between them; Vehicle Mile Travel charge based on road repair costs and vehicle weight; dramatically reduce private car vehicle miles traveled; local streets safe enough for children to walk and bike to school and activities; walkable neighborhoods; walkable shopping districts; multifamily residential over ground floor retail; live within a ten minute bike ride of a grocery store/pharmacy/medical clinic/library/park/playing field/elementary school; buy local; buy used from local sources; drink filtered tap water instead of bottled water/soda pop/fruit juice; drink local beer, wine and spirits; eat local fruits and vegetables in season; electric dry box trucks for farmers to take produce to cities; electric trucks for delivery last one to ten miles of goods from rail freight terminals; fewer goods deliveries to homes; package locker pick ups in towns and cities; biofuels for aviation; hydrogen fuel cells for ships; transportation in the US 95% all electric. 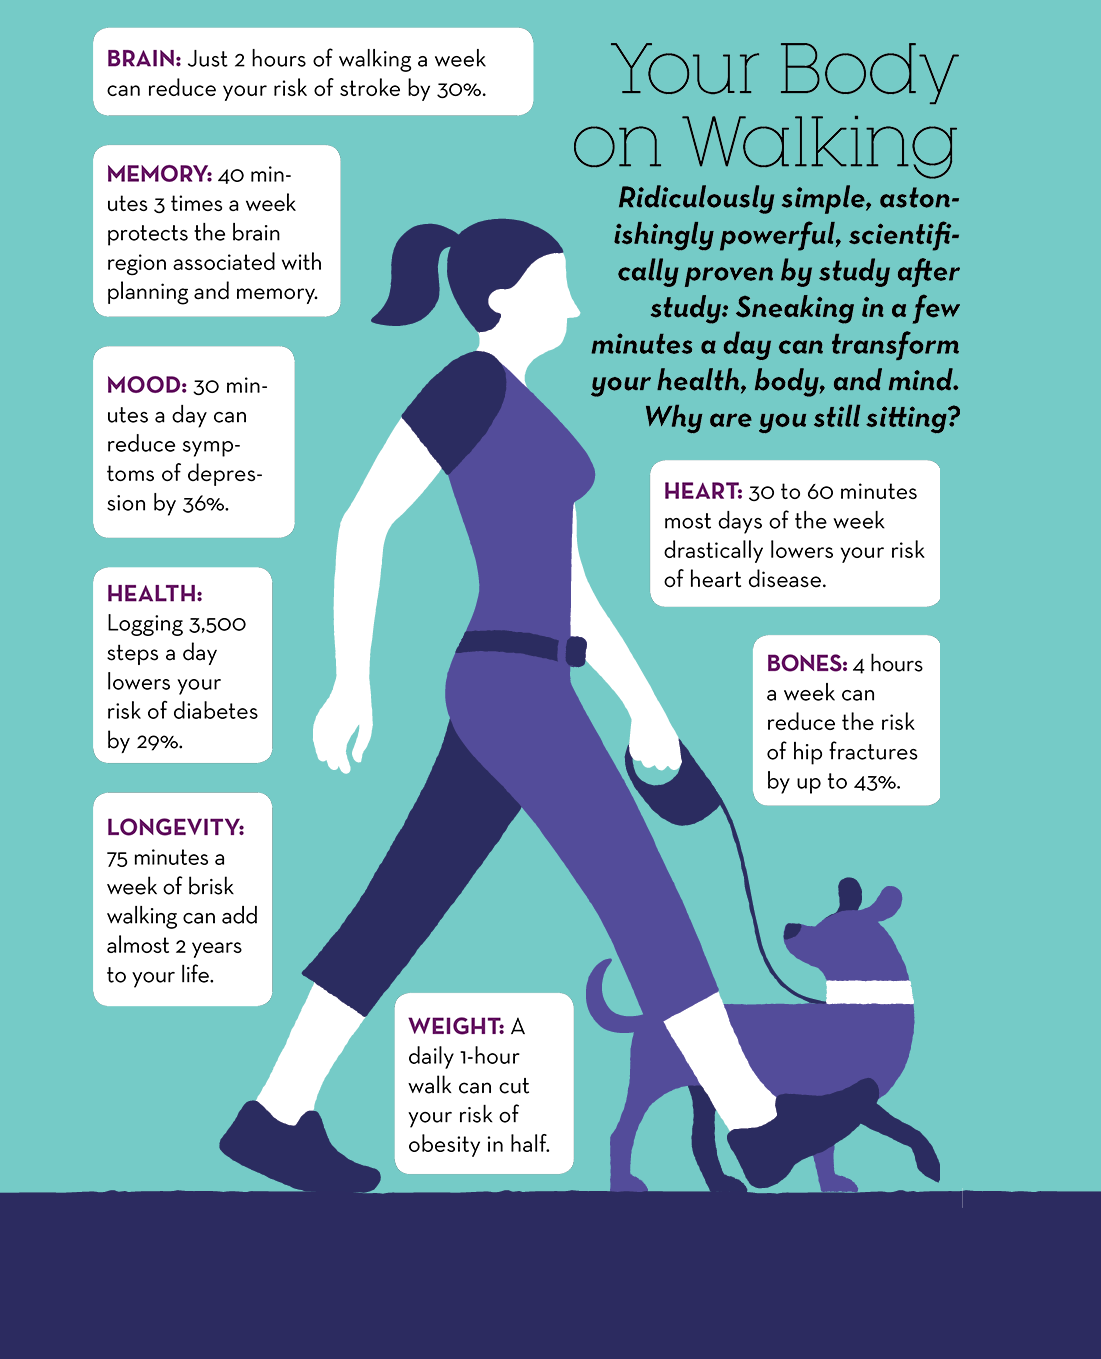 So good. So cheap.Whew! Amazingly, all this stuff is not only cheaper than building out solar and wind, it’s cheaper than continuing to drill and refine oil and build natural gas plants. Even better, many of these measures reinforce others in a virtuous circle. For instance, more walking means not only fewer transportation kwhs but also reduced cancer, high blood pressure and depression. This in turn means fewer kwhs used up by doctors’ offices and hospitals as well as fewer kwhs used in the manufacture of medical equipment and pharmaceuticals such as blood pressure meds and anti-depressants. So just by walking, we reduce commercial, industrial and transportation energy demand, and we increase our standard of living (healthier citizenry), all for very little cost. Yes, as we transition, jobs will inevitably be lost in some areas, but they will be gained in others, such as in biointensive farming, compost facilities, wetlands restoration, deep building energy retrofits, train yards, and manufacturing solar PV, batteries, and wind turbines. After all, just as it’s poor policy to encourage to smoking in order to provide tobacco and medical jobs, it’s also unwise to encourage sedentary lifestyles in order to provide auto and medical jobs.
So let’s examine 2015 renewables + hydro generation kwh/person/day by state, grouped by region. (The EIA includes as renewables electricity produced by geothermal and biomass.) Remember, each state needs 100 kwh/person/day, or another state will have to generate more than that and send the extra to them. Also remember that the further electricity is transmitted, the higher the losses along the way, although underground DC cables could cut transmission losses in half. (The US currently loses 6% of its electricity in transmission.) Rooftop solar PV avoids almost all transmission loss.
New England and Mid-Atlantic Renewable+ Hydro kwh/capita/day generation Not with the program Working on it Serious Progress Connecticut (1.2) Vermont (9.3) Maine (16.7) Massachusetts (1.5) New Hampshire (7.2)
Rhode Island (.7) New York (4.8)
New Jersey (.9)
Pennsylvania (1.9)
North Central Renewables + Hydro kwh/capita/day generation Lacking Snail Pace Solid Progress Very Good Smoking hot Ohio (.6) Illinois (2.3) Minnesota (6.1) Kansas (10.4) South Dakota (23.4) Missouri (1.2) Indiana (2.3) Nebraska (6.3) Iowa (16.6) North Dakota(31.3)
Michigan (2.4)
Wisconsin (2.7)
South Renewables + Hydro kwh/capita/day generation Feeble Some progress Making headway Good work Delaware (.6) Georgia (2) West Virginia (5) Oklahoma (11.8) District of Columbia (.1) North Carolina (2.5) Tennessee (4.6)
Florida (.7) South Carolina (2.9) Alabama (7.6)
Maryland (1.3) West Virginia (5) Arkansas (4.8)
Mississippi (1.3) Tennessee (4.6) Texas (4.8)
Virginia (1.6) Alabama (7.6)
Mountain Renewables + Hydro kwh/capita/day generation Not trying Progress Advancing Great Work Best in Show! Utah (1.7) Arizona (4.7) Nevada (7.5) Idaho (18.7) Montana (30.8)
Colorado (4.9)
Wyoming (23.6)
New Mexico (4)
Pacific Renewables + Hydro kwh/capita/day generation Making an effort Some hydro Oodles of hydro! Hawaii (3.8) Alaska (6.5) Oregon (27.5) California (4.6)
Washington (31.9)
 Adapted to windIt’s ironic that two states with some of the best wind resources in the country are North Dakota and Wyoming, giants of coal-mining, fracking and burning coal for electricity to export to other states. If these states stopped mining, drilling and burning coal, and focused instead on wind energy production, the carbon-free electricity they could export (at a premium!) would pay better, provide more jobs, and would destroy their states a great deal less than the mining and fracking they’re so fond of. Yet another irony is that if utilities stopped fighting rooftop solar, which will only push customers off-grid as solar and battery prices fall, and instead embraced electrification of heating and transportation, they’d have more business and profits than they’d know what to do with. As it stands, their intransigence means they are likely to share the fate of big oil/big coal and disappear altogether as cities and towns defect and create their own municipal utilities, or businesses and homes decide to adapt the sharing economy to local power generation and storage networks.
Future US energy production in a 100 kwh/person/day world might look something like:
Residential and commercial rooftop PV and building-integrated PV 15 kwh Biomass/biofuels/ geothermal/tidal 5 kwh Large-scale solar 32 kwh Nuclear 2 kwh On shore wind 28 kwh Hydro 2 kwh Off shore wind 12 kwh Wood heat 1kwh Fossil fuels for high heat industrial processes 2 kwh
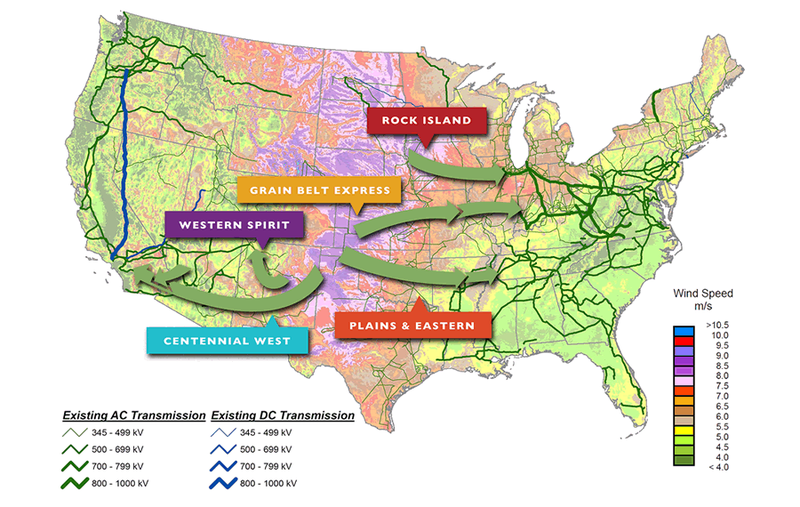 May be necessaryBecause of the intermittent nature of solar and wind, our national energy system will require batteries, pumped hydro storage, short term thermal storage, interseasonal thermal storage, microgrids, sophisticated and reliable grid operation, effective electricity markets, and long distance high voltage DC lines to transmit electricity from windy places. Much of our industrial production will need to go into building out the infrastructures necessary for renewable energy generation, for energy storage and transmission, and for electrified rail and other transit. But this infrastructure creation, combined with localized, small-scale, biointensive farming, will create tens of millions of jobs.
 Mr. Anti-EfficiencyAs we’ve seen, some states need to roll up their sleeves and get to work on energy efficiency, some have a lot of renewables to build out, and most need to do both. Hawaii, New York and California are low on renewable production per capita but they also don’t use that much energy. It’s possible each could get by with 70 or 80 KWH/person/day. Cold windy states may need 110 kwh/person/day, and humid southern states or sparsely populated Midwest ones may find that 120 kwh is the best they can do. But achieving an average of 100 kwh/person/day in the US is completely within our reach. To get the ball rolling, rather than continue to subsidize various forms of energy (the US subsidizes fossil fuels more than renewables), we should stop all energy subsidies, implement a briskly rising carbon tax, and invest the proceeds in energy efficiency, especially electrified rail/transit and zero-net-energy multifamily housing for low/moderate income households in walkable neighborhoods. Higher energy costs (the antidote to Jevons Paradox, for those who worry about that) will drive energy efficiency in spades, and we will be stunned (stunned!) at how quickly and innovatively the US economy adapts. We will find we can reach 100 kwh/person/day with technology that already exists while leading a pleasant, comfortable way of life, albeit one a bit different than the one we lead now.
  A lower decibel lifeOur streets and neighborhoods will be far quieter, for one thing. Our air and water will be cleaner, our bodies will absorb fewer toxins, our citizenry will be healthier mentally and physically, and the United States will finally be energy independent. We human beings alive over the next twenty years have the power to make this planet a paradise or a living hell. We can sabotage and delay the necessary changes out of fear or greed, or we can face our predicament and do what needs to be done. Entirely our choice.
March 31, 2016
An Energy Diet for a Healthy Planet--Part I
Part I: Envisioning 100 Kilowatt-hours/Person/Day
 Biodiverse farm of the future (Singing Frogs Farm)Nearly every human being on the planet consumes energy beyond the amount they derive from food, some more than others. In 2014, Americans, on average, consumed a total of 230 kilowatt-hours of energy per person per day. (See note at bottom for data sources and types of energy this includes.)
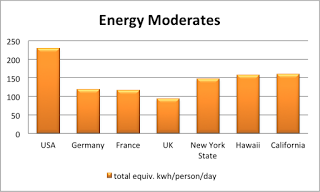 Is 230 kwh/person/day a lot or a little? How do we compare to other countries? As you can see, we use nearly double the amount of per capita energy as Germany and France, and nearly 2 ½ times the energy per capita of the UK. How can this be? Those of us who have visited Germany, France and the UK can testify that they have cold winters, warm summers, and that their citizens seem to enjoy a high standard of living. For comparison, I’ve included a few of the most energy-sipping US states.
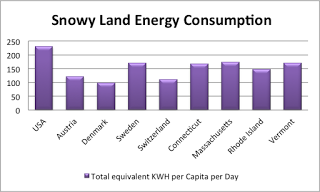 Let’s compare the US to some other countries. Ones that have snow. These countries on most measures offer their citizens a higher standard of living while using 3/4ths to 1/2 the energy per person that we use. I've compared them to our most energy efficient snowy-land states. Rhode Island manages to beat Sweden, anyway.
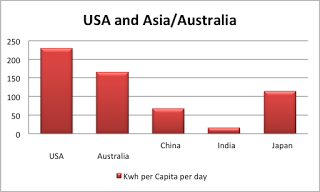 Here we compare the US to key Asian countries (plus Australia).
 And here are the big kahuna per capita energy gluttons of the world. Though the US might not tower over these guzzlers, we still hold our own. I've include some of our domestic guzzling states for comparison, all home to energy-intensive oil drilling, oil refining, or coal mining. (Texas would be on this chart if not for its huge population.)
A number of other states, while not energy sumo wrestles, are still obese when it comes to kwh/person/day and some outdo even Kuwait, as you can see in the chart below.
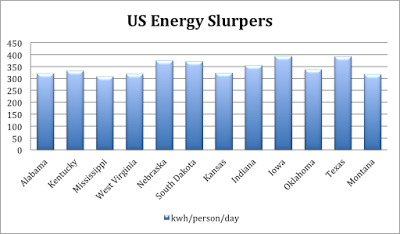
It’s interesting to note that even countries that are highly energy efficient have room to improve because they all still use substantial fossil fuels for transportation and/or space heating. While electricity at present provides only 16% of US total energy consumption, even the most electrified countries in the world don’t break 30%. The reason electrification is important is that in terms of wringing the most benefit from every kilowatt-hour expended, electricity is the way to go. Electric motors turn 60% of the energy fed to them into power at the wheels whereas gasoline engines convert only 20%. (Diesel motors convert 35 – 40%.) An air source heat pump is three times as efficient as the most efficient natural gas furnace; a ground source heat pump is six times as efficient. A heat pump hot water heater is generally four times as efficient as a gas one. And a desuperheater connected to a ground source heat pump will turn waste heat into hot water all summer with almost no additional energy at all.
In the US, our current energy per person/day energy budget is this: 51 kwh residential, 44 kwh commercial, 73 kwh industrial and 62 kwh transportation. (This includes losses incurred in thermal generation of electricity. More on this in Part II.)To get to 100 kwh/person/day, we’ll need the split to be more like this:23 kwh residential, 20 kwh commercial, 35 kwh industrial and 22 kwh transportation.
Right now 30 out of 51 kwh/person/day of residential energy is used towards space and water heating. With a combination of heat pumps, better sealing and insulation, solar hot water, energy exchange ventilators, and ceiling fans, we can drop total residential energy down to 26 kwh/person/day. Put in all LED lightbulbs and efficient appliances (and a few other items I'll mention in Part II) and we can drop it down to 21 kwh/person/day, below our future energy budget.
For transportation, less than 1 kwh/person/day comes from electricity, making it a key area in need of change. As you can see below electric forms of transportation are substantially more energy efficient than those powered by internal combustion engines.
Type of Transport
KWH to go 100 miles(For transit, per 100passenger miles) Gasoline car (22 mpg) 155 International air travel 99 Domestic air travel 69 Gasoline motorcycle 68 Gasoline car (50 mpg) 67 Amtrak (current load)
47 Transit bus (diesel) 36 Electric car (Leaf) 34 US light rail (mostly electric) 31 US heavy rail (mostly electric) 31 US commuter Rail (mixed) 26 Amtrak (ideal 80% load) 24 Gasoline scooter 18 Calif. High Speed Rail (projected) 16.4 Electric motorcycle 12 French High Speed Rail 7 - 8 Electric Scooter 7.5 Proterra Electric Bus 5.3 Around town walking 5.2 Japanese HS Rail 4.2 Siemens electric train 4.2 Around town biking 2.8 Electric Biking 2
Note: Around town bicycling and walking kwh/mile rates are calculated based on calories burned above baseline human metabolism (45 additional calories/mile walking and 32 additional calories per mile biking.) Transit, train and air travel calculated with 80% passenger load. Electric bike rate includes relaxed pedaling. Amtrak is a combination of diesel trains and all-electric.
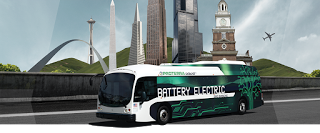 Has a 180 mile range between chargesOn average Americans travel 13,183 miles per person in a year. By private car (with average MPG and average occupancy) this amount of travel works out to 37 kwh/day. Way over the transport budget. If we drop travel miles by a fourth to 9900 miles/year (by a larger portion of us telecommuting and by most of us living closer to work, goods and services), that gets us to 27 kwh/person/day. This is still over the transport budget, and it doesn't include freight miles traveled. But if 2000 of those miles were by high speed rail, 3000 by transit, 2000 by air, 1900 by electric car (or rideshare) and 1000 by walking and biking, that squeezes down to 9 kwh/person/day.
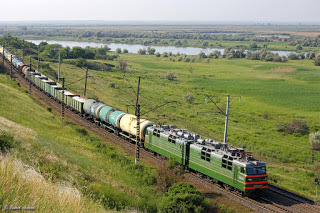 Seriously efficientNow let's look at freight. For each person in the US, 55 tons of domestic freight are moved an average of 325 mi. By diesel truck that comes to 58 kwh/day (and that doesn't include ocean shipping if it's an import.) Say we could cut this in half by buying local, by not buying stuff we don't need, by drinking filtered tap water instead of bottled water or soda, and by ending coal and oil shipments. That puts us at 29 kwh/day, still way above the travel budget. However, if we use diesel electric trains, each person's freight movement only comes to 2.5 kwh/day. If we use electric trains it gets down to .75-1.5 kwh/day, leaving a lot more room in the energy budget for passenger travel. No doubt with trains we'd have to add on a couple kwhs for the last 1 - 20 miles of delivery by electric truck, and international freight and water transport have to folded in here somehow, but all of the sudden 20 kwh/person/day for total transportation looks a lot more manageable.
Freight transport KWH per ton per mile 18-wheeler truck 1.19 Cargo ship .16 Diesel-electric rail .10 Electric rail .03--.06
As far as industry goes, Part II goes into this further, but for now I'll just point out that oil refining and coal mining use a 40% share of industrial energy. Get rid of both of those, and industrial energy use instantly drops from 73 to 44 kwh/person/day.
 Add in horses: 50% of energy (1850); 10% (1900)Still, wouldn't a 100 kwh/person/day energy diet be like going back to the Stone Age? Well, up to 1900, Americans lived on less than that. (Note: chart at right is in BTUs, not kwhs.) Aside from horsepower, most nineteenth century energy came from wood and coal, much of which they burned to power wildly inefficient steam engines and to heat drafty, poorly insulated houses. Today, all of South America, Africa and most of Asia manage to exist with less than 100 kwh/person/day, admittedly with a lower standard of living for the average person. (India survives on just 16 kwh/person/day!) But there are quite a few countries that achieve this energy diet with a comparable standard of living to the present day United States, including Italy (78), Ireland (93), Spain (90), and the United Kingdom (94). And then there’s Denmark with a higher standard of living than the US while using only 98 kwh/person/day. (Denmark, not resting on its laurels, has plans to drop to 95 kwh/person/day by 2020.)
Why should we care about a 100 kwh/person/day energy diet? We should care deeply because if we want to avoid climate catastrophe, we need to stop spewing carbon and methane into the atmosphere. Now it's true that 56 kwh out of the 230 we slurp up are completely wasted as unused heat in electricity generation, so if we switched to all renewables and hydro, we'd only need to build out 174 kwh/person/day. Still, it’s much, much easier to produce 100 kwh/person/day of carbon-free energy than it is 174. Climate change is accelerating faster than anticipated. If we let the permafrost in the Arctic melt, the methane released will produce a self-reinforcing methane timebomb that cannot be reversed. The result will be a planet largely uninhabitable by humans. (On the plus side, pine beetles, mosquitos, zebrafish, snakes, yellow-bellied marmots, and jellyfish will likely do quite well. So, hey, it could be worse.)
If we insist on slurping up energy at current levels, even with extraordinary measures it might take us fifty years to stop spewing emissions, and that will be too late to prevent permafrost detonation. But if we can get by comfortably with 100 kwh/person/day, that’s a much easier target to meet, one we can probably achieve in 20 years. Not only is this a target we can achieve faster, it’s a target we can achieve more cheaply. That’s because energy efficiency is absolutely the most economical form of energy production available to us.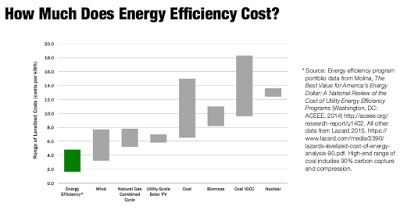 (Click for larger image)
While the cost of solar and wind will no doubt drop even more over time, in 2015 the US produced only 5 kwh/person/day of electricity from renewables (including rooftop solar) + hydro. Which means to get carbon-free we have a long ways to go. Even if we start building out solar PV and wind at 20 times the rate of 2012 (our best year ever), we won't be able to produce enough carbon-free energy fast enough to prevent catastrophe. But if we combine a rapid build out of renewables with a rapid lowering of demand through common sense behaviors and technology that already exists, we have a fighting chance. Find out how to do this and more in Part II!
Note: Most data in this post is from the 2015 BP Statistical Review of World Energy, probably the best compendium of world energy available, and from the US Energy Information Agency, the best source for state-level data. The per person per day energy figures include all large-scale sources of energy such as oil, natural gas, coal, nuclear power, hydro and renewables, their equivalent energy content turned into kilowatt-hours. They do not include rooftop PV or wood for heating or cooking, or energy expended to walk or bike for transportation. They do include all uses—residential, commercial, industrial, and transportation. Because our future will be mostly all electric, I’ve used kilowatt-hours as the energy unit of choice, better, in my opinion, than Tons of Oil Equivalent or BTU’s, although I acknowledge there’s a good case to be made for joules.
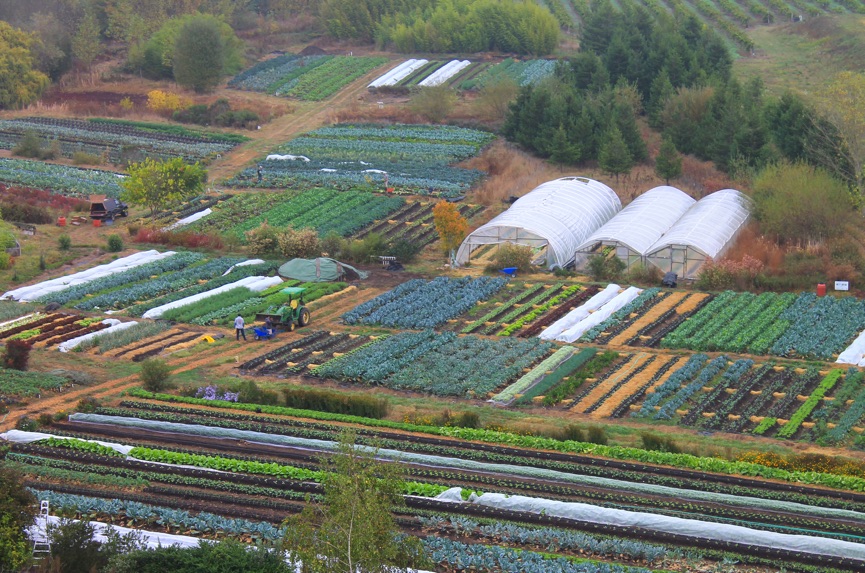 Biodiverse farm of the future (Singing Frogs Farm)Nearly every human being on the planet consumes energy beyond the amount they derive from food, some more than others. In 2014, Americans, on average, consumed a total of 230 kilowatt-hours of energy per person per day. (See note at bottom for data sources and types of energy this includes.)
  Is 230 kwh/person/day a lot or a little? How do we compare to other countries? As you can see, we use nearly double the amount of per capita energy as Germany and France, and nearly 2 ½ times the energy per capita of the UK. How can this be? Those of us who have visited Germany, France and the UK can testify that they have cold winters, warm summers, and that their citizens seem to enjoy a high standard of living. For comparison, I’ve included a few of the most energy-sipping US states.
 Let’s compare the US to some other countries. Ones that have snow. These countries on most measures offer their citizens a higher standard of living while using 3/4ths to 1/2 the energy per person that we use. I've compared them to our most energy efficient snowy-land states. Rhode Island manages to beat Sweden, anyway.
 Here we compare the US to key Asian countries (plus Australia).
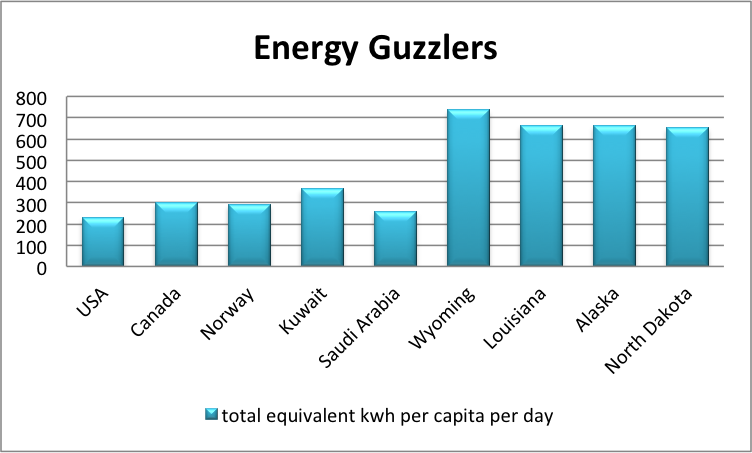 And here are the big kahuna per capita energy gluttons of the world. Though the US might not tower over these guzzlers, we still hold our own. I've include some of our domestic guzzling states for comparison, all home to energy-intensive oil drilling, oil refining, or coal mining. (Texas would be on this chart if not for its huge population.)
 A number of other states, while not energy sumo wrestles, are still obese when it comes to kwh/person/day and some outdo even Kuwait, as you can see in the chart below.

It’s interesting to note that even countries that are highly energy efficient have room to improve because they all still use substantial fossil fuels for transportation and/or space heating. While electricity at present provides only 16% of US total energy consumption, even the most electrified countries in the world don’t break 30%. The reason electrification is important is that in terms of wringing the most benefit from every kilowatt-hour expended, electricity is the way to go. Electric motors turn 60% of the energy fed to them into power at the wheels whereas gasoline engines convert only 20%. (Diesel motors convert 35 – 40%.) An air source heat pump is three times as efficient as the most efficient natural gas furnace; a ground source heat pump is six times as efficient. A heat pump hot water heater is generally four times as efficient as a gas one. And a desuperheater connected to a ground source heat pump will turn waste heat into hot water all summer with almost no additional energy at all.
In the US, our current energy per person/day energy budget is this: 51 kwh residential, 44 kwh commercial, 73 kwh industrial and 62 kwh transportation. (This includes losses incurred in thermal generation of electricity. More on this in Part II.)To get to 100 kwh/person/day, we’ll need the split to be more like this:23 kwh residential, 20 kwh commercial, 35 kwh industrial and 22 kwh transportation.
Right now 30 out of 51 kwh/person/day of residential energy is used towards space and water heating. With a combination of heat pumps, better sealing and insulation, solar hot water, energy exchange ventilators, and ceiling fans, we can drop total residential energy down to 26 kwh/person/day. Put in all LED lightbulbs and efficient appliances (and a few other items I'll mention in Part II) and we can drop it down to 21 kwh/person/day, below our future energy budget.
For transportation, less than 1 kwh/person/day comes from electricity, making it a key area in need of change. As you can see below electric forms of transportation are substantially more energy efficient than those powered by internal combustion engines.
Type of Transport
KWH to go 100 miles(For transit, per 100passenger miles) Gasoline car (22 mpg) 155 International air travel 99 Domestic air travel 69 Gasoline motorcycle 68 Gasoline car (50 mpg) 67 Amtrak (current load)
47 Transit bus (diesel) 36 Electric car (Leaf) 34 US light rail (mostly electric) 31 US heavy rail (mostly electric) 31 US commuter Rail (mixed) 26 Amtrak (ideal 80% load) 24 Gasoline scooter 18 Calif. High Speed Rail (projected) 16.4 Electric motorcycle 12 French High Speed Rail 7 - 8 Electric Scooter 7.5 Proterra Electric Bus 5.3 Around town walking 5.2 Japanese HS Rail 4.2 Siemens electric train 4.2 Around town biking 2.8 Electric Biking 2
Note: Around town bicycling and walking kwh/mile rates are calculated based on calories burned above baseline human metabolism (45 additional calories/mile walking and 32 additional calories per mile biking.) Transit, train and air travel calculated with 80% passenger load. Electric bike rate includes relaxed pedaling. Amtrak is a combination of diesel trains and all-electric.
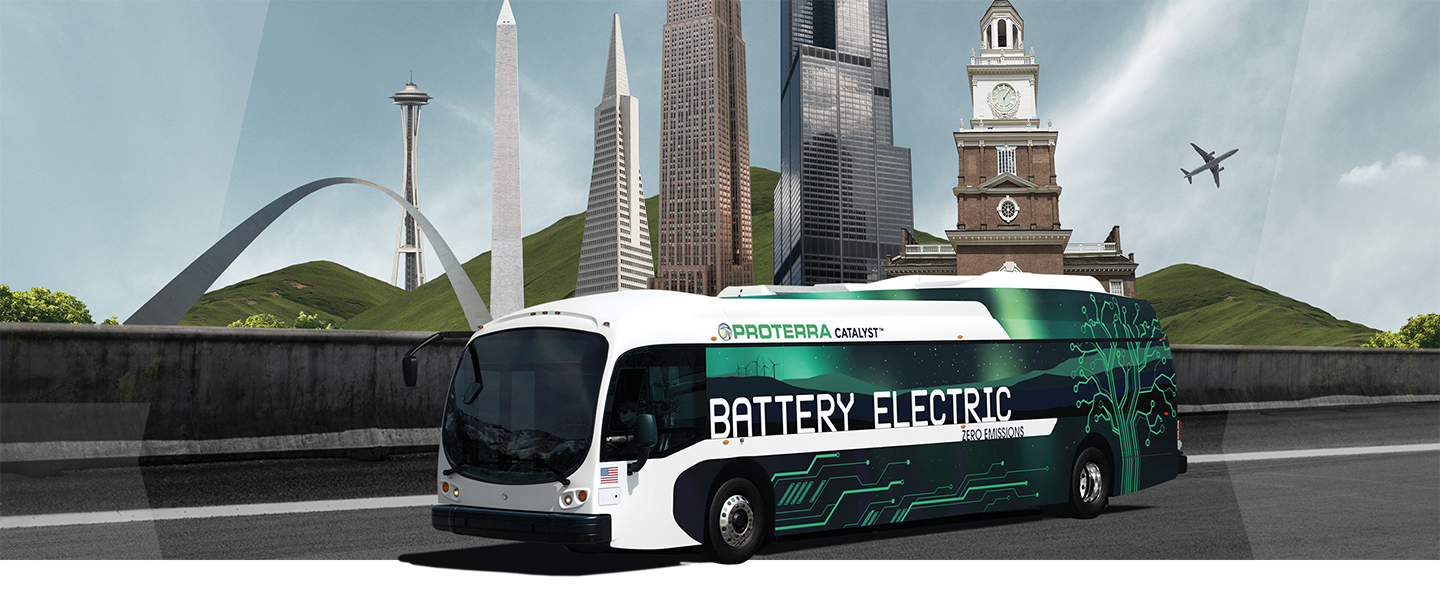 Has a 180 mile range between chargesOn average Americans travel 13,183 miles per person in a year. By private car (with average MPG and average occupancy) this amount of travel works out to 37 kwh/day. Way over the transport budget. If we drop travel miles by a fourth to 9900 miles/year (by a larger portion of us telecommuting and by most of us living closer to work, goods and services), that gets us to 27 kwh/person/day. This is still over the transport budget, and it doesn't include freight miles traveled. But if 2000 of those miles were by high speed rail, 3000 by transit, 2000 by air, 1900 by electric car (or rideshare) and 1000 by walking and biking, that squeezes down to 9 kwh/person/day.
 Seriously efficientNow let's look at freight. For each person in the US, 55 tons of domestic freight are moved an average of 325 mi. By diesel truck that comes to 58 kwh/day (and that doesn't include ocean shipping if it's an import.) Say we could cut this in half by buying local, by not buying stuff we don't need, by drinking filtered tap water instead of bottled water or soda, and by ending coal and oil shipments. That puts us at 29 kwh/day, still way above the travel budget. However, if we use diesel electric trains, each person's freight movement only comes to 2.5 kwh/day. If we use electric trains it gets down to .75-1.5 kwh/day, leaving a lot more room in the energy budget for passenger travel. No doubt with trains we'd have to add on a couple kwhs for the last 1 - 20 miles of delivery by electric truck, and international freight and water transport have to folded in here somehow, but all of the sudden 20 kwh/person/day for total transportation looks a lot more manageable.
 Freight transport KWH per ton per mile 18-wheeler truck 1.19 Cargo ship .16 Diesel-electric rail .10 Electric rail .03--.06
As far as industry goes, Part II goes into this further, but for now I'll just point out that oil refining and coal mining use a 40% share of industrial energy. Get rid of both of those, and industrial energy use instantly drops from 73 to 44 kwh/person/day.
 Add in horses: 50% of energy (1850); 10% (1900)Still, wouldn't a 100 kwh/person/day energy diet be like going back to the Stone Age? Well, up to 1900, Americans lived on less than that. (Note: chart at right is in BTUs, not kwhs.) Aside from horsepower, most nineteenth century energy came from wood and coal, much of which they burned to power wildly inefficient steam engines and to heat drafty, poorly insulated houses. Today, all of South America, Africa and most of Asia manage to exist with less than 100 kwh/person/day, admittedly with a lower standard of living for the average person. (India survives on just 16 kwh/person/day!) But there are quite a few countries that achieve this energy diet with a comparable standard of living to the present day United States, including Italy (78), Ireland (93), Spain (90), and the United Kingdom (94). And then there’s Denmark with a higher standard of living than the US while using only 98 kwh/person/day. (Denmark, not resting on its laurels, has plans to drop to 95 kwh/person/day by 2020.)
Why should we care about a 100 kwh/person/day energy diet? We should care deeply because if we want to avoid climate catastrophe, we need to stop spewing carbon and methane into the atmosphere. Now it's true that 56 kwh out of the 230 we slurp up are completely wasted as unused heat in electricity generation, so if we switched to all renewables and hydro, we'd only need to build out 174 kwh/person/day. Still, it’s much, much easier to produce 100 kwh/person/day of carbon-free energy than it is 174. Climate change is accelerating faster than anticipated. If we let the permafrost in the Arctic melt, the methane released will produce a self-reinforcing methane timebomb that cannot be reversed. The result will be a planet largely uninhabitable by humans. (On the plus side, pine beetles, mosquitos, zebrafish, snakes, yellow-bellied marmots, and jellyfish will likely do quite well. So, hey, it could be worse.)
If we insist on slurping up energy at current levels, even with extraordinary measures it might take us fifty years to stop spewing emissions, and that will be too late to prevent permafrost detonation. But if we can get by comfortably with 100 kwh/person/day, that’s a much easier target to meet, one we can probably achieve in 20 years. Not only is this a target we can achieve faster, it’s a target we can achieve more cheaply. That’s because energy efficiency is absolutely the most economical form of energy production available to us.
 (Click for larger image)
While the cost of solar and wind will no doubt drop even more over time, in 2015 the US produced only 5 kwh/person/day of electricity from renewables (including rooftop solar) + hydro. Which means to get carbon-free we have a long ways to go. Even if we start building out solar PV and wind at 20 times the rate of 2012 (our best year ever), we won't be able to produce enough carbon-free energy fast enough to prevent catastrophe. But if we combine a rapid build out of renewables with a rapid lowering of demand through common sense behaviors and technology that already exists, we have a fighting chance. Find out how to do this and more in Part II!
Note: Most data in this post is from the 2015 BP Statistical Review of World Energy, probably the best compendium of world energy available, and from the US Energy Information Agency, the best source for state-level data. The per person per day energy figures include all large-scale sources of energy such as oil, natural gas, coal, nuclear power, hydro and renewables, their equivalent energy content turned into kilowatt-hours. They do not include rooftop PV or wood for heating or cooking, or energy expended to walk or bike for transportation. They do include all uses—residential, commercial, industrial, and transportation. Because our future will be mostly all electric, I’ve used kilowatt-hours as the energy unit of choice, better, in my opinion, than Tons of Oil Equivalent or BTU’s, although I acknowledge there’s a good case to be made for joules.
March 4, 2016
Efficiency Is Not the Enemy of Resiliency
 "I ain't so tough."
I'm an odd duck. When I was in college, I started on a coterminal master’s in industrial engineering even as I was finishing up my undergrad degree in English. This meant I would go from Fiction Writing one hour to Circuits the next, a true ambi-cerebrum experience. After nearly a decade working in industry, I decided it wasn’t my cup of tea and reverted to my fonder love, writing. But my education and training left me with affection for efficiency, a fondness that to this day causes my heart to swell indignantly every time I see it maligned.
 Hemispherical cross-training
On a simplistic level, efficiency is maximum (or optimal) output with minimum waste. The output could be a product from a manufacturing line; it could be a warm house; it could be nutritious food to eat. Efficiency is not the opposite of resiliency. It does not equate with fragility. It does not, in and of itself, impede a system’s ability to cope with difficult conditions. In fact, it can vigorously improve that ability.
I think efficiency gets its bum rap because it sometimes involves eliminating wasteful redundancy. Poorly performed, without due consideration of externalities and risks, eliminating redundancy can indeed increase fragility. Efficiency is also closely linked in many people’s minds with just-in-time supply chains that have been deservedly criticized for being fragile and vulnerable. Let’s examine just-in-time first.
 My former lifeIn the 1980’s, I worked as a manufacturing engineer for Procter and Gamble while the company was in the process of implementing just-in-time into its operations. I managed teams that made and packed toothpaste. My days were noisy and minty. During those years just-in-time was explicitly adopted to reduce working capital tied up in raw materials and finished product. It was never, ever about efficiency, except perhaps efficiency of money. In fact, the short production runs just-in-time demanded lowered the efficiency of manufacturing because every changeover was costly in terms of set up time, product losses and machine reliability. In response, we engineers scrambled to reduce these costs, muttering under our breath the whole time.
  Theoretical perfectionHowever much just-in-time requires efficiency--in logistics, manufacturing, and shipping--it is not inherently efficient in and of itself. This is not to say there are no efficiency benefits to just-in-time. The longer finished goods hang out in a warehouse, the more they get beat up and eventually must be scrapped. Just-in-time keeps product from lingering long anywhere in the supply chain. For a product that has a defined shelf life (such as toothpaste) just-in-time reduces the likelihood a tube will expire before it gets to the consumer. And smaller batch sizes mean quality problems get identified and addressed earlier, resulting in less waste yet again.
 Efficient redundancyNow let’s look at redundancy. Efficiency, it’s claimed, creates fragility by cutting out the superfluous. On some level, this is true. No point duplicating functions and equipment if they’re not needed. The trouble comes when efficiency cuts slack to the point that a system can’t bounce back from trouble. I would contend that this occurs primarily when both the likelihood and cost of failure have been underestimated. An efficient system is not one that only works in the best case scenario but in most, if not all, scenarios. If the cost of failure is extremely high—say an airplane falling out of the sky—then an efficient system is one with enough back ups and redundancies to never fail because that is the optimal outcome. If occasional failure is okay, then fewer back ups and redundancies are needed. However, if we continually underestimate the likelihood of failure and failure’s cost, we will design efficient but brittle systems that fail far more often than we expect or want. This isn’t due to efficiency per se, it’s due to recklessness. On a personal level, if the cost of failure is a cold house, questionable water, or hungry bellies, it would no doubt behoove us all to have more than one way to heat our homes, have access to an emergency water supply, stock back up food stores, etc.
 TypicalWaste is not resilient. Worse, much of the waste in the US goes beyond inefficiency to wanton carelessness and downright stupidity. A full third of the food in the US that is grown, processed and transported will never be consumed. Most of this food not only goes on to create methane in landfills, it represents a huge amount of embedded energy used up for nothing. Leaking pipes in the US that lose an estimated seven billion gallons of drinking water a day are not resilient. Sprinklers that water streets and sidewalks are not resilient. Office buildings so cold that people run space heaters under their desks are not resilient, nor are apartments that are so hot that windows must be kept open in January. Vampire devices that suck energy 24/7 even when they're only used a few hours a day are not resilient, they are badly designed. Twenty-year-old refrigerators in the garage that do nothing but chill beer and soda pop are not resilient. Driving 5000lbs of steel half a mile to buy a loaf of bread is not resilient. And the list goes on.
 Just because the US doesn’t indulge in refrigerated beaches and indoor ski slopes like the United Arab Emirates doesn't mean we don’t squander resources wildly.
 Insanity in the desertThis becomes clearer when we compare ourselves to Switzerland, a country that consumes half the energy per person of the US while enjoying a higher standard of living on almost every conceivable measure. This is not because their population is more homogeneous (26% of the Swiss population is foreign born compared to 13% in the US) or because the Swiss are more urbanized (26% of Swiss live in rural areas compared to 15% in the US.)
 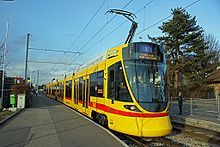 Swiss efficiencyIt’s true that Switzerland has fewer energy-intensive industries, so industry there uses only 20% of their total energy compared to 31% in the US. But it’s also true that lacking an indigenous supply of fossil fuels, the Swiss have spent decades becoming extremely energy-efficient, from highly sealed and insulated buildings to electrified transit to retrofitting with heat pumps. They encourage active transportation to the point that in Zurich, their largest city, 42% of all trips are now made by biking or walking. Another huge difference is that the Swiss tax gasoline at $2.99 per gallon. (Remarkably, this is one of the lowest rates in western Europe.) As a result, the Swiss use one-fourth the fossil fuels per person compared to the US. And they could use less! 60% of their space and water heating still comes from heating oil or natural gas. They have a lot of hydroelectricity but little in the way of other renewables. With solar PV and more heat pumps, they could cut their fossil fuel use in half yet again.
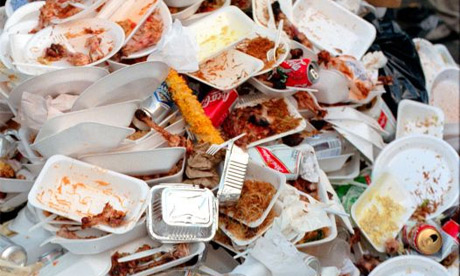 Toss, toss, tossWaste does not make prosperity; it does not create resilience. Sometimes waste is a proud announcement of wealth. After all, only the truly wealthy can destroy for naught what others need just to live. I’ll point out that while I worked in industry, I was never once asked to minimize carbon emissions or energy use. Neither were considered important variables to optimize in the production equation. If they had been, our team of engineers would’ve jumped all over them. That’s what engineers do, they optimize. But they only optimize the variables they’re told to, because if they argue too much, they’re not a team player and their next performance review doesn’t go well.
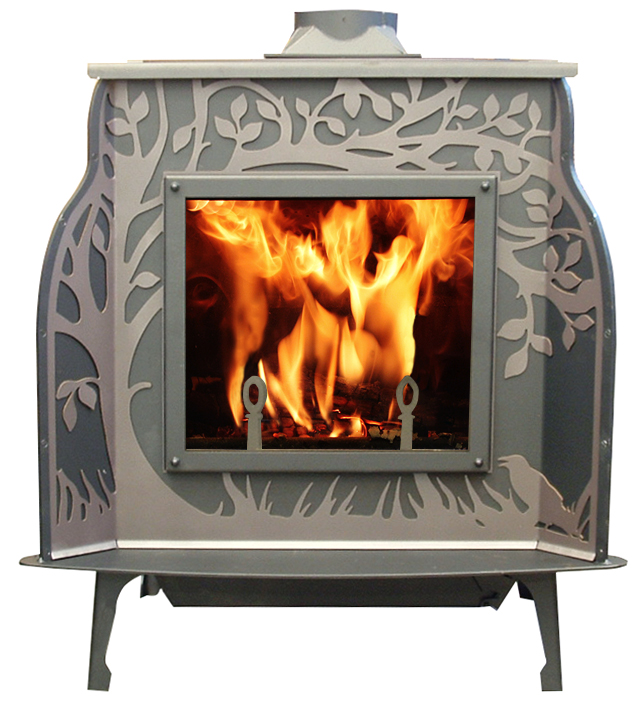 Less workRest assured, efficiency cancreate resiliency. A well-sealed and insulated house is far easier to heat and cool whatever the fuel source. (Passive houses can be heated by body and appliance heat alone.) LEDs cost much less than other bulbs per hour of use and last for decades. Bicycles are the most efficient form of transport ever devised. Water-efficient appliances not only use less fresh water, they reduce the load on your community’s sewage system. High-efficiency woodstoves require half the cutting and stacking of wood as conventional ones and put out a fifth of the particulate matter. Walking thirty minutes a day is the most efficient form of mental and physical health care there is. These kinds of efficiencies build resilience. They don’t reduce it.
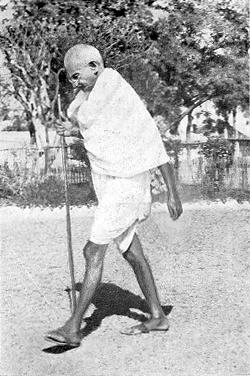 No speed demonEfficiency is certainly not a be-all or end-all. Just as there is more to life than increasing its speed (thank you, Gandhi), there is more to life than optimizing its output. Growing vegetables in the backyard may be less efficient than buying from a commercial grower, and home and community solar panels may be less efficient than utility-scale PV located hundreds of miles away, but both will increase the resiliency of that household or community. Even better, they’ll make that household or community less passive and more in control of their own destiny. This beats efficiency hands down.
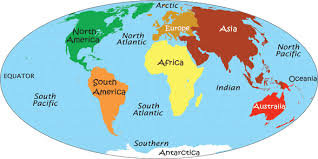 Waste from green can power orange and yellowI will admit that some awful, awful things have been done in the name of efficiency, from urban renewal projects to concentration camps. This doesn’t mean efficiency was the root cause--often efficiency is a flashy banner flown to obscure true motives. Immoral and unethical actions should never be taken under the guise of efficiency; efficiency should always be a servant to human and planetary well-being rather than an altar on which to sacrifice either. But in a country where waste and profligacy have been enshrined as almost a birthright, a country that squanders a nearly unimaginable wealth of resources each and every day, a wise application of efficiency would go a long way towards making our communities more prosperous and resilient. Not to mention that if the US suddenly consumed energy at Swiss levels, the energy leftover from our current consumption could power the continents of Africa and South America. (One third of the population of the planet!) It's time to make efficiency our friend, a very dear one, not our foe.

