
Vivek Sood's Blog, page 53
May 7, 2014
HOW SUPPLY CHAIN 3.0 CAN LEAD TO TANGIBLE BUSINESS BENEFITS (Part 4 of 6)
 I hope by now you have grasped the business model in which Supply Chain 3.0 resides. Before we examine all the concrete benefits of Supply Chain 3.0, let us briefly differentiate it from its predecessors. Table 1 sets out to do that:
Table 1 – Supply Chain Metaphors
Supply Chain 0.0
Supply Chain 1.0
Supply Chain 2.0
Supply Chain 3.0
Value Addition
Uncertain
Accretion
Synergy
Synchronicity
Mathematical Principle
2+2 ???
2+2=4
2 & 2 = 5
2 & 2 is 22
Physical Metaphor
Folk lore
Mechanical (Newton)
Quantum (Max Planck)
Relativity (Einstein)
Cognitive Principle
None
Impulse
Conscious
Sub-conscious
Organisational Metaphor
Brownian motion (Chaos)
Chronometer
Orchestra (feel the well-arranged and rehearsed music)
Schools of fish (see the spontaneous music in action, changing every second)
Visual Metaphor
Candle
Torch
Laser
Sunlight
Key Co-operation Mechanism
None
Control (Forced)
Co-ordinate (Labored)
Co-create (Spontaneous)
Economic Metaphor
Barter – primitive economy
Free Markets – Invisible hand
Managed Markets – Firm hand
Networks – joined hands
Economic Principle
Foragers
Scarcity
Prosperity
Abundance
Key Actors
Gangs (Tribes)
Individuals
Organisations
Networks
EconomicGuru
None
Adam Smith
J. M. Keynes
Barry Nalebuff
Management Guru
None
Peter Drucker
Alfred Chandler
C.K. Prahalad
I must add here that this is yet a preliminary table; many of the concepts being presented here are still being explored. To the best of my knowledge they are articulated for the first time in The 5-STAR Business Network. I am leaving the full discussion of this table to future blogs because it will take a lot of time to explore the fundamental differences between each generation of supply chain and the triggers that launched the next generation.
Whether you are a small, mid-market or large corporation, whether the economic volatility is high or low, whether the economic growth environment is high or low – in almost all situations for every company, supply chain 3.0 provides outstanding benefits over and above its predecessors.
Why?
Because it helps leverage the power of business networks with external partners. Let me explain further.
Who says Elephants cannot dance – all you need is good music
Large businesses are notorious for moving too slowly and being less nimble than their smaller counterparts. Layers of management, volumes of policy and procedures, risk management protocols are all designed with good intent. However, over a period of time as the intention becomes blurred and the link between the purpose and edict becomes more and more tenuous. In other words, old companies just get old and sclerotic, and lose their suppleness.
Dozens of large companies are discovering that the best way of retaining nimbleness in face of above situation is to formulate tight-lose supply chain relationships with other, more nimble companies. This is not restricted to business process outsourcing arrangements, or Japanese style Kieretsu structures. Almost all companies try and keep their labour force numbers flexible by using some form of sub-contracting, for example. At a higher level of value added, collaboration between entities for research, new product development and customer solutions creation increases the nimbleness and responsiveness of old age corporations.
Small companies can have a much larger impact with supply chain 3.0
If the impression so far is that supply chain 3.0 is only for larger, more established companies, it could not be more wrong. In fact, supply chain 3.0 is even more useful for smaller companies who can project their strengths and best attributes on a far wider scale using their 5-STAR Business Networks.
Now Red Bull is a large company, but cast your mind back a few decades when it was a small start-up competing in the global beverages industry against much larger giants. Gaining traction in more than 100 markets in a matter of 2 decades against the formidable competition who took nearly 7 decades to do that was no small feat. It would have been next to impossible without due regard to a close network of business partners and service providers.
But Red Bull is not the only example of a smaller player running rings around their much larger competition by configuring their 5-STAR Business Network.
We have helped a number of our client corporations achieve similar results in industries as diverse as solar energy, retail, chemicals, heavy engineering, machine tools and FMCG. More pertinently, we have used the same concepts in our own business to help our clients create results far superior than our top-tier strategy consulting competitors could. Most clients are surprised when they come to our office when they see how small our core operations is – because based on our results and global reach, they expect our company to have a much larger regular payroll.
Find out the concrete benefits of Supply Chain 3.0 in the next blog entry of this series.
Author: Vivek Sood


May 6, 2014
HOW SUPPLY CHAIN 3.0 CAN LEAD TO TANGIBLE BUSINESS BENEFITS (Part 3 of 6)
 In the previous blog entry of this series, I have outlined a customer centric business model, which is also captured in my book The 5-Star Business Network. Now let us delve into the evolution of supply chain models, or how Supply Chain 3.0 came about.
In the old model of supply chains, businesses used to relate to each other in a very linear model
The customer centric model mentioned in the previous post is still a model of last decade and later in this piece we will see the reasons for this assertion. First, let us examine the impact of this model in practice of the commerce as conducted by many companies today. Due to persistence of traditional supplier-buyer relationships, when this model is applied across multiple organisations it morphs into an unworkable hierarchical structure shown in Figure 1 below.

Figure 1 – Traditional Supply Chain Collaboration Model – Supply Chain 2.0 or less
Imagine if 5 of more organisations are linked in a multi-layer structure shown above. Unfortunately, that happens to be the case with many large organisations that compete with Apple in the market-place today. While such a structure minimises cost and responds predictably to all external stimuli, it is not suitable for the world of rapid change we live in today.
Today, businesses collaborate in a robust network
Success of Apple has shown that in the next decade this model needs to be supplemented by an even more evolved model which we have called Efficient Global Leadership model (EGL model for short). In this model we recognise that no single organisation by itself is in a position to service all the needs of a customer relating to even a single product. The fact is that two or more, in general three organisations come together as a supply chain, work together collaboratively, to fulfil the customer’s need.

Customers at the heart of your supply chain
Figure 2 – Super Networked Business Model – Supply Chain 3.0
As shown in Figure 2, each one of these organisations work in close harmony with each other, where the research & development teams of each organisation work together as do marketing teams and even sales teams of these organisations.
To create products, and then to manufacture those products, the production teams and the procurement teams work together to put those products in customer’s hands. In such a model, close collaboration is required among the supply chain partners to create market and sell the products.
Similarly, close cooperation is also required to produce the products, move the products and store the products in such a way that highly innovative products are produced in shortest period of time at a fraction of the cost of traditional products and put in customers’ hands extremely quickly.
Needless to say, when Apple manages to put out one innovative product after another in the market place, it is not only its own innovation but also an innovation of all its partners, which is at play here. Only when companies work together in such an efficient leadership model, do they achieve the level of success which Apple has achieved over the last 5 to 10 years. Figure 3 reminds one of the team huddles as shown below:

When an individual works on his own he is neither very efficient, nor very effective. That is the key reason, from early civilisations, humans have created organisations that give them the benefit of either effectiveness, or efficiency, or a bit of both. Figure 4, on the other hand reminds one of camel trains or dog sleds – where one animal is closely following another as shown in the picture below. Now imagine what would happen to the whole camel train, if the first beast lost its way!

Naturally, the question is why is this important? Think about it for a minute. In fact, stop reading and just reflect on the metaphors. A camel train was a great technology – but is now largely redundant. Moreover, with a limited room to collaborate, it is essentially a command and control organisation. In periods of rapid development, if such organisations stick to the tried and tested, they get left behind by their more innovative peers.
If you would like to see how Supply Chain 3.0 differ vastly from its predecessors, please read the next blog entry of this series.
Author: Vivek Sood
May 5, 2014
HOW SUPPLY CHAIN 3.0 CAN LEAD TO TANGIBLE BUSINESS BENEFITS (Part 2 of 6)
I have set the scene in the first entry of this blog series. Things are changing, moving, and old business models are not working anymore. That is why I proposed even a new organisational model in my book The 5-STAR Business Network from which some of the following excerpts are taken with modifications.
Business Model has changed and most people are yet to understand the profound change
It is a well-known aphorism in the circles of architecture that form follows function. In other words, the structure of a particular unit, in general, evolves to facilitate the functioning of that unit. Moreover, if the form does not match the function, the structure will change or the function changes over a period of time.
While conducting research, we examined the organisational structure of more than 50 companies; almost all of them looked variations of the generic structure given in the figure below:
Figure 1 – Traditional Organisation Structure

The titles in the boxes, as well as placement of the boxes, vary quite a bit; however, most companies still agree this is the best way to look at how they are organised to serve their customers’ needs.
At the same time, most of these companies have evolved within the last 2 decades; their functioning has become almost entirely customer centric with their customers’ priorities driving most of the business workings.
In our work with corporations, I have frequently found that the supply chain structure frequently results in limiting the effectiveness of the organisation. The traditional structure of the organisation shown above frequently stifles customer responsiveness and innovation. In the modern outsourced-globalised world, a traditional structure with very strict hierarchies and internal walls between departments is a hindrance rather than an aid for achieving success in business.
In today’s hypercompetitive world of consumer electronics, Apple is a standout among peers as great as Sony, Samsung, Panasonic, Motorola, Nokia and Dell. With convergence, all of these companies are vying for their share of consumer wallets with increasingly similar looking products which do similar things. What did Apple do that its market value now nearly surpasses Microsoft’s? How did it manage to get over entrenched competitive advantage of companies such as Sony, Motorola or Nokia?
Your organisation chart is the wrong model for your business
Our work in global supply network strategies and supply network design has convinced us that a modern distributed organisation needs to look at redesigning its explicit structure to keep up with the realities of the modern world. The business world has changed tremendously in the last 20 years.
A typical supply chain now runs across multiple continents seamlessly, through boundaries of several organisations, to finally serve a customer with a unique product. To do so, organisations have created de facto structures, which are far different from the traditional structures that they have put in their organisation charts.
The purists might argue that this does not really matter if the organisations are already acting in accordance with a de facto structure – an argument which holds some merit. However, people who make up an organisation respond to the explicitly shown structure with much more enthusiasm and clarity that to a de facto or mutually understood structure.
I believe that organisations should formalise their de facto structures and use them to gain further competitive advantage. For this purpose, we have created the following model:
Figure 2 – Customer Centric Organisation Structure

Customers at the heart of your supply chain
The customer centric model shown in Figure 2 starts with customers at the apex of the organisation. Clearly, it is the customer’s need which the organisation is trying to serve and aligned to this customer is the sales team, which is in direct contact with the customer all the time.
The function of the sales team is to have intimate understanding of the customer needs, customers’ usage of its products and their demographics, psychographics and profile. Only then can an organisation create successful products, which will gain wider acceptance in its customer base.
An organisation can outsource almost everything it does, but it can never outsource its sales. Sales are a fundamentally, integral part of an organisation’s structure. Virtually everything else but sales, could be done outside the organisation. However, two other key functions which are equally important and support the sales teams and also customer phasing are marketing and research & development. Between them, these three – sales, marketing and research & development – form the top tier of the modern organisation’s structure. However, both research & development and marketing can be outsourced, so long as the company and its core team control the outsourced entities.
Forming the second tier is the foundation of the organisation – the supply chain, which incorporates procurement, production and logistics. They are the support base or the backbone of the organisation, which are frequently outsourced either to single provider or to a multitude of ‘best-of-breed’ providers around the world in such a way that the customers’ needs are met seamlessly without any visibility of where any of these activities are actually carried out. It is interesting to note that this customer centric model merely illustrates the actual structure that most modern organisations have evolved into.
What’s surprising is that most business schools and management theories are still persisting with outdated organisational models of 80s and 90s, which bear no resemblance to the actual way businesses are choosing to structure their organisations. Please read the next entry in the series to find out how models of supply chains have evolved.
Author: Vivek Sood
May 4, 2014
There Is Only One Key To Success
 Business books, blogs and literature are full of secrets of success. A recent experience taught me that it need not be too complex. Why do I call it the only one key to success? Hopefully, that will be clear in the next 5-10 minutes it takes to read about this incident.
This post is simple – it is simply a recount of a true incident. It involves another person who worked in our company Thomas Radrigan and I have his permission to post it.
We were working on a supply chain diagnostic project for a client (sorry, we do not reveal clients’ contextual information or identity) and the final presentation to the senior executive team was due the next day. The CEO and some other executives were flying in from places as far away as 5 hours. We had booked 3 hours for the presentation, over 6 weeks in advance, and people were coming in just for this meeting.
We had been working hard since the last executive update 2 weeks ago, and had done great analysis with some brilliant insights into key supply chain problems. We had a slide pack of about 35 slides with supporting appendix of another 50 slides. This slide pack detailed our recommendations for way forward based on a very thorough fact based analysis.
Around 7 pm in the evening on the day before the presentation, with just the last couple of slides left to be polished, and the rest of the team already having left for the day, I asked Thomas to finish the two remaining slides and email me the final presentation. I had to go and pick up my son from his swimming lessons and take him home.
On arriving home as I prepared for dinner with my family, I poured a glass of red wine and was having conversation with my sons about their day. I was also waiting for an email on my phone with the final presentation from Thomas, and silently getting worried when the email did not arrive as anticipated.
Suddenly I got a harried call from Thomas asking whether I could come back to the office. He explained there was some problem with his laptop and that is why he could send me the final presentation.
On arriving in the office, we found out the the hard drive of Thomas’ 2 month old laptop had crashed (I am fighting temptation to name the manufacturer of the hard drive and the laptop). Worse still, despite very strict policies around backups, Thomas had forgotten or ignored to allow backups for the past few days (the excel files were huge and even his brand new laptop slowed down considerably while backing up – that was his reason/excuse).
We looked at the available backups and found one from 4 days ago. However, sifting through the backup copies of data files and finding the usable versions took another 2 hours.
So, here we were, two of us sitting in office, with about 25% complete presentation at about 11 pm. The one saving grace was that all the material was fresh in our memories because the crunch work was only done in the last week or so. It still had to be put back in proper format and backed-up with data.
I asked Thomas whether he wanted to call any of the other analysts for help. He rightly decided that would take too much time. He committed to do WHATEVER IT TAKES to make the presentation right before the meeting at 10 am.
Two of us buckled down – recreated all the lost analysis and excel charts, and put these into the presentation. Obviously, it was not as polished as the original presentation, and some marginal insights were missing because we could not remember everything.
However, we managed to recreate 80% of the original work by about 3 am when I dropped Thomas at his apartment. (3 am is the shift change time for taxis in Sydney, and sometimes they take as much as half an hour to arrive after picking up the bookings).
Next day we made the presentation to the executive team who commended us very highly for the depth of analysis AND the QUALITY of the presentation. I briefly mentioned that most of the presentation was hurriedly put together by Thomas between midnight and 2 am, and, it was not really up to our usual standards.
On discovering the full story, most people could not believe it. The CEO commented that Thomas was more committed to his company than he was. The entire team gave Thomas a standing ovation for his commitment. Needless to say that the project went on to be a huge success for everyone.
My learning from the incident was that there is only one simple key to success – DO WHATEVER IT TAKES. There come those occasional moments of truth in life where we can back off, or do whatever it takes to succeed.
Thomas, of course, became one of the big stars in our company and even when he wanted to move countries to pursue his personal life agendas I was very reluctant to let him go. I tried to do whatever it took to retain him – but in the end his love interest won out. All the best to him.

HOW SUPPLY CHAIN 3.0 CAN LEAD TO TANGIBLE BUSINESS BENEFITS
In this series, I will address the second question raised at the start of the previous blog series – “What are the benefits of supply chain 3.0?” Before answering that question, let me go over the three type of responses I generally get when I explain to people that supply chain 3.0 is real.
Most of the McKinsey (or their clone) trained strategists ask me to show data to back up this assertion. On the other hand, more intuitive executives (mainly from sales and marketing background, as I observe) ask me to explain the benefits of supply chain 3.0. Finally, the third group – those who I call the transformational leaders ask a simple question – how can we use the power of supply chain 3.0 in effecting beneficial business transformations.
First a caveat – no benefit accrues to those who do not act. And, not just any random action will suffice (though, in most cases, any action is better than no action); you need action based on cohesive, strategic thinking. That is the reason for the word “can” in the title of this post – all benefits are just potential energy till converted into reality by your kinetic energy.
Of course, I have not yet talked about how supply chain 3.0 differs from its previous version – supply chain 2.0. While the full detail of that is a subject for a future blog post, it will be necessary for us to know that these are different, and that supply chain 3.0 is a step change above supply chain 2.0. So, we will briefly delve into various avatars of supply chains as we look at the benefits of supply chain 3.0.
To understand the potential benefits of supply chain 3.0, let us look at the current business context. The best way for me to get you thinking along the same line as me is show you the following slideshow with just 14 slides from UNDERCURRENT:
The Operating Model That is Eating the World from undercurrent
It will probably take you no more than 7 minutes to quickly peruse this material and I have no intention of taking credit for the original thinking by the makers of this slideshow. That is why I am neither paraphrasing it, nor taking from it – something I see happening with my material more and more, even in the erudite circles.
My personal takeaway message from the above slideshow is that something immense is happening across the world of business. Combination of globalisation, bandwidth, rising standards in the east and financial adjustments in the west are creating both opportunities and threats everywhere.
Recently, someone sent me the link to a cartoon by marketoonist.com, which I show below for comment. They quipped to me that retail business model is toast. I agreed, but asked in return “which model is safe”. Think deeply enough, especially in line of the material in the slideshow and you can see the same threat lurking everywhere in many different forms.

Retail business model is toast?
But the old cliché is right. Every threat does hide an opportunity. I believe this despite the fact that I do not know enough Chinese language to attest to the fact that the Chinese character for threat and opportunity is the same (unfortunately, I could not learn any Chinese through-out the translation of my book into that language).
There is a lot of talk about VUCA – Variability, Uncertainty, Complexity and Ambiguity – when strategists discuss the business environment today. It is a bit ironic that so many military terms get incorporated in the strategy parlance during the time of duress.
However, one thing is clear – that old organisational models are not adequate anymore. New challenges need new responses. In the next entry of this blog series, I will discuss about business models, how they have changed and the effects on supply chain.
Author: Vivek Sood

May 1, 2014
Globalisation is inevitable – prepare for it
 When we renamed our company Global Supply Chain Group in 2006, the key thought running in my mind was that despite clear and evident trend of globalisation – most companies still ran their supply chain on a regional basis. Many of our clients see value in global integration of their entire supply chains – while others continue to persist with artificial internal barriers, often to their own detriment.
Think about a product – any product – and try and trace its entire supply chain from origin to consumption. You will be surprised to discover how globally extensive its supply chain is.
If in the times of camel trains and carrier pigeons we could find ways of getting silk from China into Rome, and spices from India into Venice then today with the current technology almost everything can be carried from anywhere to anywhere.
I can understand the public’s reluctance to accept the trend – that is just human. All change is seen as a threat, unless it clearly shows its benefits. So, when fringe elements on far left, or far right, protest globalisation it does not come as a surprise. That is why I am expecting this blog post is likely to be somewhat controversial in some quarters. However, those same protesters do not think twice before enjoying the fruits of globalisation – coffee from Columbia or cotton grown in Egypt.
What is surprising is the resistance to globalisation of supply chains in mid-management levels within many companies. No, it does not mean that everyone has to move their factories to China, or their call centres to Philippines. It just means using objective fact based analysis to make supply chain decisions.
It is undeniable that the current trend of globalization is only going to accelerate. Never before in the history of humanity have the business networks been so global, diversified, powerful and useful.
It is also undeniable that the most powerful networks on earth today act cohesively as Supply Chains. Whether these are technology companies such as Apple or Dell, or these are mining giants such as BHP Billiton or Rio Tinto – all supply chains are now truly global.
Come and harness the power of global supply chains for you – share your thoughts, make new powerful connections, or simply participate in discussions when it suits you.
We invite you to join this useful group on linkedin called – what else – Global Supply Chain Group on Linkedin.
Related articles
 A Diplomatic Renaissance In GlobalI Politcs And International Relations – Analysis
 Management of supply chain vital
 Closing the Gap Between Supply Chain and Business Strategies
 China Has Accomplished Something In Global Trade Not Seen Since Colonial Britain
 Can You Afford The Risk?
April 29, 2014
SUPPLY CHAIN 3.0 IS REAL, AND HERE NOW (Part 3 of 3)
 In the last entry, I have talked about the first two pillars underpinning Supply Chain 3.0. So, what are the other three key cornerstones?
Transaction Optimisation Profitability (TOP) measures the ability to simultaneously minimize the costs, and maximize the revenues on each transaction that a company enters into. Consider this – there are companies today that change their pricing dynamically more than 10 million times a month.
Why? To able to maximize their revenue based on pricing power they gain out of big data analytics. On the other hand these, and other, companies are constantly looking at ways to shave off fractions of pennies from each of their cost creators. There is a full discussion (chapter 10) of this in the book “The 5-STAR Business Network” and, if time allows, I might even write a whole book on this topic alone at some time in future. This is after all the hallmark of supply chain 3.0.
Advanced Product Phasing (APP) measures the ability of a company to create a pipeline of products that lead it to sustain its market leadership. How many one-hit wonders such as blackberry have you seen? Is Apple, after Steve Jobs, losing its Advanced Product Phasing capability? How can a company balance its drive to milk the current products with its drive to create new products? These are some of the interesting questions that you can explore in more detail once you start thinking in the realms of Advanced Product Phasing (APP). Suffice it to say here that it is one of the key cornerstones of supply chain 3.0.
Finally, Results-focused, Modularised Outsourcing (ROM) is so important to supply chain 3.0 that I have already written a follow-up book to talk about this concept. If you read nothing else on this topic, just the foreword by an illustrious strategist and CEO (Philippe Etienne, Managing Director & CEO, ) is worth reading. Here is an excerpt:
Today, when I mentor C-Level executives on how to make the jump to the role of CEO, many struggle to move their thinking from functional excellence to cross-functional leadership. In many people’s minds, even the characterization of a corporate leader seems to be shrouded in mystery– ranging from a motivational speaker to a whip wielding slave-driver.
One thing I have noticed all good corporate leaders have in common is their ability to pick and extract the power from uncommon teams – teams of internal experts and external service providers who can aggregate, work well together under pressure, and create the magic called success.
That is where it becomes critical to outsource well. No doubt, today every company outsources at least some part of its activities. With outsourcing being so ubiquitous now, and of such strategic importance that some of the best known businessmen on earth spend a significant amount of their time getting it right – it is a wonder why many people are not taking it just as seriously as these business stalwarts are.
So, what does the data say about how real is supply chain 3.0. We already noted that 62 companies meet the cut-off of 20 points out of 25. Let us now look at the rest of the database and try to answer the question that is on everyone’s mind.
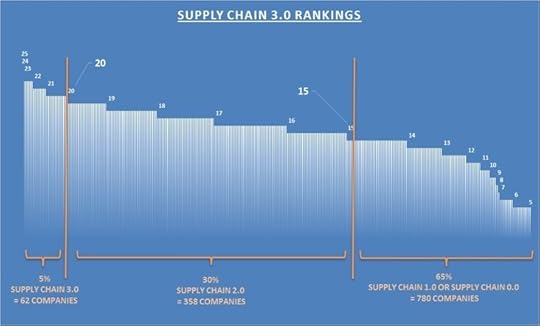
Figure – Ratio of Market Value to Profit in 2012 for 932 companies
As shown in the figure above, only 5% of the companies in our dataset of 1200 global leaders meet the criteria for supply chain 3.0 and another 30% meet the criteria for supply chain 2.0. Rest of the companies (nearly 65% or 780 companies out of 1200) are somewhere between supply chain 0.0 and supply chain 1.0.
You can see the list in the appendix of the book “The 5-STAR Business Network“. Just be mindful that no company is uniformly excellent, or sub-par in all its divisions and geographical areas, although the results above show them as such. From our work in various divisions of the same corporation we know that pockets of excellence do exist in many sub-par companies and vice-versa. In fact, one of the biggest sources of supply chain friction is exactly this – the variability (sigma) of supply chain performance between various parts of the same business network. But, that is a topic for another blog.
While we have seen from the data above that supply chain 3.0 is real, here and now. In future blog posts we will establish the internal workings of supply chain 3.0 and show the transition points from supply chain 2.0 to supply chain 3.0, from supply chain 1.0 to supply chain 2.0, and further on from supply chain 0.0 to supply chain 1.0. Why was it necessary to ‘invent’ supply chain management in the first place. There already existed the discipline of logistics, materials management, inventory management etc.
A company’s position on this spectrum will ultimately dictate its performance. Just as is the case in professional golf or tennis – winners in the game of supply chains or business networks take away bulk of the prize pool.
Author: Vivek Sood
Related articles
SUPPLY CHAIN 3.0 IS REAL, AND HERE NOW SUPPLY CHAIN 3.0 IS REAL, AND HERE NOW (Part 2 of 3)
In the last entry, I have given you a brief outline of the five pillars supporting Supply Chain 3.0. Let’s now talk about the first two.
The first is termed Fire-Aim-Ready (FAR) Innovation. Clearly, it is about creating new (better) products and services, as well as new (better) ways of configuring and delivering existing products and services. Many in supply chain – especially those from logistics or procurement – wonder what do they have to do with innovation. This mindset of not-invented-here survives from the days of materials handling (pre-supply chain days, or Supply Chain 0.0 days) in many quarters and gives supply chain a bad name when it manifests itself.
But let me ask them this – How did Apple create and launch products in nearly half the time it took its rivals while keeping utmost secrecy about the product features? The answer will give a clue to how important it is to choose the right suppliers and create the right supply chain arrangements that elevate the supply chain to lofty heights. Apple is only the most visible example, there are many more in the book 5-Star Business Network.
Looking at the entire dataset, here is how the companies stack up on Fire-Aim-Ready Innovation.
Figure 1: Fire-Aim-Ready (FAR) Innovation Rankings – Supply Chain 3.0
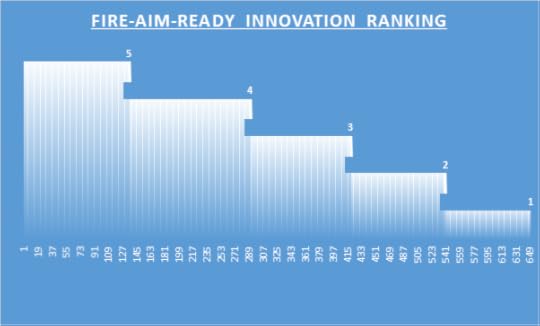
You might ask why there are only 650 companies in the dataset when we started with 1200 companies. The reason is that over the period of the study (five-years) many of the top 1200 companies were acquired, or merged with other companies to change names. Also, many others dropped out of the top 1200 companies and were no longer of interest to us. In the end only 932 companies survived (we have ignored banks, insurance and utility companies) over 5 years in their original form to be useful for a longitudinal external study of this nature. Some companies (mainly in Banking, Finance, Insurance, Utilities and other such sectors) were not of interest to us because of their opaque supply chains and highly regulated operations.
At this point it is useful to also state that every company in the dataset was given a ranking based on the quintile it fell into on each of the five measures. That is why maximum possible points were 25. Full methodology is available in the source document, but the reason was that external data is rarely reliable enough to rank more accurately than that.
The second measure of interest to us is the $eed-to-$tore Efficiency. This, is of course, the darling of the supply chain crowd especially those coming out of logistics background. Right product, in right place, in right quantity, at right time (there are many other Rs which people add on, but we will stay simple here) – is the catch phrase. The aim is to churn the cash faster so that more of it sticks around for longer.
Consider Figure 2 below which shows profits margins on sales for 2012 for 932 companies ranked in a descending order. The names of the companies are not shown on the figure, and all we are interested in is to divide this universe of companies into five sub-universes ranked by profit margins. The highest ranked 20% of the companies get a score of 5 on $eed-to-$tore efficiency because indeed profit margins are derived from efficiencies.
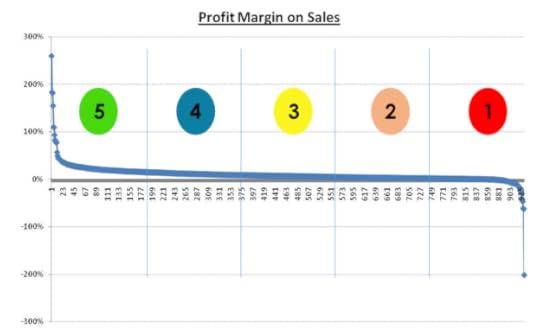
Figure 2 – Profit Margin 2012 for 932 companies
Even if in some cases, such as Amazon’s margin of 1%, where the profit margins are very low placing them lower on $eed-to-$tore efficiency measure than would be warranted from other internal variables, this deficiency will be made up in other measures such as Market Value to Profits ratio (for example in Amazon’s case it is 125 compared to the market average of 14.9).
Let us see how that happens.
Consider Figure 3 which shows similar detail for Market Value to Profits Ratio for the same 932 companies in a descending order. Obviously the order has changes this time and Amazon is not middle of the pack in this figure; rather it is one of the top performers. We use this measure as a proxy for Fire-Aim-Ready innovation – a variable which is notoriously very hard to define and measure. However, as a proxy, market price has built into it the expectations of future earnings coming from investment into useful and profitable innovation.
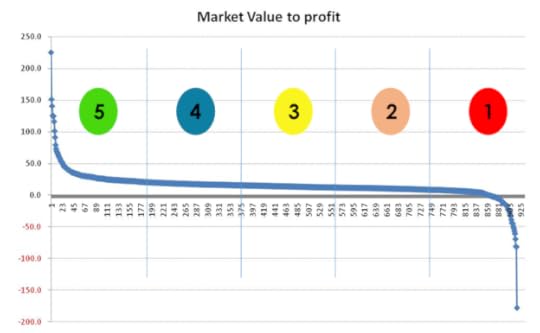
Figure 3 – Ratio of Market Value to Profit in 2012 for 932 companies
Again the proxy may not be perfect. For example Amazon is ranked one of the highest on this measure though there are other companies which might be far more innovative. However, when measured over a database of more than 1000 companies, and using rankings, rather than absolute numbers for these variables, it is possible to discernable spread of data on each of the variables of interest. Top 20% of the companies for each variable were given a score of 5, next 20% were given a score of 4 and so on, with the bottom 20% of the spread given a score of 1.
In part 3 of this blog series, I will go over the remaining three pillars underpinning Supply Chain 3.0.
Author: Vivek Sood
Related articles
SUPPLY CHAIN 3.0 IS REAL, AND HERE NOW
SUPPLY CHAIN 3.0 IS REAL, AND HERE NOW (Part 3)

April 27, 2014
SUPPLY CHAIN 3.0 IS REAL, AND HERE NOW
 When I explain to people that supply chain 3.0 is real, in general, I get three type of responses. Most of the McKinsey (or their clone) trained strategists ask me to show data to back up this assertion. On the other hand, more intuitive executives (mainly from sales and marketing background, as I observe) ask me to explain the benefits of supply chain 3.0. Finally, the third group – those who I call the transformational leaders ask a simple question – how can we use the power of supply chain 3.0 in effecting beneficial business transformations.
In this blog I will address the first question. I will leave for later blogs the remaining two questions and other arising questions such as: how does supply chain 3.0 differ from the previous versions of supply chains, and, why it was even necessary to ‘invent’ supply chains in the first place.
It is an important question – “where is the data to clearly demonstrate that Supply Chain 3.0 is real?” The data driven crowd has a legitimate concern lest a couple of isolated examples be seen as heralding a trend. Having trained at a similar top-tier consulting house during my formative years in consulting, I fully understand and endorse their questions.
Why?
Because all of us have seen people taking isolated instances and exceptions and making them so big in their own and others’ perceptions that these appear to be the predominant trends. Nay-sayers will take a few stray instances of setbacks, blow them out proportion to support their naysaying. On the other hand, almost all investment projects also have their share of overly optimistic projectionists.
In the end, only data reveals the overall picture and clarifies the confusion.
For this reason, when I wrote the book “The 5-STAR Business Network“, our team did a 6 year longitudinal study of the top 1200 corporations around the world. There were other reasons why this study was conducted – which are given in Chapter 14 of the book.
The full research methodology and the resulting ranking of the companies is also given in the book, but for our purpose here it is interesting to note that 62 companies out of the entire starting sample of the top 1200 companies in the world scored 20 points out of 25, which is our cut-off for the Supply Chain 3.0.
Also, interesting to note is that Apple – the darling of supply chain crowd – is only ranked #60 in the rankings. And, due to its low margins, Amazon – just missed the cut.
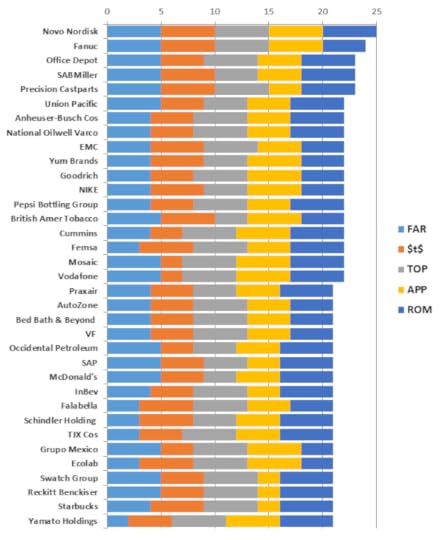
So who are the top 35 companies in these rankings? You can see them in figure 1 below. For the time being ignore the 5 colour coding, as well as funny three-letter acronyms (TLAs) in the figure.
I am absolutely sure, that this figure is unlike any other figure you might have seen before.
Firstly, the companies themselves come from around the globe – Novo Nordisk is from Denmark while Fanuc is from Japan and Falabella is from Chile. That was to be expected – if you make your research wide and deep enough you will find good companies everywhere. No country, or continent has monopoly on excellence. So much for all the hype about the Asian century.
Sure, development in Asia is creating unprecedented opportunities – but good companies around the globe are using that trend to their benefit. You do not need to be an Asian company to be excellent, but neither are all non-Asian companies uniformly good.
Figure 1: Top 35 companies out of the 62 companies with Supply Chain 3.0
Secondly, because this ranking is based on study conducted over 5 years (not at a single point in time) the standards of excellence are much higher. Also, this is a global study hence the sample base was much wider. For this reason many of the usual suspects that you might have seen elsewhere in magic circles etc are missing.
Another reason, the usual suspects might be missing is because we looked far beyond tactical operations into the strategic contribution of supply chains to corporate results.
For example, rarely has anyone tried to gauge the impact of supply chain collaboration on innovation, new product development, pipeline of products, product phasing etc. But in our research, we took these into account. For details of the research methodology, caveats, cautions and warnings about not applying these results for investment decision making please read Chapter 14 of the book “The 5-STAR Business Network“.
This is critical because I do not want you to take the results out of context and make decision based on flawed assumptions.
Time has come to talk about the 5 funny acronyms in the figure. This is because we want to see how these are linked to the strategic contribution of supply chain management to overall corporate results.
So, what do these TLAs stand for? Figure 2 below shows the details:
Figure 2: Five cornerstones of Supply Chain 3.0
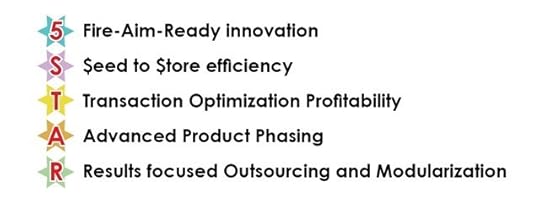
Each of these names are quite self-explanatory and most people reading this blog will not need too much explanation. I will only give brief explanation for this reason, and because detailed explanation and examples will mean that I will be recreating the book “The 5-STAR Business Network” or a version of it in this blog.
One more important conclusion needs to be drawn from the data presented in figure 1. You will notice that rarely is there a company which ranks high on each of the five key cornerstones of supply chain 3.0. Yet, all the 62 excellent companies that meet our criteria for supply chain 3.0 excel in at least three of the five key cornerstones.
That shows you do not have to perfect to arrive at supply chain 3.0 – you only need spikes of excellence in at least three of the five key areas.
Let’s now talk briefly about each of these five areas in turn.
The first is termed Fire-Aim-Ready (FAR) Innovation. Clearly, it is about creating new (better) products and services, as well as new (better) ways of configuring and delivering existing products and services. Many in supply chain – especially those from logistics or procurement – wonder what do they have to do with innovation. This mindset of not-invented-here survives from the days of materials handling (pre-supply chain days, or Supply Chain 0.0 days) in many quarters and gives supply chain a bad name when it manifests itself.
But let me ask them this – How did Apple create and launch products in nearly half the time it took its rivals while keeping utmost secrecy about the product features? The answer will give a clue to how important it is to choose the right suppliers and create the right supply chain arrangements that elevate the supply chain to lofty heights. Apple is only the most visible example, there are many more in the book.
Looking at the entire dataset, here is how the companies stack up on Fire-Aim-Ready Innovation.
Figure 3: Fire-Aim-Ready (FAR) Innovation Rankings – Supply Chain 3.0
You might ask why there are only 650 companies in the dataset when we started with 1200 companies. The reason is that over the period of the study (five-years) many of the top 1200 companies were acquired, or merged with other companies to change names. Also, many others dropped out of the top 1200 companies and were no longer of interest to us. In the end only 932 companies survived (we have ignored banks, insurance and utility companies) over 5 years in their original form to be useful for a longitudinal external study of this nature. Some companies (mainly in Banking, Finance, Insurance, Utilities and other such sectors) were not of interest to us because of their opaque supply chains and highly regulated operations.
At this point it is useful to also state that every company in the dataset was given a ranking based on the quintile it fell into on each of the five measures. That is why maximum possible points were 25. Full methodology is available in the source document, but the reason was that external data is rarely reliable enough to rank more accurately than that.
The second measure of interest to us is the $eed-to-$tore Efficiency. This, is of course, the darling of the supply chain crowd especially those coming out of logistics background. Right product, in right place, in right quantity, at right time (there are many other Rs which people add on, but we will stay simple here) – is the catch phrase. The aim is to churn the cash faster so that more of it sticks around for longer.
Consider the figure 4 below which shows profits margins on sales for 2012 for 932 companies ranked in a descending order. The names of the companies are not shown on the figure, and all we are interested in is to divide this universe of companies into five sub-universes ranked by profit margins. The highest ranked 20% of the companies get a score of 5 on $eed-to-$tore efficiency because indeed profit margins are derived from efficiencies.
Figure 4 – Profit Margin 2012 for 932 companies
Even if in some cases, such as Amazon’s margin of 1%, where the profit margins are very low placing them lower on $eed-to-$tore efficiency measure than would be warranted from other internal variables, this deficiency will be made up in other measures such as Market Value to Profits ratio (for example in Amazon’s case it is 125 compared to the market average of 14.9).
Let us see how that happens.
Consider the figure 5 which shows similar detail for Market Value to Profits Ratio for the same 932 companies in a descending order. Obviously the order has changes this time and Amazon is not middle of the pack in this figure; rather it is one of the top performers. We use this measure as a proxy for Fire-Aim-Ready innovation – a variable which is notoriously very hard to define and measure. However, as a proxy, market price has built into it the expectations of future earnings coming from investment into useful and profitable innovation.
Figure 5 – Ratio of Market Value to Profit in 2012 for 932 companies
Again the proxy may not be perfect. For example Amazon is ranked one of the highest on this measure though there are other companies which might be far more innovative. However, when measured over a database of more than 1000 companies, and using rankings, rather than absolute numbers for these variables, it is possible to discernable spread of data on each of the variables of interest. Top 20% of the companies for each variable were given a score of 5, next 20% were given a score of 4 and so on, with the bottom 20% of the spread given a score of 1.
So, what are the other three key cornerstones?
Transaction Optimisation Profitability (TOP) measures the ability to simultaneously minimize the costs, and maximize the revenues on each transaction that a company enters into. Consider this – there are companies today that change their pricing dynamically more than 10 million times a month. Why? To able to maximize their revenue based on pricing power they gain out of big data analytics. On the other hand these, and other, companies are constantly looking at ways to shave off fractions of pennies from each of their cost creators. There is a full discussion (chapter 10) of this in the book “The 5-STAR Business Network” and, if time allows, I might even write a whole book on this topic alone at some time in future. This is after all the hallmark of supply chain 3.0.
Advanced Product Phasing (APP) measures the ability of a company to create a pipeline of products that lead it to sustain its market leadership. How many one-hit wonders such as blackberry have you seen? Is Apple, after Steve Jobs, losing its Advanced Product Phasing capability? How can a company balance its drive to milk the current products with its drive to create new products? These are some of the interesting questions that you can explore in more detail once you start thinking in the realms of Advanced Product Phasing (APP). Suffice it to say here that it is one of the key cornerstones of supply chain 3.0.
Finally, Results-focused, Modularised Outsourcing (ROM) is so important to supply chain 3.0 that I have already written a follow-up book to talk about this concept. If you read nothing else on this topic, just the foreword by an illustrious strategist and CEO (Philippe Etienne, Managing Director & CEO, ) is worth reading. Here is an excerpt:
Today, when I mentor C-Level executives on how to make the jump to the role of CEO, many struggle to move their thinking from functional excellence to cross-functional leadership. In many people’s minds, even the characterization of a corporate leader seems to be shrouded in mystery– ranging from a motivational speaker to a whip wielding slave-driver.
One thing I have noticed all good corporate leaders have in common is their ability to pick and extract the power from uncommon teams – teams of internal experts and external service providers who can aggregate, work well together under pressure, and create the magic called success.
That is where it becomes critical to outsource well. No doubt, today every company outsources at least some part of its activities. With outsourcing being so ubiquitous now, and of such strategic importance that some of the best known businessmen on earth spend a significant amount of their time getting it right – it is a wonder why many people are not taking it just as seriously as these business stalwarts are.
So, what does the data say about how real is supply chain 3.0. We already noted that 62 companies meet the cut-off of 20 points out of 25. Let us now look at the rest of the database and try to answer the question that is on everyone’s mind.
Figure 6 – Ratio of Market Value to Profit in 2012 for 932 companies
As shown in the figure 6, only 5% of the companies in our dataset of 1200 global leaders meet the criteria for supply chain 3.0 and another 30% meet the criteria for supply chain 2.0. Rest of the companies (nearly 65% or 780 companies out of 1200) are somewhere between supply chain 0.0 and supply chain 1.0.
You can see the list in the appendix of the book “The 5-STAR Business Network“. Just be mindful that no company is uniformly excellent, or sub-par in all its divisions and geographical areas, although the results above show them as such. From our work in various divisions of the same corporation we know that pockets of excellence do exist in many sub-par companies and vice-versa. In fact, one of the biggest sources of supply chain friction is exactly this – the variability (sigma) of supply chain performance between various parts of the same business network. But, that is a topic for another blog.
While we have seen from the data above that supply chain 3.0 is real, here and now. In future blog posts we will establish the internal workings of supply chain 3.0 and show the transition points from supply chain 2.0 to supply chain 3.0, from supply chain 1.0 to supply chain 2.0, and further on from supply chain 0.0 to supply chain 1.0. Why was it necessary to ‘invent’ supply chain management in the first place. There already existed the discipline of logistics, materials management, inventory management etc.
A company’s position on this spectrum will ultimately dictate its performance. Just as is the case in professional golf or tennis – winners in the game of supply chains or business networks take away bulk of the prize pool.
Related articles
 Finding the Right Supply Chain Model for Your Company
 What Supply Chain Means to Me? #SC4ME
 Apple’s supply chain in trouble?
 Microsoft Extends Ethical, Environmental Policies to Supply Chain
April 6, 2014
Australia leads the way to Globalisation with triple FTA with Asia’s big three
 Australia is talking with ministers from Japan, Korea and China to finalise Free Trade Agreements with the trio ahead of Tony Abbott‘s visit to Asia in April.
On Wednesday, Japan’s Farm Minister Yoshimasa Hayashi and Australia’s Trade and Investment Minister Andrew Robb failed to reach a consensus on tariff elimination. However, they confirmed negotiations would still be underway to obtain a win-win agreement after 7 years.
Specifically, Australia wants Japan to cut the current beef tariffs to 19% while Japan is only willing to go for around 30%. On the other hand, the Asian country wants Australia to slash its 5% auto tariff straight away.
If the deal goes through, Australia will become the first major farm exporting country to finalise a FTA with Japan, who has been the biggest importer of Australia’s beef.
The Australian beef industry is also awaiting the outcome of talks with Korea over the Korea-Australia free trade agreement (KAFTA), which is under ratification.
On Thursday, the upper house referred KAFTA to a Senate inquiry to get “the best deal Australia can get” for its producers. The country’s beef sector hopes the deal is ratified soon as the US – Australia’s major competitor in Korea’s beef market – has made faster progress regarding tariff slashing.
“There is a unique situation with Australia for both Japan and Korea, as there should be no competition in various sectors between Australia and Japan/Korea. If FTAs go through, we can expect to see synergies created from many supply networks, which will create value for everyone,” said Vivek Sood – CEO of Global Supply Chain Group.
Meanwhile, businesses are calling on Prime Minister Tony Abbott to finalise a FTA with China during his visit to country next month.
“It’s hard to overstate the importance and the strength of Australia’s relationship with China. China is now, by far, our largest trading partner. In some years, it’s our largest source of immigrants. And in most years, it’s our largest source of foreign tourists and students”, Mr Abbott said during an Asia Society Luncheon in Canberra.
The Department of Foreign Affairs and Trade says China’s trade with Australia reached $125 billion in 2012, with great opportunities for the beef and dairy industries.
However, critics point out China’s poor records in labour rights and environmental standards, which means compromising Australia’s standards for a FTA may be unethical.
Despite making no reference to China’s labour and environmental records, New Zealand signed an agreement with China back in 2008 and has greatly improved dairy and meat’s access to the Chinese market.
“In a globalized world, the quicker we can eliminate trade barriers and roadblocks, faster we can integrate Australian companies into the global 5-STAR Business Networks that run modern economies” said Vivek Sood, author of the book “The 5-STAR Business Network“. “Globalization has been blamed by both the extreme right and extreme left for a host of economic ills facing various nations. Having seen the effects of globalization at close quarters in more than 100 countries, I cannot disagree more. In my view the results attributed to globalization are more attributable to other factors such as human malfeasance, institutionalized corruption even in the highest places, laziness, a sense of entitlement to riches without working for them and herd mentality leading to action without thinking and many such factors – all a small part of basic human nature.”


