
SUPPLY CHAIN 3.0 IS REAL, AND HERE NOW
 When I explain to people that supply chain 3.0 is real, in general, I get three type of responses. Most of the McKinsey (or their clone) trained strategists ask me to show data to back up this assertion. On the other hand, more intuitive executives (mainly from sales and marketing background, as I observe) ask me to explain the benefits of supply chain 3.0. Finally, the third group – those who I call the transformational leaders ask a simple question – how can we use the power of supply chain 3.0 in effecting beneficial business transformations.
In this blog I will address the first question. I will leave for later blogs the remaining two questions and other arising questions such as: how does supply chain 3.0 differ from the previous versions of supply chains, and, why it was even necessary to ‘invent’ supply chains in the first place.
It is an important question – “where is the data to clearly demonstrate that Supply Chain 3.0 is real?” The data driven crowd has a legitimate concern lest a couple of isolated examples be seen as heralding a trend. Having trained at a similar top-tier consulting house during my formative years in consulting, I fully understand and endorse their questions.
Why?
Because all of us have seen people taking isolated instances and exceptions and making them so big in their own and others’ perceptions that these appear to be the predominant trends. Nay-sayers will take a few stray instances of setbacks, blow them out proportion to support their naysaying. On the other hand, almost all investment projects also have their share of overly optimistic projectionists.
In the end, only data reveals the overall picture and clarifies the confusion.
For this reason, when I wrote the book “The 5-STAR Business Network“, our team did a 6 year longitudinal study of the top 1200 corporations around the world. There were other reasons why this study was conducted – which are given in Chapter 14 of the book.
The full research methodology and the resulting ranking of the companies is also given in the book, but for our purpose here it is interesting to note that 62 companies out of the entire starting sample of the top 1200 companies in the world scored 20 points out of 25, which is our cut-off for the Supply Chain 3.0.
Also, interesting to note is that Apple – the darling of supply chain crowd – is only ranked #60 in the rankings. And, due to its low margins, Amazon – just missed the cut.
So who are the top 35 companies in these rankings? You can see them in figure 1 below. For the time being ignore the 5 colour coding, as well as funny three-letter acronyms (TLAs) in the figure.
I am absolutely sure, that this figure is unlike any other figure you might have seen before.
Firstly, the companies themselves come from around the globe – Novo Nordisk is from Denmark while Fanuc is from Japan and Falabella is from Chile. That was to be expected – if you make your research wide and deep enough you will find good companies everywhere. No country, or continent has monopoly on excellence. So much for all the hype about the Asian century.
Sure, development in Asia is creating unprecedented opportunities – but good companies around the globe are using that trend to their benefit. You do not need to be an Asian company to be excellent, but neither are all non-Asian companies uniformly good.
Figure 1: Top 35 companies out of the 62 companies with Supply Chain 3.0
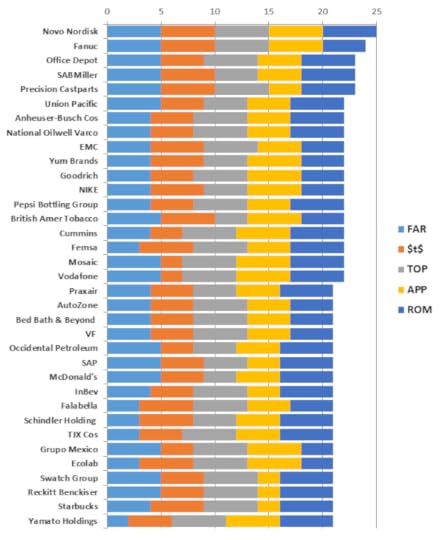
Secondly, because this ranking is based on study conducted over 5 years (not at a single point in time) the standards of excellence are much higher. Also, this is a global study hence the sample base was much wider. For this reason many of the usual suspects that you might have seen elsewhere in magic circles etc are missing.
Another reason, the usual suspects might be missing is because we looked far beyond tactical operations into the strategic contribution of supply chains to corporate results.
For example, rarely has anyone tried to gauge the impact of supply chain collaboration on innovation, new product development, pipeline of products, product phasing etc. But in our research, we took these into account. For details of the research methodology, caveats, cautions and warnings about not applying these results for investment decision making please read Chapter 14 of the book “The 5-STAR Business Network“.
This is critical because I do not want you to take the results out of context and make decision based on flawed assumptions.
Time has come to talk about the 5 funny acronyms in the figure. This is because we want to see how these are linked to the strategic contribution of supply chain management to overall corporate results.
So, what do these TLAs stand for? Figure 2 below shows the details:
Figure 2: Five cornerstones of Supply Chain 3.0
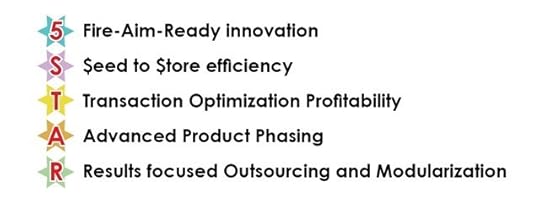
Each of these names are quite self-explanatory and most people reading this blog will not need too much explanation. I will only give brief explanation for this reason, and because detailed explanation and examples will mean that I will be recreating the book “The 5-STAR Business Network” or a version of it in this blog.
One more important conclusion needs to be drawn from the data presented in figure 1. You will notice that rarely is there a company which ranks high on each of the five key cornerstones of supply chain 3.0. Yet, all the 62 excellent companies that meet our criteria for supply chain 3.0 excel in at least three of the five key cornerstones.
That shows you do not have to perfect to arrive at supply chain 3.0 – you only need spikes of excellence in at least three of the five key areas.
Let’s now talk briefly about each of these five areas in turn.
The first is termed Fire-Aim-Ready (FAR) Innovation. Clearly, it is about creating new (better) products and services, as well as new (better) ways of configuring and delivering existing products and services. Many in supply chain – especially those from logistics or procurement – wonder what do they have to do with innovation. This mindset of not-invented-here survives from the days of materials handling (pre-supply chain days, or Supply Chain 0.0 days) in many quarters and gives supply chain a bad name when it manifests itself.
But let me ask them this – How did Apple create and launch products in nearly half the time it took its rivals while keeping utmost secrecy about the product features? The answer will give a clue to how important it is to choose the right suppliers and create the right supply chain arrangements that elevate the supply chain to lofty heights. Apple is only the most visible example, there are many more in the book.
Looking at the entire dataset, here is how the companies stack up on Fire-Aim-Ready Innovation.
Figure 3: Fire-Aim-Ready (FAR) Innovation Rankings – Supply Chain 3.0
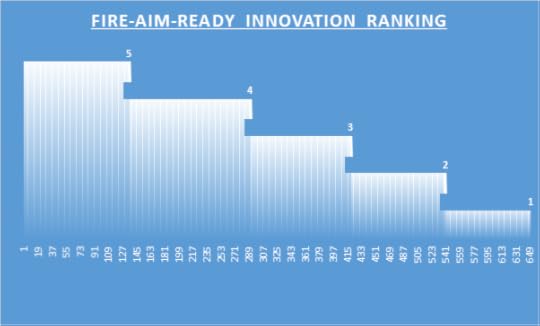
You might ask why there are only 650 companies in the dataset when we started with 1200 companies. The reason is that over the period of the study (five-years) many of the top 1200 companies were acquired, or merged with other companies to change names. Also, many others dropped out of the top 1200 companies and were no longer of interest to us. In the end only 932 companies survived (we have ignored banks, insurance and utility companies) over 5 years in their original form to be useful for a longitudinal external study of this nature. Some companies (mainly in Banking, Finance, Insurance, Utilities and other such sectors) were not of interest to us because of their opaque supply chains and highly regulated operations.
At this point it is useful to also state that every company in the dataset was given a ranking based on the quintile it fell into on each of the five measures. That is why maximum possible points were 25. Full methodology is available in the source document, but the reason was that external data is rarely reliable enough to rank more accurately than that.
The second measure of interest to us is the $eed-to-$tore Efficiency. This, is of course, the darling of the supply chain crowd especially those coming out of logistics background. Right product, in right place, in right quantity, at right time (there are many other Rs which people add on, but we will stay simple here) – is the catch phrase. The aim is to churn the cash faster so that more of it sticks around for longer.
Consider the figure 4 below which shows profits margins on sales for 2012 for 932 companies ranked in a descending order. The names of the companies are not shown on the figure, and all we are interested in is to divide this universe of companies into five sub-universes ranked by profit margins. The highest ranked 20% of the companies get a score of 5 on $eed-to-$tore efficiency because indeed profit margins are derived from efficiencies. 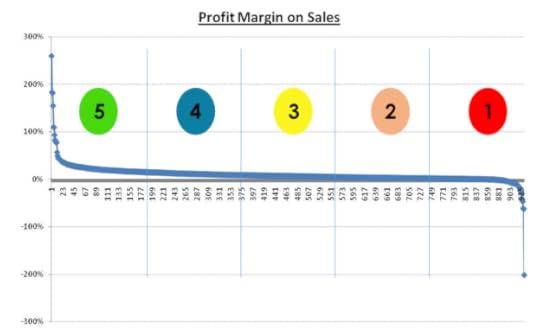
Figure 4 – Profit Margin 2012 for 932 companies
Even if in some cases, such as Amazon’s margin of 1%, where the profit margins are very low placing them lower on $eed-to-$tore efficiency measure than would be warranted from other internal variables, this deficiency will be made up in other measures such as Market Value to Profits ratio (for example in Amazon’s case it is 125 compared to the market average of 14.9).
Let us see how that happens.
Consider the figure 5 which shows similar detail for Market Value to Profits Ratio for the same 932 companies in a descending order. Obviously the order has changes this time and Amazon is not middle of the pack in this figure; rather it is one of the top performers. We use this measure as a proxy for Fire-Aim-Ready innovation – a variable which is notoriously very hard to define and measure. However, as a proxy, market price has built into it the expectations of future earnings coming from investment into useful and profitable innovation.
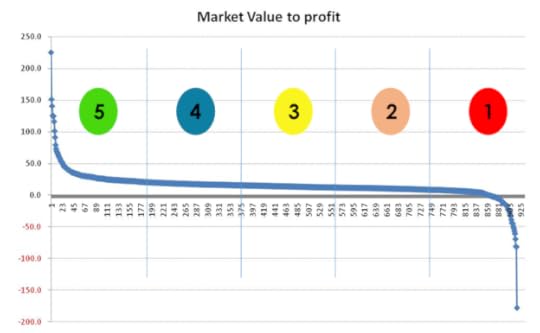
Figure 5 – Ratio of Market Value to Profit in 2012 for 932 companies
Again the proxy may not be perfect. For example Amazon is ranked one of the highest on this measure though there are other companies which might be far more innovative. However, when measured over a database of more than 1000 companies, and using rankings, rather than absolute numbers for these variables, it is possible to discernable spread of data on each of the variables of interest. Top 20% of the companies for each variable were given a score of 5, next 20% were given a score of 4 and so on, with the bottom 20% of the spread given a score of 1.
So, what are the other three key cornerstones?
Transaction Optimisation Profitability (TOP) measures the ability to simultaneously minimize the costs, and maximize the revenues on each transaction that a company enters into. Consider this – there are companies today that change their pricing dynamically more than 10 million times a month. Why? To able to maximize their revenue based on pricing power they gain out of big data analytics. On the other hand these, and other, companies are constantly looking at ways to shave off fractions of pennies from each of their cost creators. There is a full discussion (chapter 10) of this in the book “The 5-STAR Business Network” and, if time allows, I might even write a whole book on this topic alone at some time in future. This is after all the hallmark of supply chain 3.0.
Advanced Product Phasing (APP) measures the ability of a company to create a pipeline of products that lead it to sustain its market leadership. How many one-hit wonders such as blackberry have you seen? Is Apple, after Steve Jobs, losing its Advanced Product Phasing capability? How can a company balance its drive to milk the current products with its drive to create new products? These are some of the interesting questions that you can explore in more detail once you start thinking in the realms of Advanced Product Phasing (APP). Suffice it to say here that it is one of the key cornerstones of supply chain 3.0.
Finally, Results-focused, Modularised Outsourcing (ROM) is so important to supply chain 3.0 that I have already written a follow-up book to talk about this concept. If you read nothing else on this topic, just the foreword by an illustrious strategist and CEO (Philippe Etienne, Managing Director & CEO, ) is worth reading. Here is an excerpt:
Today, when I mentor C-Level executives on how to make the jump to the role of CEO, many struggle to move their thinking from functional excellence to cross-functional leadership. In many people’s minds, even the characterization of a corporate leader seems to be shrouded in mystery– ranging from a motivational speaker to a whip wielding slave-driver.
One thing I have noticed all good corporate leaders have in common is their ability to pick and extract the power from uncommon teams – teams of internal experts and external service providers who can aggregate, work well together under pressure, and create the magic called success.
That is where it becomes critical to outsource well. No doubt, today every company outsources at least some part of its activities. With outsourcing being so ubiquitous now, and of such strategic importance that some of the best known businessmen on earth spend a significant amount of their time getting it right – it is a wonder why many people are not taking it just as seriously as these business stalwarts are.
So, what does the data say about how real is supply chain 3.0. We already noted that 62 companies meet the cut-off of 20 points out of 25. Let us now look at the rest of the database and try to answer the question that is on everyone’s mind.
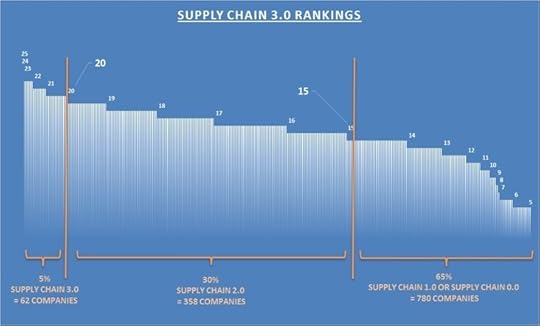
Figure 6 – Ratio of Market Value to Profit in 2012 for 932 companies
As shown in the figure 6, only 5% of the companies in our dataset of 1200 global leaders meet the criteria for supply chain 3.0 and another 30% meet the criteria for supply chain 2.0. Rest of the companies (nearly 65% or 780 companies out of 1200) are somewhere between supply chain 0.0 and supply chain 1.0.
You can see the list in the appendix of the book “The 5-STAR Business Network“. Just be mindful that no company is uniformly excellent, or sub-par in all its divisions and geographical areas, although the results above show them as such. From our work in various divisions of the same corporation we know that pockets of excellence do exist in many sub-par companies and vice-versa. In fact, one of the biggest sources of supply chain friction is exactly this – the variability (sigma) of supply chain performance between various parts of the same business network. But, that is a topic for another blog.
While we have seen from the data above that supply chain 3.0 is real, here and now. In future blog posts we will establish the internal workings of supply chain 3.0 and show the transition points from supply chain 2.0 to supply chain 3.0, from supply chain 1.0 to supply chain 2.0, and further on from supply chain 0.0 to supply chain 1.0. Why was it necessary to ‘invent’ supply chain management in the first place. There already existed the discipline of logistics, materials management, inventory management etc.
A company’s position on this spectrum will ultimately dictate its performance. Just as is the case in professional golf or tennis – winners in the game of supply chains or business networks take away bulk of the prize pool.
Related articles
 Finding the Right Supply Chain Model for Your Company
 What Supply Chain Means to Me? #SC4ME
 Apple’s supply chain in trouble?
 Microsoft Extends Ethical, Environmental Policies to Supply Chain


