
Nancy Duarte's Blog, page 29
March 14, 2012
Duarte's Diagrammer™: 4,000 Diagrams at Your Fingertips for 99 cents each

Where there is madness, Nancy Duarte finds method. This is how twenty years of sketches and infographic concepts became Diagrammer™, a searchable taxonomy of over 4,000 PowerPoint®-ready diagrams, available for you to download for just 99 cents each.
After more than twenty years of visualizing information for client presentations, Duarte designers had sketched thousands of concepts. Ever-anxious to find patterns and processes, Nancy gathered sketchbooks from each of the designers at Duarte. She then asked her trusty assistant (at the time, that was me!) to photocopy each of the pages of each of the books, so she could set to work cutting them to pieces, and sorting them. Nancy sat and sorted for hours, searching for patterns, deciding which concepts could be grouped, and which ones necessitated their own category. Lo and behold, a taxonomy emerged. This taxonomy of diagrams was featured in Chapter 3 of Nancy's first book, Slide:ology, where it quickly became one of the book's most popular sections. Shortly after Slide:ology was released, its readers began to (politely) demand that Duarte offer training. And so began the development of the Slide:ology workshop. While creating the curriculum, the diagram concepts were converted into PowerPoint®, so they could be easily implemented by attendees. These diagrams garnered such an overwhelmingly positive response, and Nancy knew people were hungry for tools to help visualize their information. A team of people set to work creating thousands of PowerPoint®-ready diagrams, and now, nearly five years later, we are proud to announce Diagrammer™!
The taxonomy has been refined a bit since its first appearance in Slide:ology. There are five main categories–Flow, Network, Stack, Segment, and Join–which we believe encompass every type of relationship between information. Each of these categories has two or more subsets, to help further clarify your data. Check out the taxonomy below, or have it explained to you by a real Duarte lab tech, in just 96 seconds.

PowerPoint® is a trademark of Microsoft, Inc., registered in the U.S. and other countries.


March 5, 2012
TED Talks, #illustraTED

It's no secret that Duarte has a big crush on TED. As presentation people, and lovers of all things story, TED is the man of our dreams. This year, we declared our love by hosting #illustraTED, a tweet-stravaganza dedicated sharing content inspired by #TED talks. (And over the weekend, they reciprocated our love by posting a little write-up about our event!)
Our team live-sketched and live-tweeted, churning out visual notes, iconic graphics, quotes, ten-word summaries, a few haiku, and even a limerick. We had a great time, even after Twitter put the kibosh on the fun. (Did you know there's a limit on the number of tweets you can tweet? Yeah, neither did we.)
We shared a few photos and videos below, but you can see 'em all in our Facebook album (no hourly limits there!) or time travel back to the event and review the @Duarte Twitter stream.
Big thanks to our followers for all the support, the wonderful people of TED for the continual inspiration, and of course, Duarte's #illustraTED team for for being straight-up amazing.

Inspired by Brene Brown (Artist: Erik Chappins)
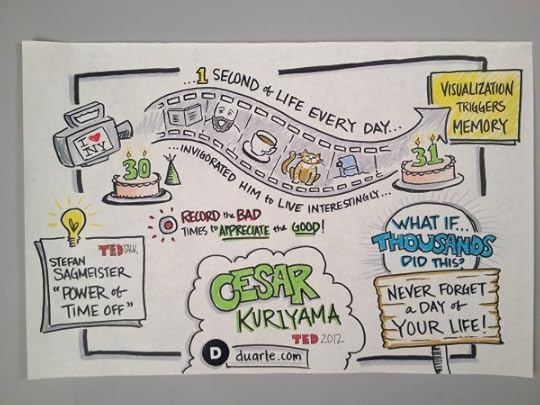
Inspired by Cesar Kuriyama (Artist: Diandra Macias)
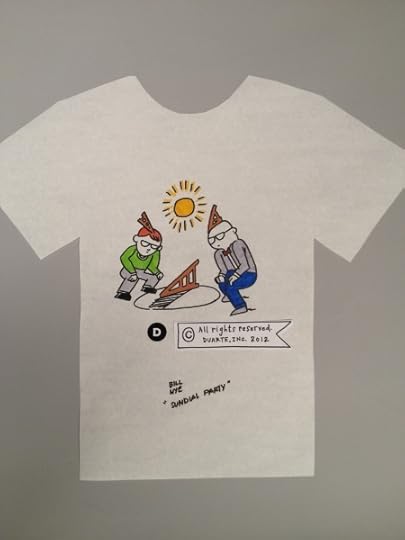
Inspired by Bill Nye @TheScienceGuy (Artist: Jonathan Valiente)
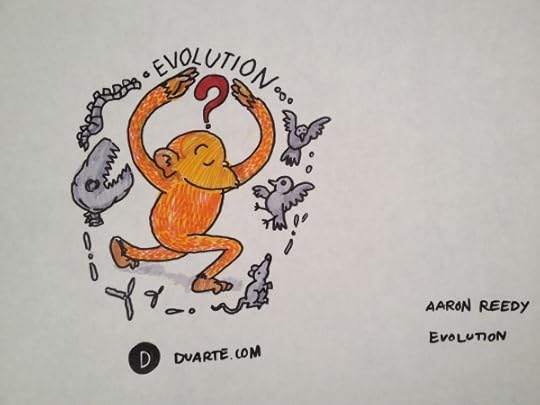
Inspired by Aaron Reedy (Artist: Jonathan Valiente)

Henrik Scharfe's TED in Ten Words

Brene Brown's TED Talk in Ten Words
Want to see sketch noting in action? Check out the making of video below.
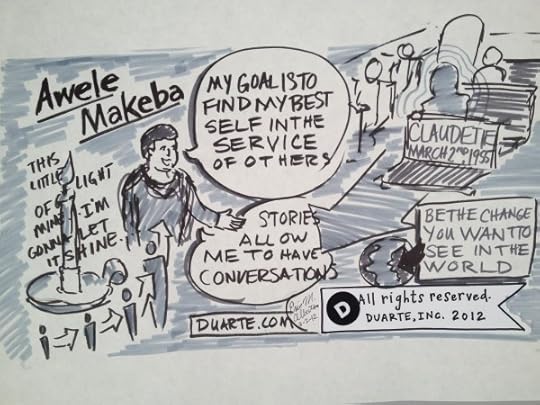
Inspired by Awele Makeba (Artist: Eric Albertson)


February 27, 2012
Duarte.com/edy Episode 2: Avoid Clichés

Bob and Finn are back for the latest Duarte.com/edy episode: Avoid Clichés.
If you like what you see, please share with your friends, and be sure to leave a note in the comments. You just might hear back from Bob or Finn in person!
Also, visit www.duarte.com/edy to see all current episodes and sign up to be notified about future ones.


February 15, 2012
Want your data to go viral? Make it visual.

How do you turn an academic report into a viral video? The Rauch Foundation challenged Duarte to solve this puzzle as they re-launched the Long Island Index in January.
The Long Island Index aims to reveal the challenges and opportunities facing Long Island through the collection of unbiased data. Like many academic documents, the reports are dense with information and aren't intended to reach a broad audience.
When they launched their last two reports, the Rauch Foundation sought Duarte's help creating a video to introduce their report at an event filled with academics, foundation supporters and those with an interest in the future of Long Island. Following the event they published the video online. Since these projects were tailored to introduce several other presentations, Duarte built videos resembling self-animated slides that highlighted key data and findings in the reports.
But this year, the Rauch Foundation had bigger goals. Instead of focusing only on the launch event, they hoped to craft a video that had more online appeal. The more clicks, the better. Both the leaders at Rauch and the creative minds at Duarte knew that they needed to think outside the box if they were going to turn zoning laws into entertainment. Luckily, the Rauch leaders were open to new ideas and suggested an RSA-style animation.
The Rauch and Duarte teams worked together to winnow all of the report's findings down to five minutes worth of content. The team wrote a voiceover script suited to the casual type of conversation you might hear between friends in a coffee shop. When the actor generously agreed to read the voiceover, the Duarte writers adjusted the script to suit his voice.
After the script and voiceover were completed, a team of Duarte designers and producers created visuals to accompany the script and produced a video showing the animation. The final product was showcased at the launch of the new Index and has now begun its campaign to reach as many online viewers as possible.
At Duarte we're always working to try and find new ways to move people to action. We're happy that the Rauch Foundation gave us this opportunity to take sociology and make it fun for the masses!
Read the report here: http://www.longislandindex.org/
Find out more about the Rauch Foundation here: http://rauchfoundation.org/
[image error]


February 9, 2012
The Visual Thinking Revolution is Here!

We are in the midst of a "Visual Thinking Revolution" and leaders in all types of organizations are embracing visual thinking as a literacy of the future.
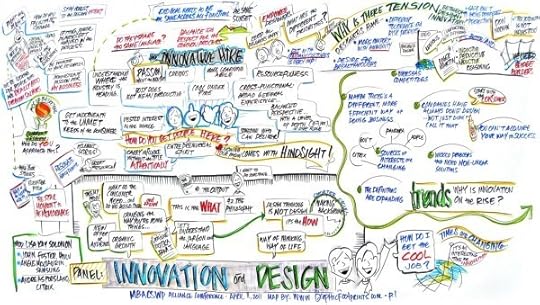
Source: MBA Career Service Professionals (click to enlarge)
This revolution's "tipping point" came earlier this year at the International Forum for Visual Practitioners annual conference, which drew 100 visual practitioners from across the globe. The panel I moderated with Business Models Inc. CEO Patrick van der Pijl and Doodle Revolution's Sunni Brown kicked off the conference with an expansive discussion on the future of visual thinking. Captured by three different graphic recorders in real time, we explored 10 significant external forces that are fueling the Visual Thinking Revolution:
We live in an increasingly VUCA world. Vulnerable, Uncertain, Complex and Ambiguous. Each day we're bombarded with too much noise and not enough signal. Visual thinking helps us break down complex problems into simple pictures (Thank you, Dan Roam for showing us the way to make ideas come alive on the back of a napkin!)
Advances in neuroscience and fMRI technology demonstrate that our brains are more creative and imaginative when operating under reward vs. threat conditions. If you want to create reward conditions that encourage participation, use simple, welcoming, hand-drawn pictures that everyone can understand. Want to create threat conditions? Hefty text-driven, data-filled, bullet-pointed PowerPoint presentations should get you there in no time.
Best selling authors are codifying their "magic". Thanks to Nancy Duarte's bestselling Slide:ology and Resonate, Dan Roam's Back of the Napkin books and Blah, Blah, Blah, and Alex Osterwalder and Yves Pignes' Business Model Generation we're creating a whole new leadership discipline around visual storytelling and visual modeling in service of business and innovation.
Technology gives us exciting new tools. Wide adoption of touch screen tablets and accompanying apps enable easy, real-time, visual capture and sharing of ideas. Some app recommendations include: Adobe Ideas, Sketchbook Pro, Bamboo Paper, Penultimate, Art Set.
Viral channels spread the word—and pictures. Millions of animated RSA videos were watched and shared in 2011, with the TED talks by Sir Ken Robinson and Dan Pink on creativity and innovation converting even the most left-brained thinkers to the power of visual communication.
Mainstream media catches on. Beyond traditional supporters like Fast Company, 2011 saw coverage in mainstream journalism, with stories on visual thinking featured in Harvard Business Review, The Washington Post and CNN.
New sources of talent and training proliferate. Sensing a growing demand for visual skills, new kinds of training are popping up, ranging from one-day workshops, such as "Introduction to Graphic Recording" to online seminars and virtual learning.
"Design Mania" becomes a movement. With no end in site for the excitement surrounding design as a strategic competence, visual thinking is riding the coattails of IDEO and Stanford's d. school, which have pimped the value of Sharpies and post-its.
New investors and incubators emerge. Design-based angel funds and start-up incubators are catching the visual-thinking fever, realizing that superb customer experience may trump over-hyped technology. It's no secret that a napkin sketch is the ultimate low-res prototype.
New audiences arise. Perhaps most significant, is the demand and excitement expressed by new audiences. Visual thinking is NOT just for artists. It's for business people, entrepreneurs, NGOs, government leaders, teachers, kids. Nor is it just a Western phenomena; visual thinking is going global, from Asia to Africa to South America. Wherever you find good ideas and stories to tell, you'll find visual thinking.
If you're still not convinced that the Visual Thinking Revolution has arrived, what could be better proof than the Saturday Night Live parody of the visual thinking-inspired UPS commercial.
Looking forward, we can expect that each of these emerging trends will only get stronger. The world will be more complex and overwhelming. Adaption of new technologies will accelerate. Companies will continue to chase growth in the midst of new competitors and customer demands. People will seek out communicative leaders who can help us feel safe, grounded, understood and inspired in the midst of all of this noise and uncertainty. The question is who among us will be the first to embrace the full potential of visual thinking as individual and organizational catalysts for leading innovation and change, helping make our work more meaningful and productive.
At this time of year when we when we have made promises to do things differently— eat healthier, hit the gym more— how about also resolving to wield a marker in service of communicating new ideas and possibilities? It doesn't matter if you think you "can't draw;" visual thinking isn't about artistic ability, but about passion for innovation and change. The revolution is calling: pick up your pen and change the world!
Lisa Kay Solomon is a guest contributor to the Duarte Blog. Lisa is an adjunct professor for the California College of the Art's new MBA in Design Strategy. She teaches visual thinking as a mandatory literacy for innovation leaders of the future as part of her Innovation Studio course.
[image error]


February 3, 2012
Creative Like a Fox! Dan Roam and I Compare Notes on Creative Process

Dan Roam schools me on creative process. His new book, BLAH BLAH BLAH, offers awesome tips on how to utilize visual and verbal concepts to refine ideas to their most pure state.


February 2, 2012
Are You a Fox or a Hummingbird? Dan Roam Explains Your Brain

Dan Roam uses an animalistic metaphor to explain how your brain processes information, and reveals how to help facilitate communication between our verbal and visual minds. That and more in his new book, BLAH BLAH BLAH.


February 1, 2012
Grammar Ain't Just for Words Anymore

Dan Roam used the rules of verbal grammar to build a Visual Grammar Graph that bridges the gap between verbal and visual concepts. Vivid Grammar is featured in his new book, BLAH BLAH BLAH.


January 31, 2012
Quit Talking and Start Thinking

Dan Roam explains why we talk too much, and how we can use our predilection for vision to become better problem solvers. "Vivid Thinking" is one of the many gems in his new book, BLAH BLAH BLAH.
[image error]


January 25, 2012
Obama's SOTU: What Is, and What Could Have Been

Last night President Barack Obama delivered what could be considered the biggest presentation of the year. In outlining his vision for America and his legislative priorities for 2012, the President attempted to persuade a variety of different audiences – including the United States Congress, business leaders and 25 million members of the American public – that he has a plan to continue improving the lives of Americans.
So how did he do? Leaving aside the merit of his proposals, did he tell a story compelling enough to convince such a broad audience?

Graphic recording of the State of the Union address created by Duarte designer Dave Nguyen
President Obama used several valuable tactics to make his case. Rather than focusing only on statistics when trying to communicate employment figures or strategies to create jobs, he contrasted these statistics with stories of real Americans struggling to make ends meet. After pointing to "millions of Americans" who "are looking for work," he talked about Jackie Bray, a single mother from North Carolina who found a new job after participating in a training program, and Bryan Ritterby, a man who lost his job in the furniture industry but now works for a wind turbine manufacturer. The president's speechwriters clearly gave thought to how to personalize the hardships facing many Americans and how to suggest that the president is in touch with these struggles.
Interestingly, both President Obama and Governor Mitch Daniels of Indiana (who delivered the official Republican response) evoked the late Steve Jobs as an example of a job creator. Although the two men told very different stories about the role of government in job creation, their common allusion suggests that American cultural references don't differ as much from Republican to Democrat as we may think.
President Obama also used several clever rhetorical tricks to make certain ideas stand out. He created contrast between "what is" and "what could be" should Congress take his suggested action. For example, he used this strategy when describing the tax code.
"Right now, companies get tax breaks for moving jobs and profits overseas. Meanwhile, companies that choose to stay in America get hit with one of the highest tax rates in the world."
"If you're a high-tech manufacturer, we should double the tax deduction you get for making products here. And if you want to relocate in a community that was hit hard when a factory left town, you should get help financing a new plant, equipment, or training for new workers."
What is
What could be
Even his call to action contained this contrast by comparing what we need to "stop" and what we need to "start." He used this type of language repeatedly throughout the speech to help reinforce his message that America's "future is hopeful" if we move forward.
He also consistently used visual language and phrases meant to resonate and be repeated. When describing Washington partisanship the president said we have to "lower the temperature in this town" to end the "perpetual campaign of mutual destruction." He evoked the ideas of historical figures like the "Republican Abraham Lincoln" to emphasize the possibility of uniting Washington and the country. And he played on the words of President John F. Kennedy when he challenged business leaders to "ask yourselves what you can do to bring jobs back to your country" and promised that "your country will do everything we can to help you succeed."
President Obama saved the most memorable part of his speech for the close. But his S.T.A.R. moment for the night was also his biggest missed opportunity. In detailing his personal recollection of the mission to apprehend Osama Bin Laden, he constructed a striking metaphor for creating unity across America.
"Those of us who've been sent here to serve can learn from the service of our troops. When you put on that uniform, it doesn't matter if you're black or white; Asian or Latino; conservative or liberal; rich or poor; gay or straight. When you're marching into battle, you look out for the person next to you, or the mission fails. When you're in the thick of the fight, you rise or fall as one unit, serving one Nation, leaving no one behind.
One of my proudest possessions is the flag that the SEAL Team took with them on the mission to get bin Laden. On it are each of their names. Some may be Democrats. Some may be Republicans. But that doesn't matter. Just like it didn't matter that day in the Situation Room, when I sat next to Bob Gates – a man who was George Bush's defense secretary; and Hillary Clinton, a woman who ran against me for president.
All that mattered that day was the mission. No one thought about politics. No one thought about themselves. One of the young men involved in the raid later told me that he didn't deserve credit for the mission. It only succeeded, he said, because every single member of that unit did their job – the pilot who landed the helicopter that spun out of control; the translator who kept others from entering the compound; the troops who separated the women and children from the fight; the SEALs who charged up the stairs. More than that, the mission only succeeded because every member of that unit trusted each other – because you can't charge up those stairs, into darkness and danger, unless you know that there's someone behind you, watching your back.
So it is with America. Each time I look at that flag, I'm reminded that our destiny is stitched together like those fifty stars and those thirteen stripes. No one built this country on their own. This Nation is great because we built it together. This Nation is great because we worked as a team. This Nation is great because we get each other's backs. And if we hold fast to that truth, in this moment of trial, there is no challenge too great; no mission too hard. As long as we're joined in common purpose, as long as we maintain our common resolve, our journey moves forward, our future is hopeful, and the state of our Union will always be strong."
This story was powerful because of its personal nature but also because of the themes of commonality and the powerful visual imagery he used.
But this message could have been even more impactful had he built on it throughout the speech. The best presentations have a common theme or message, a purpose that we at Duarte often call the "throughline." Although the president's address was powerful in pieces, it often lacked a common overarching theme to tie the elements together. While he may have intended to create this throughline by introducing the military as an example of unity in the beginning, this common message was often lost in the bulk of his words.
Audience members who viewed the "enhanced content" online may have had similar thoughts. Although the president avoided some of the worst PowerPoint crimes – he generally avoided bulleted slides and he made good use of statistics by not overwhelming the viewers with information – the materials lacked a common visual theme and did not always take advantage of the images painted by his powerful words.
President Obama did a lot right last night. When picked apart, sections of his address resonate with the type of language that good writers challenge themselves to craft. But as a whole, the 2012 State of the Union needed a good dose of the unity that the president challenged the nation to create.
To view last night's State of the Union, visit:
http://www.whitehouse.gov/
You can also find the "enhanced content" on SlideShare at:
http://www.slideshare.net/whitehouse/state-of-the-union-enhanced-graphics
The Republican Response is available at:
http://www.cbsnews.com/video/watch/?id=7396293n
[image error]


